Unlocking the Microbial Metabolome: A Comprehensive Guide to the DEREPLICATOR+ Algorithm for Natural Product Identification
This article provides a detailed exploration of the DEREPLICATOR+ algorithm, a transformative computational tool designed to accelerate natural product discovery by solving the critical bottleneck of dereplication—the early identification of...
Unlocking the Microbial Metabolome: A Comprehensive Guide to the DEREPLICATOR+ Algorithm for Natural Product Identification
Abstract
This article provides a detailed exploration of the DEREPLICATOR+ algorithm, a transformative computational tool designed to accelerate natural product discovery by solving the critical bottleneck of dereplication—the early identification of known compounds in complex biological extracts. Tailored for researchers, scientists, and drug development professionals, it covers the foundational need for dereplication in the face of frequent compound re-discovery, explains the core methodology of in silico mass spectral database searching, and outlines its practical application within platforms like GNPS. The scope extends to troubleshooting common analytical challenges, optimizing parameters for diverse metabolite classes, and validating results through statistical false discovery rate control. Furthermore, the article positions DEREPLICATOR+ within the broader computational metabolomics landscape, comparing its capabilities against precursor and alternative tools, and discusses its integrative role with genomic mining and molecular networking for a holistic discovery pipeline.
The Dereplication Imperative: Why Identifying Known Metabolites is Critical for Novel Drug Discovery
The discovery of novel, bioactive natural products (NPs) from microbial sources is a cornerstone of pharmaceutical development. However, this field is critically hampered by the persistent and costly challenge of rediscovery—the repeated isolation and characterization of known compounds [1]. This bottleneck wastes substantial resources, as the intricate process of isolating and structurally elucidating a compound can culminate in the realization that it is already documented. Dereplication, the process of early identification of known compounds within complex extracts, is therefore not merely a preliminary step but a fundamental strategy to steer research efforts toward novelty [2].
Traditional dereplication methods, often reliant on simple mass or formula matching, are insufficient due to the vastness and redundancy of chemical databases, where numerous unique structures share the same molecular formula [2]. The advent of tandem mass spectrometry (MS/MS) and computational metabolomics has transformed this landscape. By comparing the fragmentation patterns of unknown analytes against libraries of known compounds, researchers can achieve confident early-stage identifications [3]. The DEREPLICATOR+ algorithm represents a significant leap forward in this domain. By employing an advanced in silico fragmentation graph approach, it extends high-confidence dereplication beyond peptides to encompass major NP classes like polyketides, terpenes, and benzenoids, thereby clearing a more efficient path toward the discovery of truly novel therapeutic candidates [2] [4].
The DEREPLICATOR+ Algorithm: Core Principles and Advancements
DEREPLICATOR+ is engineered to address the limitations of its predecessor and other spectral matching tools. Its core innovation lies in its generalized model for simulating mass spectral fragmentation from chemical structures.
- Fragmentation Graph Model: The algorithm constructs a detailed fragmentation graph from the candidate molecule's structure. Unlike DEREPLICATOR, which primarily cleaved amide (N–C) bonds in peptides, DEREPLICATOR+ considers a broader set of bonds, including O–C and C–C bonds, and allows for multi-stage fragmentation [4]. This enables accurate prediction of spectra for diverse chemical scaffolds.
- Statistical Significance Scoring: Each match between an experimental spectrum and a theoretical fragmentation graph is assigned a statistically validated score. The tool controls the false discovery rate (FDR), allowing researchers to set confidence thresholds (e.g., 1% FDR) for reported identifications [2].
- Integration with Molecular Networking: Identifications are powerfully extended through molecular networking. When one spectrum is identified, the algorithm can propagate this annotation to other, related spectra within the same molecular family or cluster, revealing both known compounds and their structural variants [2] [3].
Table 1: Benchmark Performance: DEREPLICATOR+ vs. DEREPLICATOR [2]
| Metric | DEREPLICATOR (1% FDR) | DEREPLICATOR+ (1% FDR) | Improvement Factor |
|---|---|---|---|
| Unique Compounds Identified | 73 | 488 | 6.7x |
| Total MS/MS Spectral Matches | 166 | 8,194 | 49.4x |
| Avg. Spectra per Compound | 2.2 | 16.7 | 7.6x |
| Compound Classes | Peptidic Natural Products (PNPs) | PNPs, Polyketides, Terpenes, Benzenoids, Lipids | Greatly Expanded |
The performance gain is substantial. As shown in Table 1, in a benchmark using actinobacterial spectra (SpectraActiSeq), DEREPLICATOR+ identified 6.7 times more unique compounds at the same 1% FDR threshold [2]. This dramatically increases the efficiency of analyzing large-scale MS/MS datasets, such as those in the Global Natural Products Social (GNPS) molecular networking infrastructure [2].
Application Notes: Protocol for Microbial Metabolite Dereplication
The following integrated protocol outlines a standard workflow for using DEREPLICATOR+ within the GNPS ecosystem for high-throughput dereplication of microbial extracts.
Protocol: LC-MS/MS Analysis and Data Preparation for GNPS/DEREPLICATOR+
Objective: To generate and prepare high-resolution LC-MS/MS data from microbial culture extracts for dereplication analysis.
Materials:
- Microbial culture extract (lyophilized or in solvent).
- HPLC-grade solvents (water, acetonitrile, methanol) with 0.1% formic acid.
- Reversed-phase UHPLC column (e.g., C18, 2.1 x 100 mm, 1.7 µm).
- High-resolution tandem mass spectrometer (e.g., Q-TOF, Orbitrap) capable of data-dependent acquisition (DDA).
Procedure:
- Sample Preparation: Reconstitute lyophilized extract in a suitable solvent (e.g., 80% methanol). Centrifuge to remove particulate matter.
- LC Method: Inject sample onto the column. Employ a binary gradient (e.g., 5% to 100% acetonitrile in water over 20 minutes, both with 0.1% formic acid) at a flow rate of 0.4 mL/min.
- MS Method (DDA Mode):
- MS1 Survey Scan: Acquire at high resolution (e.g., 70,000 @ m/z 200) over a mass range of m/z 150-2000.
- MS2 Fragmentation: Select the top 5-10 most intense ions from the MS1 scan for fragmentation per cycle. Use a dynamic exclusion window of 15 seconds. Fragment ions using stepped collision energies (e.g., 20, 40, 60 eV) to generate rich spectral data.
- Data Conversion: Convert raw instrument files (.d, .raw) to open formats (.mzML, .mzXML, .mgf) using software like MSConvert (ProteoWizard). Ensure centroiding of spectra is selected during conversion [3].
Protocol: Dereplication Analysis via GNPS and DEREPLICATOR+
Objective: To annotate known metabolites and their variants in the prepared MS/MS data.
Procedure:
- Access GNPS: Navigate to the GNPS website and log in [4].
- Upload Data: In the DEREPLICATOR+ workflow page, upload your converted .mzML files using the FTP client or "Upload Files" option [4].
- Parameter Configuration:
- Basic Options: Set precursor and fragment ion mass tolerances according to your instrument's performance (default: ±0.005 Da and ±0.01 Da, respectively) [4].
- Advanced Options:
- Job Submission and Monitoring: Submit the job with a descriptive title. Monitor progress via the job status page. Completion time depends on dataset size.
- Result Interpretation:
- Access the "View Unique Metabolites" page. Results are sorted by score, with top hits representing the most confident identifications [4].
- Analyze the "View All MSM" page for detailed spectral match information.
- Cross-reference high-scoring hits with molecular networks in GNPS to visualize related variants and novel analogs within the same cluster [2].
Table 2: Key Research Reagent Solutions and Tools for Dereplication
| Item | Function/Description | Relevance to Pipeline |
|---|---|---|
| AntiMarin / DNP Databases | Curated databases of natural products, often with microbial origin annotations [2]. | Primary reference libraries for structural matching in DEREPLICATOR+. |
| GNPS Public Spectral Libraries | Crowdsourced libraries of annotated experimental MS/MS spectra [2]. | Used for direct spectral library matching, complementing in silico predictions. |
| AllDB (in GNPS) | A aggregated in silico database of ~720,000 compound structures [4]. | The default structural database for DEREPLICATOR+ searches on GNPS. |
| HiTES (High-Throughput Elicitor Screening) Media | A technique using 500-1000 different culture conditions to activate silent biosynthetic gene clusters (BGCs) [5]. | Generates novel chemical diversity from known microbial strains, creating new samples for dereplication. |
| Formic Acid / Ammonium Acetate | Common LC-MS mobile phase additives that promote protonation or deprotonation of analytes. | Critical for generating high-quality, reproducible ionization and fragmentation data. |
| Molecular Networking (GNPS) | A visualization tool that clusters MS/MS spectra based on similarity, forming chemical families [3]. | Essential for propagating annotations from known compounds to unknown variants. |
| antiSMASH 5.0+ | Bioinformatics tool for the genomic identification and analysis of BGCs [5]. | Guides targeted discovery by predicting NP class, informing which dereplication databases are most relevant. |
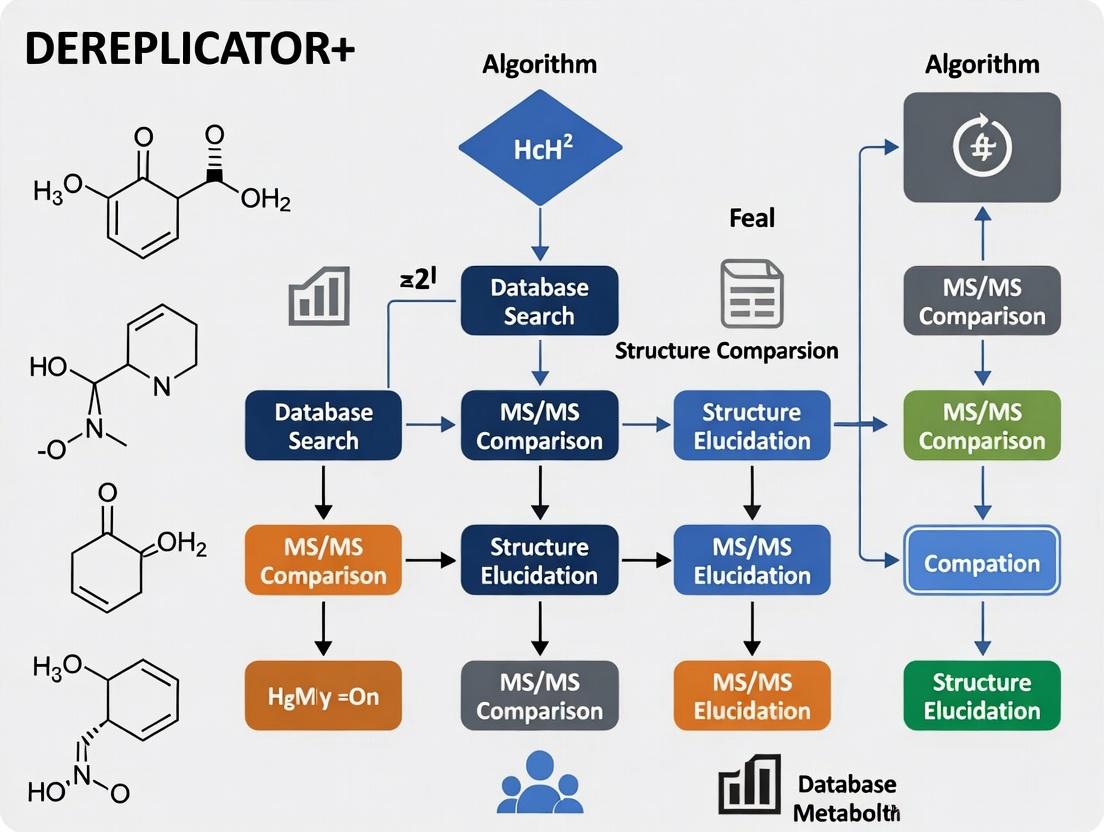
Visualizing the Workflow: From Data to Discovery
The following diagrams illustrate the integrated dereplication workflow and the core algorithmic logic of DEREPLICATOR+.
Diagram 1: Integrated Dereplication and Discovery Workflow
Diagram 2: DEREPLICATOR+ Algorithmic Pipeline
The discovery of novel microbial metabolites, a critical source for antibiotics and other therapeutics, has long been hampered by the high rate of rediscovering known compounds. This challenge necessitated the development of dereplication—the process of rapidly identifying known natural products in a sample to prioritize novel entities for further investigation [2]. Early dereplication strategies, limited by technology, primarily relied on comparing basic physicochemical properties or simple mass-to-charge ratios against small, curated databases [6].
The field was transformed by the advent of tandem mass spectrometry (MS/MS) and public spectral data repositories. The launch of the Global Natural Products Social (GNPS) molecular networking infrastructure created an unprecedented public repository of mass spectra, turning dereplication into a high-throughput data science challenge [2] [7]. Initial computational tools, however, were narrow in scope. The original DEREPLICATOR algorithm, a significant breakthrough, was specifically designed for Peptidic Natural Products (PNPs) like nonribosomal peptides (NRPs) and ribosomally synthesized and post-translationally modified peptides (RiPPs) [7]. It operated by disconnecting amide (N–C) bonds in silico to generate theoretical fragmentation spectra for database matching.
While powerful for peptides, DEREPLICATOR could not identify major classes of clinically vital metabolites, such as polyketides, which are assembled by large enzymatic complexes via a different biochemistry involving carbon–carbon bond formation [8]. This limitation highlighted a critical gap: the need for a universal dereplication tool capable of handling the vast structural diversity of microbial metabolism. DEREPLICATOR+ was developed to bridge this gap, extending in silico fragmentation to O–C and C–C bonds and thereby enabling the identification of polyketides, terpenes, benzenoids, alkaloids, and flavonoids from MS/MS data [2] [4]. This evolution from a class-specific to a universal tool frames the core thesis of its development, establishing DEREPLICATOR+ as an indispensable algorithm for modern, high-throughput microbial metabolite identification research.
The DEREPLICATOR+ Algorithm: Core Principles and Workflow
DEREPLICATOR+ represents a fundamental expansion of the fragmentation logic used by its predecessor. The core innovation lies in its generalized approach to simulating how molecules break apart in a mass spectrometer.
Algorithmic Foundation and Expansion
Unlike DEREPLICATOR, which was optimized for the amide bonds in peptides, DEREPLICATOR+ constructs a comprehensive fragmentation graph for any given chemical structure. This model systematically considers cleavages of N–C, O–C, and C–C bonds, allowing it to predict plausible fragments for a vastly broader array of molecular architectures [2] [4]. The algorithm uses a configurable "fragmentation model" (e.g., 2-1-3, indicating a maximum of two bridges, one 2-cut, and three total cuts) to manage computational complexity while exploring multi-stage fragmentation pathways [4] [9].
Statistical Validation and Scoring
A critical component of the workflow is robust statistical validation to minimize false identifications. DEREPLICATOR+ employs a decoy database strategy and uses the MS-DPR algorithm to compute p-values for each metabolite-spectrum match (MSM) [2] [7]. Users can control the stringency of reporting via a minimum match score or by setting a False Discovery Rate (FDR). The final identifications are further enriched through molecular networking, which clusters related spectra in GNPS, allowing annotations to propagate from high-confidence identifications to spectral neighbors representing structural variants [2] [10].
Table 1: Key Algorithmic Advancements from DEREPLICATOR to DEREPLICATOR+
| Feature | DEREPLICATOR | DEREPLICATOR+ |
|---|---|---|
| Primary Target Class | Peptidic Natural Products (PNPs) | Universal metabolites (PNPs, Polyketides, Terpenes, etc.) |
| Fragmentation Bonds | Amide (N–C) bonds only | N–C, O–C, and C–C bonds |
| Fragmentation Model | Single-stage, peptide-specific | Multi-stage, generalized graph-based |
| Core Database | AntiMarin (Peptide-focused) | Integrated AllDB (~720,000 compounds) [4] |
| Typical Application | Dereplication of known peptides and variants | Comprehensive metabolite identification |
Diagram Title: DEREPLICATOR+ Algorithmic Workflow for Metabolite Identification
Application Notes: Performance and Benchmarking
DEREPLICATOR+ has been rigorously benchmarked against its predecessor and real-world datasets, demonstrating its superior performance and utility in large-scale discovery projects.
Benchmarking on Actinobacterial Datasets
In a decisive test using the SpectraActiSeq dataset (containing over 650,000 spectra from Actinomyces strains), DEREPLICATOR+ identified 488 unique compounds at a 1% FDR. This was a dramatic increase over the original DEREPLICATOR, which identified only 73 compounds under the same conditions [2]. Furthermore, DEREPLICATOR+ identified more spectra per compound on average (16.7 vs. 2.2), indicating its ability to successfully match lower-quality spectra due to its more detailed and accurate fragmentation model [2].
Identification of Diverse Compound Classes
Critically, the identifications spanned multiple compound classes. At a stringent 0% FDR, DEREPLICATOR+ identified 24 high-confidence metabolites from Actinomyces, including 19 PNPs, 2 polyketides, 2 terpenes, and 1 benzenoid [2]. This result validates the algorithm's core thesis of universal applicability. Subsequent molecular networking around these 24 "seed" metabolites revealed an additional 557 spectral variants, showcasing the tool's power in discovering both known core structures and their potentially novel derivatives [2].
Large-Scale Application on GNPS
When applied to the entire GNPS repository (approximately 248 million spectra as of 2017), DEREPLICATOR+ identified an order of magnitude more natural products than all previous dereplication efforts combined [2] [11]. This scalable performance underscores its suitability for modern high-throughput screening platforms where thousands of extracts are analyzed.
Table 2: Benchmark Performance of DEREPLICATOR+ vs. DEREPLICATOR on SpectraActiSeq Dataset [2]
| Metric | DEREPLICATOR | DEREPLICATOR+ | Improvement Factor |
|---|---|---|---|
| Unique Compounds (1% FDR) | 73 | 488 | ~6.7x |
| Total MSMs (1% FDR) | 166 | 8,194 | ~49x |
| Avg. Spectra per Compound | 2.2 | 16.7 | ~7.6x |
| Compound Classes Identified | Peptides only | Peptides, Polyketides, Terpenes, Benzenoids, Lipids | Major expansion |
Experimental Protocols
Protocol A: Web-Based Analysis via GNPS
This is the most accessible method for using DEREPLICATOR+ [10] [4].
- Data Preparation: Convert your LC-MS/MS data to an open format (
.mzML,.mzXML, or.MGF). Ensure spectra are centroided. - Access Workflow: Log in to the GNPS platform and navigate to the DEREPLICATOR+ workflow under "In Silico Tools" [4].
- Upload Data: Select your spectra file(s) for analysis. You can upload directly or select from existing GNPS datasets.
- Parameter Configuration:
- Basic Options: Set mass tolerances. Defaults (
±0.005 Dafor precursor,±0.01 Dafor fragment) are suitable for high-resolution instruments (e.g., q-TOF, Orbitrap) [4]. - Database Selection: The default
AllDB(~720,000 compounds) is recommended for general use. A custom database can be supplied. - Score Threshold: The default minimum score to report a match is 12. Adjust based on desired stringency.
- Basic Options: Set mass tolerances. Defaults (
- Job Submission: Provide an email and submit the job. Processing time depends on dataset and database size.
- Result Interpretation: Access results via the provided link. The "View Unique Metabolites" page lists annotations sorted by score. Click "Show Annotation" to visualize the alignment between the experimental spectrum and the theoretical fragmentation graph of the proposed structure [10].
Protocol B: Command-Line Analysis via NPDTools
For integration into automated pipelines or analysis of very large datasets, the command-line version is ideal [9].
- Installation: Download the NPDTools package for Linux or macOS from the GitHub repository and extract it. Ensure Python (2.7 or 3.3+) is installed.
- Prepare Input: Place all spectrum files in a directory. Prepare a chemical structure database in the required format.
Execute Command:
Key options include:
-m HH/HL/LL: Set mode for High/High, High/Low, or Low/Low resolution data to auto-set tolerances.--pm_threshand--product_ion_thresh: Manually set precursor and fragment mass tolerances in Da.--fdr: Request FDR estimation (doubles computation time).
- Output Analysis: Results are written to the specified output directory, including a list of high-confidence metabolite-spectrum matches and their statistics.
Protocol C: Integrated Dereplication in a Discovery Pipeline (e.g., Antibiotic Screening)
A practical application from recent literature integrates DEREPLICATOR+ into a multi-omics workflow for antibiotic discovery [12].
- Strain Cultivation & Extraction: Culture microbial isolates (e.g., from soil diffusion chambers) in appropriate media. Perform organic solvent extraction of secondary metabolites.
- Bioactivity Screening: Use agar overlay or microtiter plate assays against target pathogens (e.g., Staphylococcus aureus, Escherichia coli) to identify bioactive strains.
- LC-MS/MS Data Acquisition: Analyze crude extracts from bioactive strains using reversed-phase liquid chromatography coupled to high-resolution tandem mass spectrometry.
- Dereplication with DEREPLICATOR+: Process the MS/MS data through DEREPLICATOR+ (via Protocol A or B) using databases like AllDB, AntiMarin, or a custom library.
- Result Triangulation:
- Known Compounds: If a known antibiotic (e.g., actinomycin D, valinomycin) is identified with high confidence, the bioactivity is explained [12].
- Novel or Variant Compounds: If matches are low-confidence or absent, the extract is prioritized for fractionation and structural elucidation.
- Genomic Corroboration: Sequence the genome of the producing strain. Use genome mining tools (e.g., antiSMASH) to identify Biosynthetic Gene Clusters (BGCs) that match or suggest the structure of the detected metabolite [2] [12].
Diagram Title: Integrated Microbial Metabolite Discovery Pipeline with DEREPLICATOR+
Table 3: Key Research Reagent Solutions and Tools for Dereplication
| Tool/Reagent | Function/Description | Source/Example |
|---|---|---|
| LC-HRMS/MS System | Generates high-quality tandem mass spectra with accurate mass measurement. Essential for reliable database matching. | e.g., Q-TOF, Orbitrap-based instruments. |
| Chemical Structure Databases | Collections of known compounds used as reference for in silico fragmentation and matching. | AllDB (default in DEREPLICATOR+, ~720K compounds), AntiMarin, Dictionary of Natural Products, PubChem [2] [4]. |
| Spectral Data Repositories | Public libraries for matching experimental spectra against reference spectra. | GNPS Public Spectral Libraries [10] [13]. |
| Data Conversion Software | Converts proprietary mass spectrometer data files into open formats for analysis. | ProteoWizard MSConvert [9]. |
| Cultivation Media | For growing diverse microbial strains and inducing secondary metabolite production. | Reasoner's 2A (R2A) agar/broth, SMS agar for diffusion chambers [12]. |
| Bioassay Indicators | Used in initial biological activity screening to prioritize extracts. | Target pathogen strains (e.g., S. aureus), redox dyes like XTT [6] [12]. |
| Genome Mining Software | Identifies biosynthetic gene clusters in sequenced genomes to corroborate MS findings. | antiSMASH, PRISM [11]. |
| Molecular Networking Platform | Clusters MS/MS data to visualize chemical relationships and propagate annotations. | GNPS Molecular Networking [2] [10]. |
Discussion and Future Perspectives
The development of DEREPLICATOR+ marks a paradigm shift from specialized to universal dereplication. By solving the generalized in silico fragmentation problem, it has become a cornerstone tool for analyzing the vast metabolomic data generated by modern MS-based platforms [2] [6]. Its integration into the GNPS ecosystem allows seamless coupling with molecular networking, creating a powerful framework where an identification in one node of a network can illuminate an entire cluster of related molecules [10].
Future directions in the field point towards even deeper integration. Metabologenomics—the simultaneous analysis of MS data and genome sequences—is a powerful next step. Tools like MetaMiner (part of the NPDtools suite) exemplify this, using genomic predictions to guide the identification of RiPPs [9]. The ultimate goal is a fully automated, multi-omic discovery pipeline where genomics, transcriptomics, and metabolomics data are fused by algorithms to predict, detect, and identify novel bioactive metabolites with high efficiency [6] [11]. Within this evolving landscape, DEREPLICATOR+ will remain fundamental as the primary engine for the rapid, confident identification of known chemical entities from complex microbial mixtures.
Diagram Title: Evolution of Dereplication Tools Towards Universality
The discovery of novel microbial natural products, a critical source for new antibiotics and therapeutics, is fundamentally bottlenecked by the high rate of re-isolating known compounds. To clear this roadblock, researchers rely on dereplication—the process of rapidly identifying known compounds within a complex mixture early in the discovery pipeline to prioritize novel entities for further investigation [2]. Mass spectrometry (MS) has become the cornerstone of high-throughput dereplication. However, interpreting the resulting tandem mass spectrometry (MS/MS) data requires sophisticated computational frameworks, chief among them molecular networking and in silico fragmentation.
Molecular networking, as implemented by the Global Natural Products Social Molecular Networking (GNPS) platform, organizes MS/MS data based on spectral similarity, visually clustering related molecules and enabling the propagation of annotations within a chemical family [10] [2]. In silico fragmentation is the computational engine that makes database searching possible; it predicts the theoretical MS/MS spectrum of a candidate chemical structure, which is then matched against the experimental spectrum to propose an identification [10] [4].
The DEREPLICATOR+ algorithm represents a pivotal advancement that integrates these concepts. It is an in silico database search tool that uses an expanded fragmentation model to annotate not only peptidic natural products but also polyketides, terpenes, alkaloids, and other general metabolites directly from MS/MS data [2] [4]. This document details the application and protocols for employing DEREPLICATOR+ within a comprehensive microbial metabolite identification strategy.
The DEREPLICATOR+ Algorithm: An Evolution in Dereplication
DEREPLICATOR+ was developed to overcome the limitations of its predecessor, DEREPLICATOR, which was restricted to identifying peptidic natural products (PNPs) by fragmenting only amide (N–C) bonds [2]. The "+" algorithm generalizes this approach, thereby significantly expanding its scope and accuracy.
- Core Mechanism: DEREPLICATOR+ operates by converting a candidate molecule's chemical structure into a fragmentation graph. It then simulates breakages not just of N–C bonds, but also of O–C and C–C bonds, and allows for multi-stage fragmentation events [4]. This more realistic model generates a richer theoretical spectrum, leading to more confident matches against experimental data. For example, in annotating radamycin, DEREPLICATOR+ increased the match score from 9 to 25 and decreased the p-value from (3×10^{−17}) to (3×10^{−46}) compared to the original DEREPLICATOR [4].
- Performance Benchmark: A search of Actinomyces spectral datasets demonstrated the dramatic improvement. At a 1% false discovery rate (FDR), DEREPLICATOR identified 73 unique compounds, while DEREPLICATOR+ identified 488—an increase of over 6.5 times [2]. Furthermore, DEREPLICATOR+ identified many more spectra per compound (16.7 vs. 2.2 on average), indicating its ability to successfully annotate lower-quality spectra that the original tool missed [2].
Table 1: Comparative Performance of DEREPLICATOR vs. DEREPLICATOR+ on Actinomyces Spectral Data (SpectraActiSeq) [2].
| Metric | DEREPLICATOR | DEREPLICATOR+ | Improvement Factor |
|---|---|---|---|
| Unique Compounds (1% FDR) | 73 | 488 | 6.7x |
| Metabolite-Spectrum Matches (1% FDR) | 166 | 8,194 | 49.4x |
| Avg. Spectra per Compound | 2.2 | 16.7 | 7.6x |
| Compound Classes Identified | Peptidic Natural Products (PNPs) | PNPs, Polyketides, Terpenes, Benzenoids, Lipids, Alkaloids | Expanded scope |
Experimental Protocols for DEREPLICATOR+
Protocol 1: Standard Dereplication via the GNPS Web Platform
This protocol is for annotating known metabolites in a single MS/MS data file (e.g., from a purified fraction or a crude extract).
1. Sample Preparation & Data Acquisition:
- Culture your microbial strain and extract metabolites using standard organic solvents (e.g., ethyl acetate for non-polar compounds, butanol for moderate polarity, or water/methanol for polar compounds).
- Analyze the extract via reversed-phase liquid chromatography coupled to a high-resolution tandem mass spectrometer (LC-HRMS/MS).
- Export the centroided MS/MS data in an accepted format: .mzML, .mzXML, or .MGF [10] [4].
2. Data Submission to DEREPLICATOR+ on GNPS:
- Navigate to the GNPS website , create an account, and log in [10] [4].
- From the main page, locate and click on the "DEREPLICATOR+" workflow link [4].
- Upload your MS/MS data file or select an existing dataset from the GNPS repository.
- Configure Critical Parameters:
- Precursor Ion Mass Tolerance: Set to ±0.005 Da for high-resolution instruments (Orbitrap, q-TOF) [4].
- Fragment Ion Mass Tolerance: Set to ±0.01 Da for high-resolution data [4].
- Database: Use the default "AllDB" (contains ~720,000 compounds) or provide a custom database [4].
- Min Score: The default is 12. Increase for more stringent identifications (e.g., 15 for 0% FDR in benchmark studies) [2].
- Submit the job and await a completion email [10].
3. Analysis of Results:
- On the results page, click "View Unique Metabolites" for a summary list of identifications, sorted by score [4].
- Click "Show Annotation" for any compound to visualize the critical match: the experimental spectrum is shown with matched peaks highlighted, and the annotated molecular structure is displayed alongside it [10].
- Download the results table (.TSV format) for further analysis.
Protocol 2: Integrated Dereplication within a Molecular Networking Workflow
This advanced protocol embeds DEREPLICATOR+ within a molecular network to annotate entire clusters of related molecules.
1. Create a Molecular Network:
- Upload your MS/MS data file(s) to GNPS and run the "Feature-Based Molecular Networking" or "Classical Molecular Networking" job [10].
- Upon completion, download the "clustered spectra" file (in .MGF format). This file contains the consensus spectra representing each node (molecular family) in the network [10].
2. Annotate the Network with DEREPLICATOR+:
- Start a new DEREPLICATOR+ job as described in Protocol 1, but use the downloaded .MGF file of clustered spectra as the input [10].
- Run the analysis with your chosen parameters.
3. Visualize Annotations in Cytoscape:
- Download the DEREPLICATOR+ annotation results (.TSV file).
- Open your molecular network graph file in Cytoscape.
- Import the .TSV file as an attribute table (
File > Import > Table > File). Map the "Scan" column in the results to the "shared name" or "ClusterIdx" column in the network [10]. - The annotations (e.g., compound name, SMILES structure, score) are now mapped to the corresponding nodes. Use the ChemViz2 plugin to visualize the chemical structures directly on the network nodes [10].
Validation and Integration Strategies
An annotation from DEREPLICATOR+, while powerful, is a computational prediction and requires orthogonal validation to build confidence [10].
- Spectral & Chromatographic Validation: The highest confidence comes from comparing the experimental MS/MS spectrum and LC retention time with an authentic standard analyzed under identical conditions [10].
- Genomic Corroboration: When genomic data is available, the presence of a corresponding biosynthetic gene cluster (BGC) for the identified metabolite strongly supports the annotation. Tools like antiSMASH can be used for BGC prediction [12] [5]. A recent multi-omic study on soil bacteria exemplified this: MS-based dereplication identified known antibiotics, while genomic analysis confirmed the BGCs and even revealed additional compounds (like streptothricin) not initially detected by MS [12].
- Multi-Tool Consensus: Using additional in silico tools (e.g., MS2Query, CSI:FingerID, SIRIUS) for formula prediction or structure search can provide consensus support [10] [14].
- Biological Context: Assess whether the identified compound has a known biological source consistent with your sample organism by consulting resources like the Dictionary of Natural Products or AntiMarin [10].
Table 2: Key Research Reagent Solutions for DEREPLICATOR+ and Integrated Studies.
| Item / Resource | Function / Description | Application Context |
|---|---|---|
| R2A (Reasoner's 2A) Broth/Agar [12] | A nutrient-low culture medium designed to recover diverse, slow-growing environmental bacteria from samples like soil. | Microbial cultivation prior to metabolite extraction. |
| SMS Agar [12] | A soil-mimicking solid medium used in diffusion chambers for in situ cultivation of uncultivable microbes. | Cultivation in microbial diffusion chambers. |
| 0.03 µm Polycarbonate Membrane [12] | A semi-permeable membrane allowing nutrient exchange while containing microorganisms in diffusion chambers. | Construction of microbial diffusion chambers. |
| Ethyl Acetate, n-Butanol, Methanol | Organic solvents of varying polarity for metabolite extraction from aqueous culture supernatants or solid media. | Metabolite extraction prior to LC-MS/MS analysis. |
| GNPS Platform [10] [4] | A web-based ecosystem for mass spectrometry data analysis, hosting DEREPLICATOR+, molecular networking, and other workflows. | The primary computational platform for all protocols. |
| Cytoscape with ChemViz2 [10] | Open-source software for visualizing complex networks and mapping chemical structure attributes to nodes. | Visualization of annotated molecular networks. |
| AntiSMASH [5] | A bioinformatics tool for the genomic identification and analysis of biosynthetic gene clusters (BGCs). | Genomic validation of metabolite annotations. |
The field continues to evolve beyond identifying exact database matches. The next frontier is the high-throughput discovery of variants—structurally similar analogs of known molecules. Algorithms like VarQuest (for peptides) and the newer VInSMoC (for general small molecules) perform modification-tolerant searches, systematically identifying methylated, oxidized, or other derivatives present in samples [10] [14]. Integrating these tools with DEREPLICATOR+ creates a powerful pipeline: first, annotate known cores, then discover their novel variants.
In conclusion, DEREPLICATOR+ is a transformative tool that redefines dereplication by extending robust annotation to diverse chemical classes. When embedded in a workflow that includes molecular networking for contextualization and genomic tools for validation, it forms the core of a modern, efficient, and multi-tiered strategy for microbial metabolite discovery. This integrated approach is essential for accelerating the identification of novel chemical entities from the microbial world to address the urgent need for new therapeutics.
The Role of Mass Spectrometry and Public Repositories like GNPS in Modern Metabolomics
Metabolomics, the comprehensive study of small-molecule metabolites within a biological system, provides a direct functional readout of cellular activity and physiological status [15]. Mass spectrometry (MS) has emerged as the cornerstone analytical technology for this field due to its high sensitivity, resolution, and ability to characterize a vast array of chemical structures [15]. However, a central bottleneck persists: the confident identification of metabolites from complex MS data. The sheer diversity of potential structures, including unknown microbial natural products, makes this task exceptionally challenging.
This challenge is being addressed through a synergistic combination of advanced computational algorithms and public data repositories. Platforms like the Global Natural Products Social Molecular Networking (GNPS) infrastructure serve as central hubs for sharing, comparing, and annotating mass spectral data [16]. Within this ecosystem, dereplication algorithms are essential. Dereplication is the process of rapidly identifying known compounds in a sample to prioritize the discovery of novel ones [17]. The DEREPLICATOR+ algorithm represents a significant evolution in this domain. Originally designed for peptidic natural products, it has been generalized to enable the identification of a broad spectrum of microbial metabolites—including polyketides, terpenes, and alkaloids—by searching MS/MS spectra against structural databases [4] [17]. This article details the application of DEREPLICATOR+ within the integrated framework of modern MS-based metabolomics and public repositories, providing essential protocols and contextualizing its role in accelerating microbial metabolite research and drug discovery.
Algorithmic Innovation: The DEREPLICATOR+ Engine
DEREPLICATOR+ addresses key limitations of its predecessor and other early tools by implementing a more generalized and sophisticated in silico fragmentation model.
Core Algorithmic Workflow
The algorithm transforms a metabolite's chemical structure into a fragmentation graph, which is then compared to experimental tandem mass spectra (MS/MS). The core innovation lies in its expanded fragmentation rules [4] [17]:
- Graph Construction: A molecular structure is represented as a graph where atoms are nodes and bonds are edges.
- Fragmentation Graph Generation: The algorithm simulates fragmentation by breaking combinations of bonds. Crucially, DEREPLICATOR+ considers not only amide (N–C) bonds for peptides but also O–C and C–C bonds, enabling the modeling of fragmentation patterns for diverse natural product classes like polyketides and terpenes [4].
- Multi-Stage Fragmentation: It allows for multi-stage fragmentation (MSⁿ), generating theoretical fragments that result from successive breaks, which more accurately reflects true instrumental data [4].
- Scoring & Validation: Experimental spectra are annotated against these theoretical fragmentation graphs. A score is calculated based on shared peaks, and the statistical significance (p-value) of each Metabolite-Spectrum Match (MSM) is evaluated using decoy databases to control the false discovery rate (FDR) [17].
Key Advancements Over Previous Approaches
The expanded bond-breaking logic and multi-stage fragmentation model lead to tangible performance gains. For instance, in the identification of the compound radamycin, DEREPLICATOR+ increased the annotation score from 9 to 25 and reduced the p-value from (3×10^{−17}) to (3×10^{−46}) by accounting for additional fragments missed by the original model [4]. This enhanced sensitivity allows the algorithm to identify lower-quality spectra and a wider variety of compound classes.
Diagram: DEREPLICATOR+ Algorithmic Workflow and Integration
Experimental Protocols and Application Notes
Protocol: Executing a DEREPLICATOR+ Analysis on GNPS
The following step-by-step protocol is designed for researchers to perform dereplication using the DEREPLICATOR+ workflow integrated into the GNPS platform [4].
Step 1: Data Preparation and Upload
- Convert your raw LC-MS/MS data to an open format (
.mzML,.mzXML, or.mgf). - Log in to the GNPS website and navigate to the DEREPLICATOR+ workflow page.
- Upload your spectrum files directly or select an existing dataset from the GNPS/MassIVE repository.
Step 2: Parameter Configuration
- Basic Options: Set mass tolerance values appropriate for your instrument's mass accuracy. Typical defaults are ±0.005 Da for precursor ions and ±0.01 Da for fragment ions [4].
- Database Selection: Choose a pre-defined structural database. The default AllDB contains approximately 720,000 compounds [4]. For microbial natural products, the curated AntiMarin or Dictionary of Natural Products databases are highly relevant [17].
- Advanced Options:
- Fragmentation Model: The default model "2-1-3" is recommended, allowing up to two bridges, one 2-cut, and three total cuts [4].
- Minimum Significant Score: Set the threshold for reporting a match. The default is a score of 12, but a more stringent threshold (e.g., 15) can be used for lower FDR [4] [17].
Step 3: Job Submission and Result Interpretation
- Submit the job and monitor its status. Upon completion, examine the "View Unique Metabolites" page.
- Results are sorted by score. High-confidence annotations are supported by a detailed view showing the alignment between experimental and theoretical fragments.
- Use the linked molecular networking functionality within GNPS to visualize the annotated spectrum in the context of related, potentially novel analogs from your dataset and public data.
Protocol: Integrated Repository Mining with Pan-ReDU
The Pan-ReDU ecosystem enables the systematic discovery and re-analysis of public metabolomics data across major repositories (GNPS, MetaboLights, Metabolomics Workbench) [16].
Step 1: Define a Biological Query
- Formulate a research question (e.g., "Find all public data containing microbial metabolites from Actinomyces in urine samples").
- Access the Pan-ReDU dashboard and use its controlled vocabulary filters (e.g., taxonomy, sample type, body site).
Step 2: Retrieve and Harmonize Data
- The dashboard returns a list of relevant studies and files, each with a Mass Spectrometry Run Identifier (MRI).
- Use the integrated
publicdatadownloadertool or the GNPS workflow interface to download the selected raw files directly via their MRIs, bypassing manual repository navigation [16].
Step 3: Cross-Repository Analysis
- The harmonized metadata and converted
.mzMLfiles can be fed directly into the GNPS DEREPLICATOR+ and molecular networking workflows. - This allows for the dereplication of compounds not just within a single dataset, but across thousands of public experiments, significantly expanding the power to identify known metabolites and spot unusual, potentially novel chemical families.
Performance and Impact: Quantitative Insights
The integration of advanced algorithms like DEREPLICATOR+ with expanding public repositories has quantitatively transformed the scale and efficiency of metabolite identification.
Table 1: Performance Benchmark of DEREPLICATOR+ in Microbial Metabolite Identification [17]
| Dataset (Source) | # Spectra Analyzed | DEREPLICATOR Unique IDs (0% FDR) | DEREPLICATOR+ Unique IDs (0% FDR) | Fold Increase | Key Compound Classes Identified |
|---|---|---|---|---|---|
| SpectraActiSeq (Actinomyces strains) | 651,770 | 66 | 154 | 2.3x | Peptides, Lipids, Benzenoids, Polyketides, Terpenes |
| SpectraGNPS (Public repository subset) | 248.1 million | Not Reported | 5x more than prior tools | 5x | Extensive diversity across all major natural product classes |
Table 2: Scale of Public Data Integration via Pan-ReDU (as of 2024) [16]
| Repository | Total Raw Data Files in Pan-ReDU | Approx. % of Repository Covered | Characteristic Data Type |
|---|---|---|---|
| Metabolomics Workbench (NMDR) | ~270,000 | ~67% | Clinical studies, human plasma/blood, often MS1-focused. |
| MetaboLights (MTBLS) | ~251,000 | ~95% | General-purpose metabolomics, diverse sample types. |
| GNPS/MassIVE | ~123,000 | ~12% | MS/MS-focused, microbial natural products, exposomics. |
| Pan-ReDU Aggregate | ~644,000 | N/A | Harmonized, searchable via metadata and MRIs. |
Table 3: Key Reagents, Databases, and Software for DEREPLICATOR+-Integrated Research
| Item Name / Category | Function / Purpose | Specific Example / Note |
|---|---|---|
| Internal Standards (IS) | Correct for variability during metabolite extraction and MS analysis; enable semi-quantification [15]. | Stable isotope-labeled analogs of expected metabolites (e.g., amino acids, fatty acids). |
| Biphasic Extraction Solvents | Comprehensively extract metabolites of diverse polarities from biological samples [15] [18]. | Methanol/Chloroform/Water (e.g., 2:2:1.8 ratio) for simultaneous polar/non-polar metabolite recovery. |
| Structural Databases | Provide the chemical structures for in silico fragmentation by DEREPLICATOR+. | AntiMarin [17], Dictionary of Natural Products [17], AllDB (default GNPS DB) [4]. |
| Spectral Libraries | Provide reference experimental MS/MS spectra for direct matching, complementing in silico predictions. | GNPS Public Spectral Libraries, NIST MS/MS, MassBank. |
| Pan-ReDU Metadata | Enables finding relevant public datasets across repositories for re-analysis [16]. | Controlled vocabulary terms for sample type (e.g., "urine"), organism (e.g., "9606|Homo sapiens"). |
| MS Run Identifier (MRI) | A universal address for a specific mass spectrometry run file in a public repository [16]. | Used with the publicdatadownloader tool to automate data retrieval for local or cloud workflows. |
The trajectory of modern metabolomics is defined by deeper integration of artificial intelligence (AI), larger-scale repository mining, and advanced algorithmic identification. AI and machine learning models are now being applied to predict chromatographic retention time as an orthogonal filter for candidate structures, further improving identification confidence [19]. Initiatives like the Human Exposome Project highlight the demand for tools capable of annotating unknown environmental and microbial chemicals in complex biological matrices [19].
In this evolving landscape, DEREPLICATOR+ serves as a critical bridge. It translates the structural information contained in chemical databases into a searchable format for experimental MS/MS data. When embedded within the data-rich, collaborative environment of GNPS and Pan-ReDU, it transforms isolated analyses into a powerful collective discovery engine. For researchers and drug development professionals, mastering this integrated approach—combining robust experimental protocols with algorithmic dereplication and public data mining—is no longer optional but essential for advancing the discovery of microbial metabolites and novel therapeutic leads.
Inside DEREPLICATOR+: Algorithm Mechanics and Step-by-Step Workflow Implementation
The identification of microbial metabolites, especially novel natural products with potential therapeutic value, is fundamentally hampered by the persistent re-discovery of known compounds [2]. Dereplication—the process of efficiently identifying known molecules within a complex sample—is therefore a critical first step in natural product research [2]. While advances in mass spectrometry (MS) have enabled the rapid generation of vast spectral datasets, the computational interpretation of these spectra remains a bottleneck [20].
Traditional dereplication tools have been limited by narrow chemical scope, often focusing on specific compound classes like peptides, or by computational inefficiency when scaling to large databases [2]. The DEREPLICATOR+ algorithm was developed to address these limitations by introducing a generalized, graph-based approach to in silico fragmentation [4] [2]. Its core innovation lies in the automated construction of fragmentation graphs from the chemical structures of candidate molecules. This method expands the search beyond peptide bonds (N–C) to include other common cleavage sites like O–C and C–C bonds, and allows for multi-stage fragmentation, enabling the annotation of a much wider array of metabolite classes, including polyketides, terpenes, and benzenoids [4]. Within the context of a thesis on microbial metabolite identification, mastering the construction of fragmentation graphs is essential, as it forms the computational foundation for accurate, high-throughput annotation of metabolites from mass spectrometry data.
Algorithmic Principles of Fragmentation Graph Construction
From Chemical Structure to Metabolite Graph
The DEREPLICATOR+ pipeline begins by transforming a two-dimensional chemical structure into a metabolite graph, a mathematical representation suitable for computational analysis [2]. In this graph, atoms are represented as nodes, and the bonds between them are represented as edges. Hydrogen atoms are typically removed to simplify the graph, focusing on the heavy-atom skeleton. This representation allows the algorithm to reason about the molecule's connectivity and to systematically explore how it can break apart during mass spectrometry.
Generating Fragmentation Graphs through Bond Disconnection
A fragmentation graph is a hierarchical structure that enumerates the possible fragments (connected components) generated from the parent metabolite graph through simulated bond breakage [20] [2]. The construction algorithm is governed by a fragmentation model, often denoted as X-Y-Z, which limits the search space for computational efficiency:
- X: The maximum number of single bonds (bridges) that can be broken.
- Y: The maximum number of paired, or correlated, bond breaks (2-cuts).
- Z: The maximum total number of bond breaks allowed [4].
The algorithm efficiently explores the metabolite graph to find all valid sets of bond breaks within these constraints. For each valid set, the bonds are virtually "cut," and the resulting disconnected subgraphs are identified. Each unique subgraph represents a potential fragment ion. Its theoretical m/z value is calculated based on its elemental composition and the presumed ionization mode (e.g., protonation for [M+H]+). This process generates a comprehensive, but manageable, set of theoretical fragments for the candidate molecule.
Table 1: Key Parameters for Fragmentation Graph Construction in DEREPLICATOR+
| Parameter | Typical Default Value | Algorithmic Function |
|---|---|---|
| Fragmentation Model | 2-1-3 [4] | Defines search space: max 2 bridges, 1 two-cut, 3 total cuts. |
| Precursor Mass Tolerance | ± 0.005 Da [4] | Filters candidate molecules from the database. |
| Fragment Ion Mass Tolerance | ± 0.01 Da [4] | Window for matching theoretical fragment m/z to experimental peaks. |
| Maximum Charge | 2 [4] | Limits the charge state considered for fragment ions. |
The following diagram illustrates the logical workflow of the DEREPLICATOR+ algorithm from chemical input to final annotation.
Probabilistic Scoring and False Discovery Rate (FDR) Estimation
Unlike its predecessor which used a simple shared-peak count, DEREPLICATOR+ employs a probabilistic model to score the match between a theoretical fragmentation graph and an experimental MS/MS spectrum [20]. This model learns from libraries of known spectra to weight the likelihood of observing a fragment based on factors like bond type (e.g., N–C breaks are more common than C–C) and the presence of other fragments [20]. This leads to more accurate and sensitive identifications.
A critical component for reliable large-scale analysis is the estimation of statistical significance. DEREPLICATOR+ constructs decoy fragmentation graphs (e.g., by randomizing aspects of the real graph) to model the null distribution of match scores [2]. By searching spectra against a combined target-decoy database, the algorithm can estimate the False Discovery Rate (FDR) for any given score threshold, allowing researchers to set stringent confidence levels (e.g., 1% or 0% FDR) for their identifications [2].
Table 2: Performance Benchmark: DEREPLICATOR vs. DEREPLICATOR+
| Metric | DEREPLICATOR (0% FDR) | DEREPLICATOR+ (0% FDR) | Improvement Factor |
|---|---|---|---|
| Unique Compounds Identified (Actinomyces dataset) | 66 [2] | 154 [2] | 2.3x |
| Total MS/MS Spectral Matches (MSMs) | 148 [2] | 2,666 [2] | 18x |
| Compound Classes Identified | Primarily Peptides [2] | Peptides, Polyketides, Terpenes, Lipids, Benzenoids [2] | Major Expansion |
| Annotation Example (Radamycin) | Score: 9, p-value: 3×10⁻¹⁷ [4] | Score: 25, p-value: 3×10⁻⁴⁶ [4] | Significant Confidence Gain |
Application Notes & Experimental Protocols
Protocol: Microbial Metabolite Extraction for MS Analysis
The quality of fragmentation graph matching is entirely dependent on the quality of the input MS/MS data, which begins with effective metabolite extraction.
Title: Improved Metabolite Extraction from Mineral-Adhered Extremophilic Archaea [21] Application: Targeted extraction of metabolites, including respiratory quinones, from acidophilic archaea like Metallosphaera sedula grown on mineral substrates (e.g., pyrite).
- Cell Disruption & Detachment: Resuspend cell-mineral pellets. Employ rigorous mechanical lysis (e.g., bead beating) combined with a chelating agent (e.g., EDTA) or mild detergent in a low-pH buffer to disrupt cells and help dissociate organic molecules from the mineral surface [21].
- Liquid-Liquid Extraction: Transfer the lysate to a separatory funnel. Add a water-immiscible organic solvent (e.g., ethyl acetate or dichloromethane) at a defined ratio (e.g., 1:1 v/v). Shake vigorously to partition lipophilic metabolites (like quinones) into the organic phase [21].
- Phase Separation & Concentration: Allow phases to separate completely. Collect the organic (upper or lower, depending on solvent) layer. Evaporate the solvent to dryness under a gentle stream of nitrogen gas.
- Reconstitution: Redissolve the dried metabolite extract in a solvent compatible with subsequent mass spectrometry analysis (e.g., methanol or acetonitrile with 0.1% formic acid). Filter through a 0.22 µm PTFE membrane prior to injection. Note: This protocol overcomes the strong adsorption of organic compounds to iron-rich mineral surfaces, a common challenge in geobiochemistry [21].
Protocol: Executing a DEREPLICATOR+ Analysis on GNPS
The Global Natural Products Social Molecular Networking (GNPS) platform provides open-access, web-based workflow for DEREPLICATOR+ analysis [4].
Title: Step-by-Step DEREPLICATOR+ Workflow on the GNPS Platform [4]
- Data Preparation & Upload: Convert your LC-MS/MS raw data to an open format (
.mzML,.mzXML, or.mgf). Log in to the GNPS website and navigate to the DEREPLICATOR+ workflow. Upload your spectral file(s) [4]. - Parameter Configuration:
- Basic Options: Set
Precursor Ion Mass Tolerance(e.g., 0.01 Da) andFragment Ion Mass Tolerance(e.g., 0.02 Da) according to your instrument's mass accuracy [4]. - Database Selection: Choose the predefined
AllDB(containing ~720,000 compounds) or provide a custom database file [4]. - Advanced Options: Select the
Fragmentation Model(default is2-1-3). Set theMinimum Scorefor reporting matches (default is 12) [4].
- Basic Options: Set
- Job Submission & Monitoring: Submit the job. You will receive an email notification upon completion. Results can be monitored in the "Jobs" section of your GNPS account [4].
- Interpretation of Results: In the results page, use the "View Unique Metabolites" tab to see a list of annotated compounds ranked by score. Inspect individual "Metabolite-Spectrum Matches" (MSMs) to see the detailed alignment between experimental peaks and theoretical fragments from the fragmentation graph. Use the reported score and p-value to assess confidence [4].
The following diagram outlines the key steps in a standard mass spectrometry-based metabolomics workflow that culminates in DEREPLICATOR+ analysis.
The Scientist's Toolkit: Essential Reagents & Materials
Table 3: Research Reagent Solutions for Microbial Metabolomics
| Item | Typical Example | Function in Research |
|---|---|---|
| Mechanical Lysis Beads | Zirconia/Silica beads (0.1 mm) | Effective disruption of tough microbial cell walls (e.g., Gram-positive bacteria, fungal spores) for comprehensive metabolite release. |
| Extraction Solvents | Methanol, Acetonitrile, Ethyl Acetate, Dichloromethane | Solvents of varying polarity used in single-phase (for polar metabolites) or liquid-liquid extraction (for lipophilic metabolites) protocols [21] [22]. |
| Acidification Agent | Formic Acid (0.1%) | Added to extraction and LC-MS solvents to protonate acidic metabolites, improving chromatography and ionization efficiency in positive ESI mode. |
| MS Calibration Standard | Sodium formate cluster or proprietary mix | Provides known m/z points across the mass range to ensure high mass accuracy (< 5 ppm) for both precursor and fragment ions, critical for database matching. |
| Internal Standard for Quant. | Stable-isotope labeled compounds (e.g., ¹³C-SCFAs, d₄-TMAO) | Added prior to extraction to correct for technical variability, enabling absolute or relative quantification of microbial metabolites like short-chain fatty acids [22]. |
| Database Subscription | Dictionary of Natural Products (DNP) | A curated commercial database of natural product structures, often used as a high-quality target database for dereplication studies [2]. |
This protocol details the operational workflow of DEREPLICATOR+, a cornerstone algorithm for the high-throughput dereplication and discovery of microbial metabolites within the broader research thesis on advancing natural product discovery. A primary bottleneck in modern microbial metabolomics is the efficient differentiation of known compounds from novel chemical entities within complex extract samples [2]. This process, known as dereplication, is critical for focusing resource-intensive isolation and characterization efforts on truly novel scaffolds with potential therapeutic value [23].
DEREPLICATOR+ addresses a key limitation of its predecessor, which was confined to peptidic natural products (PNPs) [7]. By introducing a generalized in silico fragmentation graph model that considers O–C and C–C bonds in addition to peptide N-C bonds, DEREPLICATOR+ enables the identification of diverse metabolite classes, including polyketides, terpenes, benzenoids, alkaloids, and flavonoids [13] [4]. This expansion allows researchers to move beyond "the tip of the iceberg" and interrogate the vast "dark matter" of metabolomics data archived in public repositories like the Global Natural Products Social (GNPS) molecular network [2] [23]. This document provides the application notes and step-by-step protocols necessary to implement this algorithm, transforming raw mass spectrometry data into statistically validated chemical annotations.
The DEREPLICATOR+ Workflow: Principles and Performance
The DEREPLICATOR+ algorithm transforms tandem mass spectrometry (MS/MS) data into confident metabolite annotations through a multi-stage computational pipeline [2]. Its core innovation is the generation of a fragmentation graph for each candidate molecular structure from a chemical database. This graph predicts all theoretically possible fragments formed through multi-stage cleavages of various bond types, creating a comprehensive theoretical spectrum [4]. An experimental MS/MS spectrum is then matched against these theoretical spectra, and a score is calculated based on shared peaks. The statistical significance of each match is rigorously evaluated using a target-decoy strategy and p-value calculation to control the false discovery rate (FDR) [2].
Table 1: Benchmarking Performance of DEREPLICATOR+
| Dataset | Number of Spectra | DEREPLICATOR+ Identifications (0% FDR) | Key Comparative Finding |
|---|---|---|---|
| SpectraActiSeq (Actinomyces extracts) | 651,770 | 154 unique compounds [2] | Identified 2.3x more unique compounds than DEREPLICATOR [2]. |
| SpectraGNPS (GNPS infrastructure) | ~248 million | ~5,000+ promising uninvestigated compounds [23] | Identified an order of magnitude more natural products than prior efforts [2]. |
| General Performance | N/A | Annotation of 1.2% of spectra in a bacterial dataset [2] | Enables high-throughput annotation at scale, searching billions of spectra [23]. |
Table 2: Comparison of Dereplication Tools
| Tool | Chemical Scope | Key Mechanism | Primary Use Case |
|---|---|---|---|
| DEREPLICATOR | Peptidic Natural Products (PNPs) only | Fragmentation of amide (N-C) bonds [7]. | Dereplication of non-ribosomal peptides (NRPs) and RiPPs. |
| DEREPLICATOR+ | PNPs, Polyketides, Terpenes, Alkaloids, etc. [4] | Generalized fragmentation graph (O–C, C–C, N-C bonds) [4]. | Comprehensive metabolite dereplication across all major classes. |
| VInSMoC | Broad small molecules | Identifies known molecules and their structural variants [14]. | Discovering novel analogues and modified forms of known compounds. |
Detailed Experimental Protocol
This protocol outlines the steps to perform a dereplication analysis using the DEREPLICATOR+ web interface on the GNPS platform [4].
Step 1: Data Preparation and Submission
- Format Raw Data: Convert your LC-MS/MS raw data files into an open format accepted by GNPS: mzML, mzXML, or MGF [4].
- Access GNPS: Navigate to the GNPS website (http://gnps.ucsd.edu) and log into your account [4].
- Launch DEREPLICATOR+: From the main page, find the "In Silico Tools" box, click "Browse Tools," and select "DEREPLICATOR+" [4] [10].
- Upload Spectra: In the workflow interface, select your processed MS/MS file(s). You may upload files directly or select an existing dataset from your GNPS workspace [4].
- Set Analysis Parameters:
- Basic Options: Set mass tolerances based on your instrument's resolution. For high-resolution instruments (e.g., q-TOF, Orbitrap), the default is ±0.005 Da for precursor ions and ±0.01 Da for fragment ions [4].
- Advanced Options:
- Submit Job: Provide a job title and your email address, then click submit. You will receive an email notification upon completion [4].
Step 2: Results Interpretation and Validation
- Access Results: Follow the link in your notification email or find the job in your GNPS job list [4].
- Review Annotations: Click "View Unique Metabolites" for a summary list of identified compounds, sorted by score. Click "View All MSM" for detailed Metabolite-Spectrum Matches [4].
- Inspect Spectral Matches: For each high-scoring match, examine the annotation view. This displays the experimental spectrum with matched peaks (often in blue) and the annotated molecular structure [10].
- Statistical Validation: Prioritize identifications with a high score and a computed p-value. DEREPLICATOR+ uses decoy databases to estimate statistical significance; a lower p-value indicates a more reliable match [2].
- Orthogonal Validation (Critical): Computational annotation requires cross-verification [10].
- Spectral Comparison: If available, compare your spectrum to a reference standard analyzed under identical LC-MS/MS conditions.
- Source Consistency: Verify the identified metabolite is plausible given the biological source of your sample (e.g., microbial strain).
- Genomic Evidence: If genome data is available, check for the presence of a corresponding biosynthetic gene cluster.
- Tools Integration: Confirm the molecular formula using tools like SIRIUS and check fragmentation consistency with other in silico tools [10].
Workflow and Algorithm Visualization
DEREPLICATOR+ Analysis Workflow
In-Silico Fragmentation Graph Principle
The Scientist's Toolkit: Research Reagent Solutions
Table 3: Essential Resources for DEREPLICATOR+ Analysis
| Tool/Resource | Type | Function in Workflow | Access/Example |
|---|---|---|---|
| High-Resolution LC-MS/MS System | Instrumentation | Generates the high-quality precursor and fragment ion spectra required for accurate matching. | e.g., q-TOF, Orbitrap platforms. |
| GNPS Platform | Web Infrastructure | Hosts the DEREPLICATOR+ workflow, provides computational resources, and serves as a public data repository [13] [4]. | https://gnps.ucsd.edu |
| AllDB / Custom Database | Chemical Database | The reference library of known chemical structures against which experimental spectra are searched [4]. | Default AllDB (~720K compounds) or user-provided. |
| AntiMarin / DNP | Specialized NP Database | Curated databases focused on natural products, increasing relevance for microbial extract analysis [2]. | Commercial / licensed resources. |
| Molecular Networking (GNPS) | Data Analysis Workflow | Clusters related spectra, allowing annotation propagation from a single DEREPLICATOR+ hit to related variants in the dataset [2] [10]. | Integrated within GNPS. |
| Cytoscape with ChemViz2 | Visualization Software | Enables visualization of molecular networks where nodes are annotated with DEREPLICATOR+ identification results [10]. | Open-source software. |
| MZmine / OpenMS | Data Processing Software | Processes raw LC-MS data, performs feature detection, and exports data in the mzML/MGF formats required for DEREPLICATOR+ [10]. | Open-source software. |
| ClassyFire | Annotation Tool | Automates the classification of identified compounds into chemical ontology classes (e.g., benzenoid, lipid) [2]. | Web service or API. |
DEREPLICATOR+ is an advanced in silico database search algorithm designed for the high-throughput identification of microbial metabolites from tandem mass spectrometry (MS/MS) data. It represents a significant evolution from its predecessor, DEREPLICATOR, which was specialized for peptidic natural products (PNPs). DEREPLICATOR+ generalizes the approach by modeling multi-stage fragmentation of O–C and C–C bonds in addition to N–C bonds, thereby extending its annotation capabilities to major classes of natural products, including polyketides, terpenes, benzenoids, alkaloids, and flavonoids [4] [2].
Within the broader thesis of accelerating microbial metabolite discovery, DEREPLICATOR+ addresses a central bottleneck: dereplication. The process of dereplication involves rapidly identifying known compounds within complex biological extracts to avoid redundant rediscovery and to prioritize novel chemical entities for further research [2] [7]. By enabling the search of billions of mass spectra against chemical structure databases, DEREPLICATOR+ transforms massive, untargeted metabolomics datasets from a "dark matter" challenge into a structured resource for discovery [2] [24]. Its integration into the Global Natural Products Social (GNPS) platform provides researchers with a practical, web-based tool to implement this powerful algorithm in their workflow, connecting spectral data directly to chemical structures and biosynthetic gene clusters [4] [13].
The DEREPLICATOR+ Workflow: A Step-by-Step Protocol
Executing a DEREPLICATOR+ analysis on GNPS involves a linear workflow from data preparation to the interpretation of annotated results. The following diagram outlines this core process.
Diagram 1: Core DEREPLICATOR+ Workflow on GNPS (86 characters)
Pre-Analysis: Data and Sample Preparation
The quality of DEREPLICATOR+ results is fundamentally dependent on proper experimental design and data preparation.
- Sample Preparation & LC-MS/MS Acquisition: Protocols from integrated studies provide a robust model. For microbial extracts, culture bacteria in appropriate media (e.g., R2A broth), extract metabolites with solvents like ethyl acetate, and analyze via reversed-phase liquid chromatography coupled to high-resolution mass spectrometry (e.g., Q-TOF or Orbitrap instruments) [12]. Include blank (media-only) controls to identify background compounds.
- Data Format Conversion: Convert raw instrument files (.d, .raw) to open community formats (.mzML, .mzXML, or .mgf) using tools like MSConvert (ProteoWizard). This ensures compatibility with the GNPS platform [4].
- Metadata Documentation: Record sample origins, cultivation conditions, and extraction protocols. This contextual information is crucial for biologically validating annotations—for instance, confirming that a compound identified is plausible for the microbial genus under study [10].
Protocol 1: Executing a DEREPLICATOR+ Job on GNPS
Follow these steps to perform a standard dereplication analysis [4] [10].
- Access the Workflow: Navigate to the GNPS website (http://gnps.ucsd.edu), log in, and find the "In Silico Tools" section. Select the "DEREPLICATOR+" workflow [4].
- Input Spectral Data: Click "Upload Files" to transfer your prepared .mzML/.mzXML/.mgf files, or use "Share Files" to select an existing dataset within GNPS. Click "Finish Selection" [4].
- Configure Critical Parameters: Set job title and email. Adjust key parameters:
- Precursor & Fragment Ion Mass Tolerance: Align with instrument accuracy. For high-resolution data (Q-TOF, Orbitrap), defaults are ±0.005 Da and ±0.01 Da, respectively [4].
- Database Selection: The default "AllDB" contains ~720,000 compounds. For targeted searches, a custom database file can be supplied via URL [4].
- Min Score for Significance: This threshold (default=12) sets the minimum number of shared peaks for a significant match. Increasing it reduces false positives [4].
- Submit and Monitor: Click "Submit". A link to results will be sent by email. Job status can also be tracked in the "Jobs" section of your GNPS account [4].
Protocol 2: Integrated Dereplication for Antibiotic Discovery
This protocol, adapted from a 2025 study, details a multi-optic workflow that embeds DEREPLICATOR+ within a broader discovery pipeline [12].
- In Situ Cultivation: Employ microbial diffusion chambers with semi-permeable membranes to cultivate diverse soil bacteria in a near-native chemical environment, enhancing the recovery of unique isolates [12].
- Bioactivity Screening: Screen bacterial extracts against target pathogens (e.g., Staphylococcus aureus, Escherichia coli) using agar overlay assays to identify strains with antibiotic activity [12].
- LC-MS/MS Analysis: Analyze bioactive extracts via high-resolution LC-MS/MS to generate spectral data for dereplication.
- MS-Based Dereplication: Submit the MS/MS data to DEREPLICATOR+ on GNPS to identify known antibiotics (e.g., actinomycin D, valinomycin) within the extract [12].
- Genomic Validation: Sequence the genome of the bioactive strain. Use genome mining tools (e.g., antiSMASH) to identify biosynthetic gene clusters (BGCs) that corroborate the production of compounds found by DEREPLICATOR+ or to reveal the potential for novel compounds not detected by MS [12].
The Scientist's Toolkit: Research Reagent Solutions
Table 1: Essential Materials and Reagents for DEREPLICATOR+ Analysis
| Item | Function/Description | Example/Reference |
|---|---|---|
| High-Resolution Mass Spectrometer | Generates accurate MS/MS spectra for reliable database matching. | Q-TOF, Orbitrap instruments [2] |
| Chromatography System | Separates complex metabolite mixtures prior to MS analysis. | Reversed-Phase Liquid Chromatography (RPLC) [2] |
| Cultivation Media | Grows microbial strains for metabolite production. | Reasoner's 2A (R2A) Broth/Agar, SMS Agar [12] |
| Extraction Solvents | Isolates metabolites from culture broth or solid media. | Ethyl Acetate, Methanol [12] |
| Data Conversion Software | Converts proprietary instrument files to open formats. | MSConvert (ProteoWizard) [4] |
| GNPS Account | Provides access to the DEREPLICATOR+ workflow and public datasets. | http://gnps.ucsd.edu [4] |
| Structural Databases | Source of known compound structures for in silico fragmentation. | AllDB (~720K compounds), AntiMarin, Dictionary of Natural Products [4] [2] |
| Genome Mining Software | Identifies BGCs in genomic data to validate MS annotations. | antiSMASH [12] [24] |
Data Interpretation and Validation
Interpreting DEREPLICATOR+ Output
The results page provides several key views [4]:
- View Unique Metabolites: A condensed list of annotated compounds, sorted by score. This is the primary starting point.
- View All MSM: A detailed list of all metabolite-spectrum matches, useful for examining all potential hits for a given spectrum.
- Annotation Inspection: Clicking "Show Annotation" displays the experimental spectrum overlaid with theoretical fragments from the matched structure, allowing visual verification of key fragment matches [10].
Validating an annotation is crucial. Confidence increases through [10]:
- Manual Spectrum Inspection: Verify that major fragment ions are logically consistent with the proposed structure.
- Biological Plausibility: Confirm the compound has been reported from the sample's biological source (e.g., using AntiMarin, literature).
- Genomic Corroboration: If available, identify a corresponding BGC in the source organism's genome [12].
- Orthogonal Analysis: Use tools like SIRIUS to verify molecular formula or compare retention time/index with authentic standards if possible.
Quantitative Performance Benchmarks
DEREPLICATOR+ demonstrates markedly improved performance over earlier tools, as validated in large-scale studies.
Table 2: Performance Comparison of Dereplication Tools on Microbial Datasets
| Tool | Class Coverage | Key Performance Metric | Example Result |
|---|---|---|---|
| DEREPLICATOR | Peptidic Natural Products (PNPs) only | Identified 73 unique compounds (at 1% FDR) in Actinomyces spectra [2]. | Limited to peptides and amino acid derivatives. |
| DEREPLICATOR+ | PNPs, Polyketides, Terpenes, Lipids, etc. | Identified 488 unique compounds (at 1% FDR) in the same dataset—a >6.5x increase [2]. | Enabled discovery of chalcomycin variants, 2 polyketides, 2 terpenes missed by DEREPLICATOR [2]. |
| Integrated Workflow (DEREPLICATOR+ & Genomics) | Broad, with genomic validation | In a soil bacterium study, MS dereplication identified known antibiotics in 33% of bioactive strains; genomics revealed additional compounds [12]. | Confirmed production of known compounds (e.g., nonactin) and pointed to undiscovered ones (e.g., streptothricin) [12]. |
Advanced Applications and Integration
DEREPLICATOR+ functions as a core node within a larger ecosystem of natural products research tools. Its integration with other platforms massively expands its utility.
Diagram 2: DEREPLICATOR+ Ecosystem Integration (83 characters)
- Molecular Networking: Annotations from DEREPLICATOR+ can be propagated through molecular networks in GNPS. By annotating one node in a spectral cluster, related spectra (likely structural analogs) inherit the annotation, greatly expanding the chemical space characterized from a single match [2] [10].
- Peptidogenomics & Genome Mining: DEREPLICATOR+ directly cross-validates genomic predictions. For example, the HypoRiPPAtlas uses machine learning (seq2ripp) to predict structures of ribosomally synthesized and post-translationally modified peptides (RiPPs) from genomes. These hypothetical structures are then used as a custom database for DEREPLICATOR+ to search against experimental spectra, bridging genome mining and metabolomics [24].
- Guiding Novel Discovery: When DEREPLICATOR+ finds no match, it signifies potentially novel chemistry. This "unknown" signal can be prioritized for isolation. Conversely, integrated workflows show that even when DEREPLICATOR+ identifies known compounds, genomic analysis of the same strain can reveal additional BGCs for unknown compounds, guiding the search for novelty within known producers [12] [24].
The identification of microbial natural products through mass spectrometry represents a cornerstone of modern drug discovery pipelines. Within this context, the DEREPLICATOR+ algorithm emerges as a pivotal computational advancement, enabling the dereplication of diverse metabolite classes—including polyketides, terpenes, benzenoids, and alkaloids—beyond its predecessor's focus on peptidic natural products (PNPs) [2]. The broader thesis of this work posits that the transformation of natural product discovery into a high-throughput, reliable technology is contingent not only on algorithmic innovation but also on the meticulous optimization of key analytical parameters. This document details the application notes and protocols for configuring three fundamental pillars of the DEREPLICATOR+ workflow: precursor mass tolerance, fragmentation models, and database selection. Proper configuration of these elements is critical for maximizing identification rates, ensuring statistical robustness through controlled false discovery rates (FDR), and enabling the cross-validation of results with genomic data, thereby accelerating the path from microbial extract to novel drug candidate [2] [25].
Technical Specifications and Parameter Definitions
Optimal performance of DEREPLICATOR+ requires informed configuration based on instrument capabilities and experimental goals. The tables below summarize the core and advanced parameters.
Table 1: Core Configuration Parameters for DEREPLICATOR+
| Parameter | Description | Recommended Setting (High-Res MS) | Recommended Setting (Low-Res MS) | Impact on Analysis |
|---|---|---|---|---|
| Precursor Ion Mass Tolerance | Maximum allowed deviation between measured and theoretical precursor m/z [4]. | ± 0.005 Da [4] | ± 0.5 Da [10] | Governs initial candidate selection; overly wide tolerances increase false positives and compute time. |
| Fragment Ion Mass Tolerance | Maximum allowed deviation for fragment ion m/z matches [4]. | ± 0.01 Da [4] | ± 0.5 Da [10] | Directly affects scoring granularity and the number of explained peaks in a spectrum. |
| Fragmentation Model | Defines rules for in silico bond cleavage (e.g., "2-1-3" for max bridges, 2-cuts, total cuts) [4]. | 2-1-3 (Default) [4] | 2-1-3 (Default) | A more complex model (e.g., more allowed cuts) can identify lower-quality spectra but increases computation [2]. |
| Min Score for Significant MSM | Minimum shared peak count to report a Metabolite-Spectrum Match (MSM) [4]. | 12 (Default) [4] | Adjust based on FDR | Primary filter for results; higher values increase precision but may reduce sensitivity for weak spectra. |
Table 2: Advanced Configuration and Database Parameters
| Parameter / Database | Description | Options & Defaults | Strategic Consideration |
|---|---|---|---|
| Maximum Charge | Maximum charge state considered for precursor and fragments [4]. | Default: 2 [4] | Set according to ionization mode and compound class. |
| Adducts | Additional adduct forms considered beyond [M+H]+ [10]. | H+, Na+, K+ [10] | Crucial for capturing correct ionization in different solvents/matrices. |
| Predefined Structure Database | Curated database of chemical structures for in silico fragmentation [4]. | AllDB (Default, ~720K compounds) [4] | Broad coverage for untargeted discovery. |
| Specialized Databases | Smaller, class-specific databases. | AntiMarin (~60K NPs) [2], DNP (~83K NPs) [2], MIBiG (~1.6K BGC products) [2] | Higher precision for targeted studies (e.g., microbial NPs). Use via custom DB option. |
| Custom Database File | User-provided database in required format [4]. | File upload or URL [4] | Essential for proprietary compounds or hypothesis-driven search. Overrides predefined DB. |
Experimental Protocols
Protocol A: DEREPLICATOR+ Workflow Execution on GNPS
This protocol outlines the standard procedure for running a dereplication job on the Global Natural Products Social (GNPS) platform [4].
- Data Preparation: Convert raw LC-MS/MS data to an open format (.mzML, .mzXML, or .MGF). Ensure metadata is accurate.
- Platform Access: Navigate to the GNPS website (http://gnps.ucsd.edu) and log in [4].
- Workflow Selection: From the main page, select "In Silico Tools" and choose the "DEREPLICATOR+" workflow [4] [13].
- File Upload: Click "Upload Files" to transfer your prepared data or "Share Files" to use an existing GNPS dataset. Finalize the selection [4].
- Parameter Configuration:
- Basic Options: Set
Precursor Ion Mass ToleranceandFragment Ion Mass Toleranceper Table 1, based on your mass spectrometer's resolution [4]. - Advanced Options: Select the
Predifined database(typically AllDB) or provide aCustom DB file. Set theFragmentation Model(default is 2-1-3) andMin score(default is 12) [4].
- Basic Options: Set
- Job Submission: Enter a job title and email address, then click "Submit" [4].
- Result Retrieval: Monitor job status via the provided link. Upon completion, download results from the "View Unique Metabolites" or "View All MSM" pages [4].
Protocol B: Benchmarking and FDR Validation for Method Development
This protocol describes how to establish optimal, statistically validated parameters for a specific instrument or sample type, as performed in the foundational DEREPLICATOR+ study [2].
- Reference Dataset Curation: Compile a set of high-confidence MS/MS spectra from authentic standards. Alternatively, use a publicly available annotated spectral library (e.g., from GNPS or MassBank) [2] [20].
- Decoy Database Generation: Utilize the decoy generation method intrinsic to DEREPLICATOR+, which creates unrealistic fragmentation graphs from the target database to model the null distribution of matches [2].
- Parameter Grid Search: Execute DEREPLICATOR+ on the reference dataset while systematically varying a target parameter (e.g., Fragment Ion Mass Tolerance from 0.005 Da to 0.02 Da) while keeping others constant.
- FDR Calculation: For each parameter set, calculate the False Discovery Rate as the ratio of significant matches (MSMs) identified in the decoy database versus the target database at a given score threshold [2] [7].
- Optimal Point Determination: Plot identification yields (number of correct MSMs from the target database) against the calculated FDR for each parameter value. Select the parameter that maximizes identifications while maintaining an acceptable FDR (e.g., 1% or 2%).
- Cross-Validation: Apply the optimized parameter set to a separate validation dataset not used in the grid search to confirm performance.
Protocol C: Integration with Genomic Data for Cross-Validation
This protocol leverages genome mining to biochemically contextualize and validate DEREPLICATOR+ annotations, a strength highlighted in the original research [2].
- Genomic Data Acquisition: Obtain the genome sequence of the microbial strain from which the analyzed extract was derived.
- Biosynthetic Gene Cluster (BGC) Mining: Process the genome using a BGC prediction tool such as antiSMASH to identify clusters encoding for non-ribosomal peptide synthetases (NRPS), polyketide synthases (PKS), etc. [25].
- Metabolite Annotation via DEREPLICATOR+: Run the experimental MS/MS data from the microbial extract through DEREPLICATOR+ using optimized parameters.
- Comparative Analysis: Cross-reference the chemical structures identified by DEREPLICATOR+ with the predicted products (e.g., from NRPS/PKS adenylation and ketosynthase domain substrates) of the located BGCs.
- Hypothesis Generation & Validation: A strong agreement between a predicted BGC product and a DEREPLICATOR+ annotation provides powerful orthogonal validation. Discrepancies may point to novel enzyme function or the presence of silent/clustered BGCs, guiding targeted isolation efforts [2].
Visual Workflows and Logical Diagrams
Diagram 1: DEREPLICATOR+ Analysis Workflow & Parameter Integration
Diagram 2: Logical Relationships of Key Configuration Parameters
Table 3: Research Toolkit for DEREPLICATOR+-Based Metabolite Identification
| Tool / Resource | Type | Primary Function in Workflow | Key Consideration |
|---|---|---|---|
| High-Resolution Mass Spectrometer (e.g., Q-TOF, Orbitrap) | Instrumentation | Generates high-accuracy MS/MS spectra for analysis. | Enables use of narrow mass tolerances (e.g., ±0.005 Da), critical for specificity [4]. |
| AllDB (~720,000 compounds) | Structure Database | Default, broad-coverage database for dereplication on GNPS [4]. | Good starting point for untargeted discovery; may increase compute time vs. targeted DBs. |
| AntiMarin (~60,000 compounds) | Specialized Database | Curated database of microbial natural products [2]. | Increases hit relevance and precision for microbial extract analysis. Can be used as a custom DB. |
| Dictionary of Natural Products (~83,000 unique compounds) | Specialized Database | Comprehensive resource for natural products [2]. | Useful for cross-referencing and validating annotations from environmental or plant samples. |
| MIBiG (Minimum Information about a BGC) | Genomic/Database | Repository for curated Biosynthetic Gene Clusters and their metabolites [2] [25]. | Essential for Protocol C (genomic cross-validation). Links compound annotations to genetic potential. |
| antiSMASH | Bioinformatics Tool | Predicts BGCs from genomic sequences [25]. | Used in Protocol C to generate hypotheses for compounds potentially produced by the source organism. |
| GNPS Molecular Networking | Computational Platform | Clusters MS/MS spectra by similarity to visualize chemical space and propagate annotations [2] [13]. | Integrated with DEREPLICATOR+ results to discover structural variants and contextualize annotations. |
| MS-DPR | Statistical Algorithm | Calculates accurate p-values for metabolite-spectrum matches (MSMs) [2] [7]. | Underpins the FDR estimation in DEREPLICATOR+, crucial for assessing statistical significance. |
The strategic configuration of precursor mass tolerance, fragmentation models, and databases is not a mere preprocessing step but a fundamental determinant of success in high-throughput microbial metabolite identification using DEREPLICATOR+. As evidenced by its performance—identifying five times more molecules than previous approaches in large-scale GNPS analyses—the algorithm's power is fully realized only when its parameters are tuned to the analytical question and instrument data at hand [2]. The integration of these optimized dereplication results with genomic mining, as outlined in the protocols, creates a powerful, closed-loop discovery framework that significantly de-risks natural product research.
Future advancements in this field, situated within the broader thesis of AI-driven drug discovery, will likely involve the dynamic optimization of these parameters via machine learning models that predict optimal settings based on raw data features [20] [25]. Furthermore, the development of larger, more accurately annotated structural databases and more sophisticated probabilistic fragmentation models will continue to push the boundaries of identification sensitivity and specificity. By adhering to the detailed application notes and protocols herein, researchers can rigorously implement DEREPLICATOR+ to efficiently navigate the complex metabolome of microbial systems, accelerating the discovery of novel therapeutic agents.
The identification of microbial natural products represents a critical pathway for drug discovery, yet researchers are consistently hampered by the re-isolation of known compounds—a process known as dereplication. The DEREPLICATOR+ algorithm emerges as a foundational solution within this thesis, transforming high-throughput mass spectrometry data into actionable biological insights [2]. By moving beyond the peptide-centric limitations of its predecessor, DEREPLICATOR+ enables the in silico identification of a vast array of metabolite classes—including polyketides, terpenes, benzenoids, and alkaloids—through database searches of tandem mass (MS/MS) spectra [2] [4]. This protocol details the methodology for interpreting its two primary outputs: Metabolite-Spectrum Matches (MSMs) and the resulting Unique Compound Lists. Mastery of this analytical workflow is essential for validating discoveries, assessing statistical confidence, and prioritizing novel microbial metabolites for downstream isolation and characterization in drug development pipelines.
Core Algorithm and Theoretical Foundation
The power of DEREPLICATOR+ stems from its generalized fragmentation model. While the original DEREPLICATOR algorithm was restricted to cleaving amide (N–C) bonds in peptides, DEREPLICATOR+ expands this to include O–C and C–C bonds, allowing for multi-stage fragmentation [4]. This enables the algorithm to construct accurate theoretical spectra for a far broader range of molecular scaffolds.
The core process involves: (i) converting a compound's chemical structure into a metabolite graph, (ii) generating a fragmentation graph by simulating bond cleavages according to the expanded model, and (iii) annotating this graph with peaks from an experimental MS/MS spectrum [2]. The match is scored based on shared peaks, and a p-value is computed using the MS-DPR algorithm to evaluate statistical significance against decoy fragmentation graphs [2]. This rigorous statistical framework allows researchers to set false discovery rate (FDR) thresholds with confidence.
Quantitative Performance Benchmarking
DEREPLICATOR+ demonstrates a substantial increase in annotation power compared to previous tools. Benchmarking against real-world microbial datasets reveals its superior performance.
Table 1: Benchmarking Performance on Actinomyces Spectral Data (SpectraActiSeq) [2]
| Performance Metric | DEREPLICATOR | DEREPLICATOR+ | Improvement Factor |
|---|---|---|---|
| Unique Compounds (1% FDR) | 73 | 488 | ~6.7x |
| Total MSMs (1% FDR) | 166 | 8,194 | ~49x |
| Avg. Spectra per Compound | 2.2 | 16.7 | ~7.6x |
| Compound Classes Identified | Peptides only | Peptides, Polyketides, Terpenes, Benzenoids, Lipids | Major Expansion |
Table 2: Analysis of High-Confidence Identifications (Score ≥15, 0% FDR) [2]
| Metabolite Class | Number of Compounds | Key Example | Note |
|---|---|---|---|
| Peptidic Natural Products (PNPs) | 19 | Chalcomycin variants | Includes non-ribosomal peptides (NRPs) & RiPPs. |
| Polyketides (PKs) | 2 | Not specified | Missed by original DEREPLICATOR. |
| Terpenes | 2 | Not specified | Missed by original DEREPLICATOR. |
| Benzenoids | 1 | Not specified | Missed by original DEREPLICATOR. |
| Total Unique Metabolites | 24 | Formed 15 structural families. |
Experimental Protocol: From Data Submission to Interpreted Results
This protocol outlines the standard operating procedure for running a DEREPLICATOR+ analysis via the GNPS platform and interpreting the results.
Part A: Job Setup and Submission on GNPS [4]
- Access: Navigate to the GNPS website (http://gnps.ucsd.edu), log in, and locate the DEREPLICATOR+ workflow from the 'in silico tools' menu.
- Input Preparation: Upload MS/MS data in standard formats (
.mzML,.mzXML, or.MGF). You may select files from an existing GNPS dataset or upload new data. - Parameter Configuration:
- Basic Options: Set mass tolerances. Defaults are ±0.005 Da for precursor ions and ±0.01 Da for fragment ions (suitable for high-resolution MS).
- Advanced Options: Select the database (
AllDB, containing ~720,000 compounds, is default). A custom database can be supplied. TheFragmentation Model(default: 2-1-3) and theMin scorefor significant MSMs (default: 12) are key for balancing sensitivity and specificity.
- Submission: Provide a job title and email, then submit. Processing time varies with dataset size.
Part B: Critical Interpretation of DEREPLICATOR+ Outputs
- Access Results: Use the link provided via email or the GNPS job list.
- Prioritize the "View Unique Metabolites" List: This is the primary list for discovery, summarizing each annotated compound across all spectra.
- Analyze the "View All MSM" Table: This detailed view lists every individual spectrum match. Use it to:
- Assess Spectral Quality: Examine the
Scoreand#Peaksmatched. High scores with many matched peaks indicate a confident match. - Verify Consistency: Check if the same compound is identified in multiple, related spectra (e.g., adjacent LC-MS peaks), strengthening the annotation.
- Review Adducts/Modifications: Note if the compound is identified as a different adduct (e.g., [M+Na]+) in other spectra.
- Assess Spectral Quality: Examine the
- Apply FDR Filtering: The
p-value(orScore) is the primary filter. For stringent identification (e.g., for follow-up isolation), use a high score threshold (e.g., ≥15) or 0% FDR. For exploratory analysis, a 1% FDR threshold reveals more candidates [2]. - Integrate Molecular Networking: The most powerful insights come from combining DEREPLICATOR+ annotations with GNPS molecular networks. Annotated nodes propagate their identities to unannotated neighbors in the network, revealing structural variants of the dereplicated core structure [2].
The Scientist's Toolkit: Essential Research Reagents & Materials
Table 3: Key Reagents and Computational Tools for DEREPLICATOR+ Assisted Metabolite Identification
| Item / Resource | Function / Purpose | Specifications / Notes |
|---|---|---|
| LC-MS Grade Solvents | Extraction and chromatography of microbial metabolites. | Acetonitrile, methanol, water; essential for reproducible MS signal. |
| Standard Microbial Media | Culturing producing strains for metabolite extraction. | e.g., ISP-2, R2A; influences secondary metabolite profile. |
| Chemical Standards | Validation of DEREPLICATOR+ identifications. | Commercially available natural products for RT and MS/MS confirmation. |
| GNPS Platform | Web-based ecosystem for analysis. | Hosts DEREPLICATOR+, molecular networking, and spectral libraries [4] [13]. |
| AntiMarin / DNP Databases | Target databases for dereplication. | Curated databases of microbial and natural product structures [2]. |
| mzML/mzXML Conversion Software | Standardizes raw MS data for upload. | e.g., MSConvert (ProteoWizard); ensures file compatibility. |
| Cytoscape with GNPS Plugin | Visualization of molecular networks. | Graphs relationships between annotated and unknown spectra [2]. |
Visualizing the Workflow and Metabolite Identification Logic
Diagram: DEREPLICATOR+ Analysis and Validation Workflow
Advanced Analysis: From MSMs to Biological Insight
The final step involves transforming lists of annotated compounds into biological knowledge. This requires cross-referencing the Unique Compound List with genomic data (e.g., from the same microbial strain) to link metabolites to biosynthetic gene clusters (BGCs) in a peptidogenomics or genome-mining approach [2] [13]. Furthermore, the molecular families revealed through networking of DEREPLICATOR+ MSMs provide immediate insight into biosynthetic pathways and potential novel analogs. For drug discovery professionals, this analysis enables the rapid triaging of extracts: those containing predominantly known compounds can be deprioritized, while extracts with unique, high-scoring annotations for rare or pharmaceutically relevant scaffold classes can be fast-tracked for isolation and biological testing.
Optimizing DEREPLICATOR+ Performance: Strategies for Data Quality, Parameter Tuning, and Complex Mixtures
Within the broader thesis on advancing microbial metabolite identification, the DEREPLICATOR+ algorithm represents a significant leap forward. It extends dereplication capabilities beyond peptidic natural products to encompass polyketides, terpenes, benzenoids, and flavonoids [17]. However, the algorithm's performance is fundamentally constrained by the quality of its input data. High-confidence annotations require high-fidelity MS/MS spectra, as the algorithm matches experimental fragmentation patterns against theoretical fragmentation graphs derived from chemical structures [17]. Consequently, rigorous data preprocessing is not merely a preliminary step but the foundational practice that determines the success of downstream analysis, enabling the reliable discovery of novel microbial metabolites.
This document outlines application notes and detailed protocols for MS/MS data preprocessing, framed explicitly within the DEREPLICATOR+ workflow. It synthesizes current best practices for sample handling, instrumental analysis, and computational processing to ensure that spectral data meets the stringent requirements for effective dereplication.
Quantitative Performance Benchmarks for DEREPLICATOR+
The following table summarizes key performance metrics of DEREPLICATOR+, underscoring the necessity of inputting high-quality spectra to achieve these benchmarks.
Table 1: Performance Metrics of DEREPLICATOR+ in Microbial Metabolite Dereplication
| Metric | Performance (DEREPLICATOR+) | Performance (Original DEREPLICATOR) | Implication for Preprocessing |
|---|---|---|---|
| Unique Compounds Identified | 488 compounds at 1% FDR in Actinomyces spectra [17] | 73 compounds at 1% FDR [17] | Preprocessing must maximize the number of interpretable spectra to feed the enhanced algorithm. |
| Spectral Matches per Compound | Average of 16.7 spectra per compound [17] | Average of 2.2 spectra per compound [17] | High intra-sample spectral consistency (achieved via robust peak picking and alignment) is crucial. |
| Annotation Coverage | Identified 5x more molecules than previous approaches in GNPS data [17] | Limited to peptidic natural products [17] | Preprocessing must be optimized for diverse metabolite classes with different fragmentation patterns. |
| Key Algorithmic Advance | Considers O–C and C–C bonds, allows multi-stage fragmentation [4] | Focused on N-C amide bond cleavage in peptides [17] | Data must have sufficient fragment ion resolution and mass accuracy to leverage the expanded fragmentation model. |
Detailed Preprocessing Protocols for DEREPLICATOR+ Workflows
Protocol 1: Sample Preparation & LC-MS/MS Acquisition for Microbial Extracts
This protocol is designed to generate high-quality raw data from microbial cultures, minimizing artifacts that complicate downstream DEREPLICATOR+ analysis.
- Objective: To reproducibly extract microbial metabolites and generate MS/MS spectra with high signal-to-noise ratio and accurate mass measurements.
- Materials: See Section 6, "The Scientist's Toolkit."
- Procedure:
- Metabolism Quenching & Extraction: Immediately quench metabolism by mixing culture with cold methanol or by rapid filtration and flash-freezing in liquid N₂ [26]. For intracellular metabolites, use a validated extraction solvent (e.g., methanol:water:chloroform). Keep samples on ice or at -80°C throughout to prevent degradation [27].
- Sample Preparation for LC-MS: Centrifuge extracts, collect supernatant, and dry under nitrogen or vacuum. Reconstitute in injection solvent compatible with the LC mobile phase initial conditions. Use internal standards to monitor extraction efficiency and instrument response [27].
- LC-MS/MS Data-Dependent Acquisition (DDA):
- Column: Use a reversed-phase C18 column (e.g., 2.1 x 100 mm, 1.8 µm) [28].
- Gradient: Employ a water/acetonitrile (+0.1% formic acid) gradient over 15-20 minutes [28].
- MS Settings:
- Mass Analyzer: High-resolution instrument (Q-TOF, Orbitrap).
- Scan Range: m/z 100-1200.
- MS1 Resolution: >30,000 FWHM.
- MS/MS Acquisition: Data-dependent top-N (N=3-5) fragmentation.
- Collision Energies: Apply a stepped or ramp collision energy (e.g., 10, 25, 40 eV for negative mode) [28] to capture diverse fragment ions.
- Dynamic Exclusion: Enable to increase spectral diversity.
Protocol 2: Computational Processing of Raw MS/MS Data
This protocol converts raw instrument files into a curated list of MS/MS spectra ready for DEREPLICATOR+ submission.
- Objective: To convert raw LC-MS/MS data into a clean, aligned feature table with associated high-quality MS/MS spectra.
- Software: Asari [29], MZmine, or similar tools with explicit provenance tracking.
- Procedure:
- File Conversion and Centroiding: Convert vendor raw files to open formats (mzML, mzXML) using tools like MSConvert [28]. Apply centroiding to profile data at this stage.
- Feature Detection and Alignment:
- Import files into the processing software.
- Perform mass peak detection with a tolerance matching instrument accuracy (e.g., 5 ppm) [29].
- Construct chromatograms and detect elution peaks. Set intensity thresholds based on solvent blank injections to filter noise.
- Align features across samples using both m/z and retention time (RT). Employ RT correction algorithms (e.g., based on quality control samples). Tools like Asari implement a "mass track" concept that performs mass alignment before peak detection, improving reproducibility [29].
- MS/MS Spectrum Assembly: For each aligned feature, aggregate its associated MS/MS scans from across the sample set. Merge these scans to create a single, representative consensus MS/MS spectrum. Apply a minimum number of scans (e.g., 3) and intensity threshold to ensure spectral quality.
- Export for Dereplication: Export the final list of consensus spectra in MGF (Mascot Generic Format) or mzML format. The metadata must include for each spectrum: Precursor m/z, RT (optional), charge state, and the merged fragmentation spectrum.
Protocol 3: Quality Control (QC) and Validation
Integrated QC is non-negotiable for generating reliable data.
- Objective: To monitor and validate the entire analytical and computational pipeline.
- Procedure:
- System Suitability QC: Inject a standard mixture of known metabolites at the beginning and end of each batch to verify chromatographic performance and mass accuracy [26].
- Process QC: Analyze pooled samples (a blend of all experimental samples) repeatedly throughout the acquisition sequence to monitor instrument stability [26].
- Blank Subtraction: Acquire and process solvent blank injections. Automatically subtract any features appearing in blanks from the experimental feature table to remove background and contamination signals.
- Reproducibility Check: Calculate the coefficient of variation (CV%) for features detected in technical replicate QC injections. Flag or filter features with high CV (e.g., >30%) as unstable.
Visualization of the Preprocessing and Dereplication Workflow
The following diagram illustrates the complete integrated workflow from sample to annotation, highlighting the critical preprocessing steps that feed into DEREPLICATOR+.
Diagram 1: Integrated Workflow: From Sample to DEREPLICATOR+ Annotation
Diagram Context: This workflow integrates the experimental, computational, and analytical phases. The Computational Preprocessing Phase (red nodes) is the critical bridge that transforms raw instrumental data into the curated, high-quality MS/MS spectra that are a prerequisite for successful DEREPLICATOR+ analysis. Quality control (green ovals) is embedded at multiple stages to ensure data integrity [30] [26] [29].
Essential Parameters for DEREPLICATOR+ Analysis
After preprocessing, spectra are submitted to the DEREPLICATOR+ workflow on GNPS. Setting appropriate parameters is crucial for accurate results [4].
Table 2: Key DEREPLICATOR+ Input Parameters and Preprocessing Implications
| Parameter | Recommended Setting | Rationale & Link to Preprocessing |
|---|---|---|
| Precursor Ion Mass Tolerance | ± 0.005 Da (or ppm equivalent) | Should reflect the actual mass accuracy of the processed, aligned features, not just the instrument specification. Tight tolerances reduce false matches. |
| Fragment Ion Mass Tolerance | ± 0.01 Da (or ppm equivalent) | Should be informed by the resolution of the merged MS/MS spectra. Wider than precursor tolerance to account for lower intensity fragment ions. |
| Fragmentation Model | 2-1-3 (Default) | This model (max two bridges, one 2-cut, three cuts total) generalizes DEREPLICATOR. High-quality spectra with clear fragment ions are needed to satisfy this model. |
| Minimum Score | 12 (Default) | The threshold for significant matches. Preprocessing that yields clean spectra with high signal-to-noise directly contributes to higher scores. |
| Database | AllDB (720K compounds) or Custom | Use a custom database if studying specific microbial lineages. Preprocessing must retain low-abundance signals that could correspond to rare metabolites. |
The Scientist's Toolkit
Table 3: Essential Research Reagent Solutions and Materials
| Category | Item | Function in Preprocessing Context |
|---|---|---|
| Sample Preparation | Cold Methanol, Acetonitrile, Chloroform | Quenching and extraction solvents for comprehensive metabolite recovery [26]. |
| Chromatography | LC-MS Grade Water & Organic Solvents (with 0.1% Formic Acid) | Mobile phase components; high purity minimizes background noise and ion suppression [28]. |
| Internal Standards | Stable Isotope-Labeled Metabolite Mixes | Monitors extraction efficiency, instrument response, and aids in retention time alignment during data processing [27]. |
| Quality Control | Pooled Quality Control (QC) Sample | A homogeneous sample injected throughout the run to assess system stability and for computational RT alignment and normalization [26] [29]. |
| Software | Asari [29], MSConvert [28], MZmine | Open-source tools for reproducible feature detection, alignment, and spectrum export. |
| Databases/Platforms | GNPS [17] [4], MetaboLights [28] | Public repositories for spectral library matching (GNPS) and for depositing raw/processed data to meet journal and community standards [31]. |
Within the broader thesis on advancing microbial metabolite identification, the DEREPLICATOR+ algorithm represents a pivotal evolution from its predecessor. The original DEREPLICATOR was designed for the dereplication of peptidic natural products (PNPs) by in silico fragmentation of amide (N–C) bonds [17] [7]. DEREPLICATOR+ generalizes this approach by incorporating fragmentation of O–C and C–C bonds and allowing for multi-stage fragmentation, thereby extending its applicability to diverse metabolite classes such as polyketides, terpenes, and lipids [17] [4]. This expansion is critical for comprehensive microbial metabolomics, where these non-peptidic compounds constitute a vast reservoir of bioactive molecules.
The core challenge addressed here is that the optimal parameters for mass spectrometry database search are not universal; they are intrinsically linked to the chemical fragmentation behavior of each metabolite class. Peptides fragment predictably along the backbone, lipids yield diagnostic head-group and acyl chain ions, and polyketides undergo complex cleavages influenced by their polyol chains and macrocyclic structures [32] [33]. Therefore, tuning parameters such as mass tolerance, fragmentation model, and scoring thresholds for each class is essential to maximize annotation sensitivity and confidence. This protocol provides detailed, class-specific guidelines for parameter optimization within the DEREPLICATOR+ framework on the GNPS platform, enabling researchers to tailor their dereplication strategy and significantly enhance the yield of valid identifications from complex microbial extracts [10] [4].
Parameter Tuning Strategies by Metabolite Class
Optimal dereplication requires adjusting search parameters to align with the structural and fragmentation characteristics of the target metabolite class. The following sections provide specific tuning strategies for peptides, lipids, and polyketides.
2.1 Peptidic Natural Products (PNPs) PNPs, including non-ribosomal peptides (NRPs) and ribosomally synthesized and post-translationally modified peptides (RiPPs), fragment primarily at amide bonds. DEREPLICATOR+ improves upon the original algorithm's PNP identification by using a more detailed fragmentation model [17].
- Key Parameters: Use the
2-1-3fragmentation model (max 2 bridges, 1 two-cut, 3 total cuts) as it effectively captures linear and cyclic peptide fragmentation [4]. A Fragment Ion Mass Tolerance of ±0.01 Da is typically sufficient for high-resolution instruments [4]. For Precursor Mass Tolerance, ±0.005 Da is recommended to account for accurate mass drift [4]. - Advanced Tuning: Enable the search for sodium (
[M+Na]+) and potassium ([M+K]+) adducts, which are common for peptides [10]. For datasets where novel variants are expected, using the related VarQuest algorithm (which searches for analogs) is highly recommended, though it increases computational time [10].
2.2 Lipids and Lipid-Like Molecules Lipids fragment to produce diagnostic ions for head groups (e.g., phosphocholine at m/z 184.07) and neutral losses of fatty acyl chains. Their identification benefits from complementary tools and specific precursor mass considerations.
- Key Parameters: The standard
2-1-3model can be applied, but confidence is greatly enhanced by orthogonal validation. Tools like MS2Lipid, a machine learning model trained on curated lipid spectra, can provide independent subclass prediction [34]. In mass defect filtering (MDF) plots, lipids cluster in specific regions based on their saturation degree [33]. - Advanced Tuning: Pay close attention to adduct formation. Lipids are often detected as
[M+H]+,[M+Na]+, or[M+NH4]+in positive mode and[M-H]-or[M+CH3COO]-in negative mode. The default DEREPLICATOR+ settings may need expansion. Note that some lipid annotations, particularly for free fatty acids (FA), may rely more on retention time and accurate mass than MS/MS spectra [34].
2.3 Polyketides Polyketides, especially modular type I polyketides (T1PKs), exhibit complex fragmentation patterns involving C–C and C–O cleavages along the polyol chain and within macrocyclic rings [32] [33]. They are often best observed in negative ionization mode [33].
- Key Parameters: The Fragmentation Model is crucial. The
2-1-3model in DEREPLICATOR+ is a starting point, but the algorithm's ability to handle C–C bonds is key for these molecules [4]. A Precursor Ion Mass Tolerance window of ±0.02 Da may be necessary to capture potential biosynthetic variants [10]. - Advanced Tuning: Integrate genome mining predictions. Tools like Seq2PKS predict putative polyketide structures from biosynthetic gene clusters (BGCs), generating candidate masses for targeted searching [32]. Mass Defect Filtering (MDF) is highly effective for polyketides, as their mass defect distribution is distinct from other classes (e.g., higher than aromatic type II polyketides) [33]. This can be used as a pre-filtering step before DEREPLICATOR+ analysis.
Table 1: Recommended DEREPLICATOR+ Parameters by Metabolite Class
| Parameter | Peptides (PNPs) | Lipids | Polyketides | Rationale |
|---|---|---|---|---|
| Fragmentation Model | 2-1-3 [4] |
2-1-3 |
2-1-3 (base) |
Model captures amide (N-C) and C-C/O-C breaks [4]. |
| Precursor Mass Tolerance | ±0.005 Da [4] | ±0.01 Da | ±0.02 Da [10] | Polyketides may have greater mass deviation due to variants. |
| Fragment Mass Tolerance | ±0.01 Da [4] | ±0.01 Da | ±0.01 Da | Standard for high-res MS2 spectra. |
| Critical Complementary Tools | DEREPLICATOR VarQuest [10] | MS2Lipid [34] | Seq2PKS [32], NegMDF [33] | Provides analog search, subclass prediction, or candidate masses. |
| Optimal Ionization Mode | Positive (+) | Positive or Negative [34] | Negative (-) [33] | Affects adduct formation and detectable fragment ions. |
| Key Diagnostic Cues | Amide bond breaks, water/ammonia losses | Headgroup ions, neutral losses of fatty acids | C-O cleavages, α-cleavages near carbonyls [33] | Class-specific fragmentation pathways. |
Experimental Protocols for Class-Specific Analysis
3.1 Protocol 1: Sample Preparation & LC-MS/MS Data Acquisition for Microbial Extracts This foundational protocol ensures high-quality data suitable for class-targeted dereplication.
- Extraction: Prepare microbial extracts (e.g., from actinobacteria or fungi) using a solvent system like ethyl acetate:methanol (1:1, v/v) for secondary metabolites. For lipidomics, use methyl tert-butyl ether (MTBE)/methanol protocols [34].
- Instrument Setup:
- Chromatography: Use a reversed-phase C18 column (e.g., 2.1 x 100 mm, 1.8 µm). Employ a water-acetonitrile gradient with 0.1% formic acid for positive mode or 5mM ammonium acetate for negative mode.
- Mass Spectrometry: Operate a high-resolution Q-TOF or Orbitrap instrument. Set data-dependent acquisition (DDA) to fragment the top 10-15 ions per cycle.
- Class-Specific Settings:
- Data Conversion: Convert raw files to open formats (.mzML, .mzXML, or .mgf) using tools like MSConvert (ProteoWizard).
3.2 Protocol 2: DEREPLICATOR+ Workflow Execution on GNPS This protocol details the steps for running an analysis on the GNPS platform [10] [4].
- Access & Input: Log in to the GNPS website . Navigate to the DEREPLICATOR+ workflow page. Upload your converted spectral files (.mzML, .mgf).
- Parameter Configuration (Class-Tuned):
- Set the job title and email.
- Apply the Basic and Advanced parameters as guided in Table 1.
- In Advanced Options, select the predefined
AllDBdatabase (contains ~720k compounds) or upload a custom database [4]. - Set the Min score to consider an MSM as significant. Start with the default (e.g., 12) and adjust based on class and data quality [4].
- Job Submission & Monitoring: Click "Submit". Monitor job status via the provided link or your job list. Processing time varies from minutes to hours.
- Result Interpretation:
- Click "View Unique Metabolites" for a summary list, sorted by score.
- Click "Show Annotation" on any result to visualize the spectral match between experimental peaks (blue) and the in silico fragmentation tree.
- Validate annotations by inspecting fragment coherence, checking for expected adducts in MS1, and cross-referencing biological source plausibility [10].
3.3 Protocol 3: Validation and Orthogonal Confirmation Dereplication annotations require rigorous validation [10].
- Spectral Validation: Manually inspect the annotated spectrum. Confirm that major fragment ions are logically explained by the proposed structure (e.g., amide breaks for peptides, head-group ions for lipids).
- Orthogonal Computational Analysis:
- For putative lipids, submit the MS/MS data to the MS2Lipid tool for independent subclass prediction [34].
- For putative polyketides, use the accurate mass to perform Mass Defect Filtering (MDF). Check if the mass defect fits the T1PK region. If a genome sequence is available, run Seq2PKS on associated BGCs to see if the mass is among the predicted products [32] [33].
- Experimental Validation (Gold Standard): Whenever possible, compare retention time and MS/MS spectrum with an authentic analytical standard run under identical LC-MS conditions.
Workflow and Fragmentation Visualizations
DEREPLICATOR+ Class-Optimized Workflow for Metabolite ID
Class-Specific Fragmentation Pathways for Metabolite ID
The Scientist's Toolkit: Essential Reagents & Materials
Table 2: Key Research Reagent Solutions for Metabolite Dereplication
| Item Name | Function/Application | Specification Notes |
|---|---|---|
| Solvent Systems for Extraction | Metabolite extraction from microbial biomass. | Ethyl Acetate:MeOH (1:1): Broad-spectrum for secondary metabolites [33]. MTBE:MeOH: Preferred for comprehensive lipidomics [34]. |
| LC-MS Grade Solvents | Mobile phase for liquid chromatography. | Water, Acetonitrile, Methanol. Use with additives: 0.1% Formic Acid (positive mode) or 5mM Ammonium Acetate (negative mode). |
| Authentic Chemical Standards | Validation gold standard for dereplication matches. | Used for co-injection to confirm retention time and MS/MS spectrum identity [10]. |
| APEX2 Biotinylation System | Proximity labeling for proteomic validation of cellular localization (e.g., lipid droplet proteins). | Used in orthogonal experiments; includes APEX2 enzyme, biotin-phenol, and hydrogen peroxide [35]. |
| Reference Spectral Libraries | Orthogonal validation of DEREPLICATOR+ annotations. | GNPS Public Libraries, NIST, MassBank, HMDB. Provide reference spectra for comparison [10] [17]. |
| In Silico Prediction Tools | Generate candidate structures or subclass predictions. | Seq2PKS (Polyketide structure from BGCs) [32]. MS2Lipid (Lipid subclass from MS2) [34]. AntiSMASH (BGC identification) [33]. |
| Database Files | Target and decoy databases for search algorithms. | AntiMarin, Dictionary of Natural Products, AllDB (~720k compounds). Custom databases can be uploaded to GNPS [17] [4]. |
The discovery of novel microbial metabolites for drug development is fundamentally a large-scale hypothesis-testing problem. Modern mass spectrometry techniques, such as those integrated into platforms like the Global Natural Products Social Molecular Network (GNPS), can generate hundreds of millions of spectra [2]. Each query against a compound database represents a statistical test, creating a massive multiple comparisons challenge where the risk of false positives is immense [36]. The False Discovery Rate (FDR) has emerged as the critical statistical framework for managing this risk, providing a balance between discovering novel bioactive compounds and controlling the cost of false leads [37]. Within this context, the DEREPLICATOR+ algorithm represents a seminal application of FDR control, enabling the high-throughput, accurate identification of microbial metabolites—including polyketides, terpenes, and peptidic natural products—from complex spectral datasets [2]. This article details the principles of FDR, its control procedures, and their concrete implementation and challenges within the workflow of DEREPLICATOR+.
Understanding the False Discovery Rate (FDR)
Core Definition and Rationale
In statistical hypothesis testing, the FDR is defined as the expected proportion of false discoveries among all declared discoveries. Formally, if V is the number of false positives and R is the total number of rejected null hypotheses (discoveries), then FDR = E[V/R] (with the convention that V/R = 0 when R=0) [36]. This contrasts sharply with the Family-Wise Error Rate (FWER), which controls the probability of making one or more false discoveries. In high-dimensional biological research, where thousands to millions of tests are performed (e.g., genomics, metabolomics), FWER methods like the Bonferroni correction are often excessively conservative, leading to many missed true findings [38]. FDR control offers a more adaptive and scalable alternative, allowing researchers to explicitly manage the tolerable proportion of false leads in their output [36] [39].
The practical importance of the FDR is highlighted when considering the prior probability of a true discovery. For example, a test with 90% sensitivity and specificity yields a misleading 92% FDR when screening for a disease with a 1% incidence rate, underscoring that the interpretation of positive results depends critically on context and base rates [37].
The Multiple Testing Framework
The outcomes of testing m hypotheses can be summarized as follows [36]:
Table 1: Outcomes in Multiple Hypothesis Testing
| Null Hypothesis is TRUE (H₀) | Alternative is TRUE (Hₐ) | Total | |
|---|---|---|---|
| Test is DECLARED Significant | V (False Positives) | S (True Positives) | R |
| Test is DECLARED Non-Significant | U (True Negatives) | T (False Negatives) | m - R |
| Total | m₀ | m - m₀ | m |
In metabolite identification, each Metabolite-Spectrum Match (MSM) is a hypothesis test. The goal is to maximize true positives (S) while controlling the number of false positives (V), making the FDR (V/R) the metric of choice [2].
Key Procedures for Controlling the FDR
The Benjamini-Hochberg (BH) Procedure
The step-up BH procedure is the most widely used method for FDR control [36]. It operates as follows:
- For m tests, order the p-values: p_(₁) ≤ p_(₂) ≤ … ≤ p_(m).
- Find the largest rank k such that p_(k) ≤ (k/m) × α, where α is the desired FDR level.
- Reject (declare discoveries for) all null hypotheses for ranks i = 1, …, k.
This procedure controls the FDR at level α when the tests are independent or positively dependent [36]. It is more powerful than FWER-controlling methods, as evidenced by its ability to identify more compounds at a given threshold in dereplication studies [2].
Adaptive and Dependent Modifications
- Benjamini-Yekutieli (BY) Procedure: A more conservative modification that controls FDR under any dependence structure by dividing the threshold by the harmonic number c(m) = Σᵢ₌₁ᵐ 1/i [36].
- Storey-Tibshirani (q-value) Procedure: An adaptive method that estimates the proportion of true null hypotheses (π₀) from the distribution of p-values, often leading to increased power [36] [38]. The q-value for an individual test is the minimum FDR at which that test would be declared significant [39].
Table 2: Comparison of Key Multiple Testing Correction Methods
| Method | Error Rate Controlled | Key Principle | Advantages | Disadvantages |
|---|---|---|---|---|
| Bonferroni | FWER | Single threshold: α/m | Simple, controls any dependence | Excessively conservative, low power |
| Benjamini-Hochberg (BH) | FDR | Step-up procedure with linear threshold | More powerful than FWER, standard for omics | Requires independence or positive dependence |
| Storey-Tibshirani (q-value) | FDR (estimated) | Estimates proportion of true nulls (π₀) | Often more powerful than BH | Requires large m for reliable π₀ estimation [38] |
| Two-Stage Adaptive BH | FDR | Estimates π₀ in a first step | Increased power when many alternatives | Complexity, may be less stable |
Application of FDR Control in DEREPLICATOR+
The DEREPLICATOR+ Algorithm and Workflow
DEREPLICATOR+ is designed for the high-throughput dereplication of diverse microbial metabolites from tandem mass spectrometry (MS/MS) data [2]. Its core innovation lies in translating chemical structures into fragmentation graphs for efficient spectral matching, coupled with rigorous FDR control.
Workflow of the DEREPLICATOR+ Algorithm with Integrated FDR Control
Critical Role of Decoy Databases
A cornerstone of FDR estimation in DEREPLICATOR+ is the use of decoy fragmentation graphs. These are generated by perturbing the structures of target compounds (e.g., through isomerization or shuffling) to create plausible but incorrect matches [2]. The matches to these decoys provide a direct estimate of the false positive rate under the null hypothesis. The distribution of scores against decoys is used to model the null distribution and compute p-values for matches against target compounds, which are then fed into an FDR control procedure [2].
Performance and Empirical FDR Assessment
In benchmark studies, DEREPLICATOR+ demonstrated superior sensitivity while maintaining strict FDR control. When searching spectra from Actinomyces strains:
- At a 1% FDR, DEREPLICATOR+ identified 488 unique compounds (8,194 MSMs).
- At a more stringent 0% FDR, it identified 154 unique compounds (2,666 MSMs). This represents a twofold increase in identifications at 0% FDR compared to its predecessor, DEREPLICATOR, which was limited to peptide natural products [2].
Table 3: Example Performance of DEREPLICATOR+ at Different FDR Thresholds
| FDR Threshold | Unique Compounds Identified | Total MSMs | Key Compound Classes Found |
|---|---|---|---|
| 1% | 488 | 8,194 | Peptides, Lipids, Polyketides, Terpenes, Benzenoids |
| 0% (Stringent) | 154 | 2,666 | Peptides (19), Polyketides (2), Terpenes (2), Benzenoids (1) |
Protocols for Implementing FDR Control in Metabolite Identification
Protocol 1: Standard FDR-Controlled Dereplication Using DEREPLICATOR+
Objective: To identify known metabolites from MS/MS data at a specified false discovery rate (e.g., 1%).
- Data Preparation: Convert raw LC-MS/MS files to open formats (e.g., .mzML). Assemble a target database of chemical structures (e.g., AntiMarin, Dictionary of Natural Products) [2].
- Decoy Generation: Use built-in algorithms to create a decoy database from the target structures via molecular shuffling or isomerization [2].
- Spectral Matching: Search all experimental spectra against the combined target-decoy database using the DEREPLICATOR+ search engine. It generates a fragmentation graph for each compound and scores matches based on shared peaks and fragmentation consistency [2].
- Statistical Validation: a. Compile all match scores for target (T) and decoy (D) hits. b. For a given score threshold S, estimate the FDR as: FDR(S) ≈ D(S) / T(S). c. Apply the Benjamini-Hochberg procedure to the p-values derived from the match scores to determine the threshold that controls the FDR at the desired level (e.g., α=0.01) [36] [2].
- Result Filtering: Retain only identifications with match scores that meet or exceed the threshold determined in step 4. Report the list of annotated metabolites with the controlled FDR.
Protocol 2: Assessing FDR Robustness in Correlated Metabolomic Data
Objective: To evaluate and mitigate the risk of FDR inflation due to correlation between metabolic features [40].
- Generate a Synthetic Null Dataset: Create a dataset where no true differential metabolites exist by: a. Randomly shuffling sample labels (e.g., treatment/control) in the experimental data, or b. Using samples from identical biological conditions [40].
- Run the Discovery Pipeline: Process the synthetic null dataset through the same DEREPLICATOR+ and FDR control workflow (Protocol 1).
- Audit the Results: Any metabolite identifications reported at the target FDR (e.g., 1%) in the null dataset are, by definition, false discoveries.
- Quantify Inflation: Calculate the empirical FDP (False Discovery Proportion) as the number of discoveries from the null dataset divided by the total discoveries expected from the real data. This provides a reality check against theoretical FDR guarantees [40].
- Implement Mitigation (if needed): If significant inflation is observed, consider:
- Applying the more conservative Benjamini-Yekutieli procedure [36].
- Using group-based FDR control where correlated metabolites (e.g., within a pathway) are tested as a unit.
- Reporting results with the empirically validated FDR estimate.
The Benjamini-Hochberg Step-Up Procedure for FDR Control
Challenges and Considerations in FDR for Metabolomics
Dependence and FDR Inflation
A major challenge in applying FDR control to metabolomics is the inherent correlation between metabolic features. Metabolites exist in biochemical pathways, leading to strong positive dependencies in their abundance and fragmentation patterns [40]. While the BH procedure is theoretically robust to positive dependence, recent research shows that in practice, high correlation combined with slight data biases can lead to "bursts" of false discoveries, where a large number of correlated null hypotheses are simultaneously rejected [40]. This risk necessitates the use of synthetic null data and empirical validation as outlined in Protocol 2.
The Low-Dimensional Setting
FDR methods, particularly those that estimate the proportion of true nulls (π₀), are designed for high-dimensional settings (many tests). Their performance, especially specificity, can degrade in low-dimensional scenarios (e.g., validating a handful of candidate biomarkers) [38]. In such cases, more conservative FWER-controlling methods (e.g., Holm's procedure) may be more appropriate for confirmatory analysis [38].
Integration with Genomics and Multi-Omics
The future of microbial metabolite discovery lies in integrated multi-omics. Tools like DEREPLICATOR+ enable the cross-validation of genome-mining predictions (e.g., identifying Biosynthetic Gene Clusters with antiSMASH) with actual metabolomic profiles [2] [41]. In these integrative workflows, FDR control must be carefully applied across different layers of evidence (genomic, spectral, network-based) to avoid compounding errors and producing unreliable leads [41] [42].
Table 4: Essential Resources for FDR-Controlled Metabolite Identification
| Resource | Type | Primary Function in FDR/Dereplication | Example/Reference |
|---|---|---|---|
| High-Resolution Mass Spectrometer | Instrument | Generates high-accuracy MS/MS spectra for reliable matching and scoring. | Orbitrap, FT-ICR, Q-TOF platforms [41] |
| Chemical Structure Databases | Database | Provides the target library of known compounds for dereplication. | AntiMarin, Dictionary of Natural Products, GNPS libraries [2] |
| Decoy Database Generation Algorithm | Software | Creates false targets for empirical null modeling and FDR estimation. | Built into DEREPLICATOR+ [2] |
| Global Natural Products Social (GNPS) | Platform/Repository | Public repository for sharing mass spectra, enabling community-wide FDR benchmarks and library searches [2] [41]. | https://gnps.ucsd.edu |
| Statistical Computing Environment | Software | Implements FDR control procedures (BH, q-value) and custom analyses. | R (stats, qvalue packages), Python (SciPy, statsmodels) |
| Synthetic Null Datasets | Methodological Resource | Used to empirically test and validate FDR control in the presence of data dependencies [40]. | Created via sample label permutation or use of blank/control samples |
The rigorous application of False Discovery Rate control is not merely a statistical formality but a foundational component of credible, high-throughput microbial metabolite discovery. The DEREPLICATOR+ algorithm exemplifies the successful integration of sophisticated FDR methodology into a practical research tool, significantly accelerating the dereplication process while safeguarding against false leads. As the field advances towards integrative multi-omics and the analysis of ever-larger spectral datasets, continued attention to the nuances of FDR control—especially concerning data dependence, empirical validation, and multi-layered evidence integration—will be paramount. By adhering to robust FDR-controlled protocols, researchers can ensure that the promising compounds selected for downstream development represent genuine discoveries with the highest possible confidence.
The discovery of microbial natural products (NPs) remains a critical pipeline for new antibiotics and pharmacologically active compounds. However, a primary bottleneck is the high rate of rediscovering known metabolites, a process termed "dereplication" [2]. Efficient dereplication requires comparing experimental data, typically from tandem mass spectrometry (MS/MS), against comprehensive databases of known compounds. The DEREPLICATOR+ algorithm represents a significant advancement in this field. It moves beyond the identification of peptidic natural products (PNPs) to enable the dereplication of a much broader spectrum of metabolite classes, including polyketides, terpenes, benzenoids, and alkaloids, by employing a generalized in silico fragmentation graph approach [2] [4]. Its integration with the Global Natural Products Social Molecular Network (GNPS) infrastructure allows for the high-throughput screening of hundreds of millions of mass spectra [2].
The core thesis of this article is that the effectiveness of powerful algorithms like DEREPLICATOR+ is intrinsically linked to the breadth and quality of the underlying structural databases. While generic databases exist, they often lack the specialized, curated content necessary for focused research on specific microbial taxa, biosynthetic pathways, or novel chemical space. Therefore, the strategic development and application of custom structural databases is essential to expand coverage, reduce annotation gaps, and accelerate the discovery of truly novel bioactive metabolites.
Public databases like PubChem, ChemSpider, and even dedicated NP resources such as AntiMarin or the Dictionary of Natural Products provide a foundational layer for dereplication [2]. However, they present several limitations that custom databases can address:
- Incomplete Coverage of Microbial "Dark Matter": A vast portion of microbial metabolites, particularly those from uncultivated or rare taxa, are not represented in standard databases. Integrated multi-omic studies, which combine genomics with metabolomics, frequently detect compounds from expressed biosynthetic gene clusters (BGCs) that have no match in public spectral libraries [12].
- Lack of Contextual Metadata: Generic databases may not contain detailed metadata linking compounds to specific producing organisms, geographical origins, or cultivation conditions. Databases like the Microbial Metabolome Database (MiMeDB) are designed to make these crucial links between microbes, their metabolites, and host health [43] [44].
- Irrelevant Chemical Space: For a research group focused on, for example, cyanobacterial lipopeptides, searching through millions of synthetic drug-like molecules or plant flavonoids adds noise and computational overhead without benefit.
The performance of DEREPLICATOR+ itself highlights this need. In a benchmark study, it identified 488 unique compounds in Actinomyces spectral data at a 1% false discovery rate (FDR), a substantial increase over previous tools [2]. However, many matches were to well-known compounds, underscoring that novel discovery is gated by database content. Building a custom database populated with hypothetical structures predicted from genome mining (e.g., from silent or cryptic BGCs) is a strategic method to probe this uncharted chemical space [5].
Table 1: Limitations of Generic Databases vs. Advantages of Custom Databases
| Aspect | Generic Public Databases | Custom Structural Databases |
|---|---|---|
| Coverage | Broad but shallow for specialized taxa; contains known compounds. | Deep and focused on a specific research niche (e.g., phylum, BGC type). |
| Metadata | Often limited to basic chemical structures and names. | Can include rich, project-specific data: source organism genome ID, cultivation parameters, bioactivity data. |
| Relevance | High proportion of irrelevant entries for a focused study. | Highly curated to contain only compounds relevant to the research question. |
| Novelty Gate | Primarily aids in dereplication of knowns. | Can be seeded with in silico predicted structures from genome mining to target novelty. |
| Integration | Static; user has no control over content. | Dynamic; can be continuously updated with new internal discoveries and published data. |
Strategic Framework for Building Custom Structural Databases
Constructing a high-quality custom database is a multi-step process that enhances the targetability of DEREPLICATOR+ searches.
1. Define Scope and Source Data: Clearly delineate the database's focus. This could be:
- Taxon-specific: All metabolites from the genus Streptomyces or cyanobacterial families.
- Pathway-specific: Compounds derived from nonribosomal peptide synthetase (NRPS), type I polyketide synthase (T1PKS), or ribosomally synthesized and post-translationally modified peptide (RiPP) pathways.
- Project-specific: All detected features from a dedicated collection of microbial isolates or environmental samples. Source data can be mined from public resources (e.g., extracting all entries for a taxon from MiMeDB [43] or AntiMarin), literature curation, and in-house experimental data.
2. Curate Chemical Structures and Identifiers: The core of the database is a list of chemical structures in a standardized format (e.g., SMILES, InChI, SDF). Essential steps include:
- Standardization: Normalize structures (e.g., aromatization, neutralization) to ensure consistency.
- Deduplication: Remove identical structures to create a set of unique compounds.
- Annotation: Attach crucial metadata: canonical name, molecular formula, accurate mass, originating source, and PubMed IDs (if applicable).
3. Integrate Genomic Context (Optional but Powerful): For maximum impact, link chemical entries to genomic data. This involves associating metabolites with their corresponding Biosynthetic Gene Clusters (BGCs) identified by tools like antiSMASH [5]. This creates a genome-metabolome nexus that allows DEREPLICATOR+ annotations to be cross-validated by genomic evidence and vice-versa, a strategy proven effective in integrated studies [12].
4. Format for DEREPLICATOR+ Compatibility: DEREPLICATOR+ accepts custom databases in a simple tab-separated values (TSV) format. The required columns are:
ID: A unique identifier for the compound.SMILES: The structure in SMILES notation.Name: The compound name.MolecularFormula: The chemical formula.ExactMass: The calculated monoisotopic mass.
Table 2: Essential Components of a DEREPLICATOR+-Ready Custom Database File
| Column Name | Description | Example Entry |
|---|---|---|
ID |
Unique internal database identifier. | CUST_00145 |
SMILES |
Standardized SMILES string of the structure. | CC1C(C(C(C(O1)OC2C(C(C(C(O2)CO)O)O)O)O)O)O |
Name |
Common or systematic name of the compound. | Trehalose |
MolecularFormula |
Chemical formula. | C12H22O11 |
ExactMass |
Calculated monoisotopic mass. | 342.1162 |
SourceOrganism |
(Optional metadata) Producing organism. | Streptomyces coelicolor |
BGC_Accession |
(Optional metadata) Linked BGC identifier. | MIBIG:BGC0000001 |
Diagram 1: Custom database construction workflow.
Protocol: Deploying a Custom Database with DEREPLICATOR+ on GNPS
This protocol details the steps to utilize a custom structural database within the GNPS DEREPLICATOR+ workflow [4].
Materials:
- MS/MS data in open format (
.mzML,.mzXML, or.MGF). - Custom database file in TSV format, as described in Table 2.
- A GNPS user account (http://gnps.ucsd.edu).
Procedure:
Access the Workflow: Log in to GNPS. Navigate to the "In Silico Tools" page and select the "DEREPLICATOR+" workflow [4] [10].
Upload Spectral Data: Under "Select Input Spectra," upload your MS/MS data files or select an existing dataset within GNPS. Click "Finish Selection."
Set Search Parameters: Configure key parameters:
- Basic Options: Set
Precursor Ion Mass ToleranceandFragment Ion Mass Toleranceaccording to your mass spectrometer's accuracy (e.g., ±0.005 Da and ±0.01 Da for high-resolution instruments) [4]. - Advanced Options - Database Selection: This is the critical step. Under
Custom DB file, provide the URL to your hosted custom TSV file or use the file selector to upload it directly. This overrides the predefined database choice.
- Basic Options: Set
Submit Job: Provide a job title and your email address. Click "Submit." Processing time depends on dataset and database size.
Analyze Results: Upon completion, results can be viewed via the provided link.
- "View Unique Metabolites": Provides a summary list of annotated compounds, sorted by score.
- "View All MSM": Shows detailed Metabolite-Spectrum Matches (MSMs). Inspect individual matches to see the annotated spectrum against the theoretical fragmentation graph of your custom database entry.
- Integrate with Molecular Networking: Export results and map annotations onto a molecular network in Cytoscape to visualize chemical relationships and propagate annotations within spectral families [10].
Diagram 2: Custom database deployment in DEREPLICATOR+.
Experimental Validation and Cross-Omics Integration
An annotation from a custom database search, especially with novel or predicted structures, requires rigorous validation. A multi-omic framework provides the highest confidence.
Protocol: Integrated Genomic-Metabolomic Validation
Materials:
- Microbial isolate with sequenced genome.
- LC-HRMS/MS system.
- Bioinformatics tools: antiSMASH [5], genomics platform.
Procedure:
Genome Mining: Assemble the genome of your microbial isolate of interest. Use the antiSMASH tool to identify and annotate all Biosynthetic Gene Clusters (BGCs) [5]. Export the predicted chemical structures (e.g., as SMILES) associated with these BGCs to create a genome-predicted custom database.
Metabolite Profiling: Culture the isolate under conditions designed to elicit secondary metabolism (considering media, aeration, co-culture). Extract metabolites and analyze by LC-HRMS/MS.
Targeted Dereplication: Process the MS/MS data with DEREPLICATOR+ using the genome-predicted custom database from Step 1. This directly tests for the production of compounds predicted by genomics.
Cross-Validation: For each DEREPLICATOR+ match:
- Spectral Validation: Manually inspect the quality of the MS/MS spectral match.
- Genomic Corroboration: Confirm the matched compound is linked to a BGC present in the isolate's genome. The absence of a corresponding BGC is a strong indicator of a false positive.
- Contextual Evidence: Use molecular networking on GNPS to see if the annotated node clusters with other related spectra, supporting its identity.
This approach was validated in a 2025 study where genomics uncovered the production of streptothricin antibiotics that were not initially detected by MS-based dereplication alone, demonstrating the complementary power of the integrated method [12].
Diagram 3: Multi-omic validation workflow for novel metabolites.
Table 3: Key Research Reagent Solutions for Custom Database Work
| Item / Resource | Function / Description | Key Reference / Source |
|---|---|---|
| GNPS Platform | Cloud-based ecosystem for mass spectrometry analysis, hosting DEREPLICATOR+ and molecular networking. | [2] [4] |
| antiSMASH | Standard bioinformatics tool for the genomic identification and analysis of Biosynthetic Gene Clusters (BGCs). | [5] |
| MiMeDB (Microbial Metabolome Database) | A specialized database linking microbial metabolites to producers and health data; an ideal source for custom database building. | [43] [44] |
| 0.03 µm Semipermeable Membranes | Used in constructing microbial diffusion chambers for the in-situ cultivation of hard-to-grow environmental isolates. | [12] |
| R2A & SMS Agar Media | Low-nutrient media used for the cultivation and retrieval of diverse soil bacteria from diffusion chambers. | [12] |
| MZmine 2 or Similar | Software for processing raw LC-MS data (peak detection, alignment, deconvolution) prior to DEREPLICATOR+ analysis. | [45] |
| Cytoscape with ChemViz2 | Network analysis and visualization software to map DEREPLICATOR+ annotations onto molecular networks. | [10] |
The strategic creation and use of custom structural databases fundamentally expands the discovery capabilities of the DEREPLICATOR+ algorithm. By focusing searches on chemically relevant and genomically informed space, researchers can dramatically improve the efficiency of dereplication and the targeting of novel metabolites. The integration of this approach within a multi-omic framework—coupling custom database searches with genome mining and molecular networking—establishes a robust, iterative cycle for natural product discovery.
Future developments will likely involve the automated generation of custom databases from genomic predictions and the application of machine learning models to score the confidence of novel annotations. As these tools evolve, the systematic building of high-quality, specialized databases will remain a cornerstone activity for research teams aiming to translate microbial chemical diversity into new therapeutic leads.
The identification of microbial metabolites from complex mass spectrometry data remains a central challenge in natural product research and drug discovery. While DEREPLICATOR+ represents a significant leap forward by enabling the dereplication of diverse natural product classes—including polyketides, terpenes, alkaloids, and non-peptidic molecules—it operates primarily on individual spectra [2]. This approach, though powerful, encounters limitations when confronting the vast "dark matter" of metabolomics, where over 85% of detected MS/MS spectra lack matches in reference libraries [46]. The algorithm's core strength lies in its graph-based fragmentation model that constructs theoretical spectra from chemical structures and scores metabolite-spectrum matches (MSMs) with statistical validation [2]. However, the structural annotations generated by DEREPLICATOR+ and similar in silico tools are inherently probabilistic, often presenting researchers with a ranked list of candidate structures for a single spectrum without leveraging the collective information embedded in related spectra within a dataset.
This application note posits that the integration of DEREPLICATOR+ with complementary tools available within the Global Natural Products Social Molecular Networking (GNPS) infrastructure—specifically Network Annotation Propagation (NAP) and MS2LDA—creates a synergistic framework that transcends the limitations of individual analysis. NAP utilizes the topology of molecular networks to propagate and re-rank structural annotations [47], while MS2LDA discovers and annotates recurring substructural motifs (Mass2Motifs) across large spectral datasets [48]. When framed within a thesis on advancing microbial metabolite identification, this integration represents a paradigm shift from analyzing spectra in isolation to interpreting them within their context: the spectral similarity network and the conserved fragmentation patterns that hint at shared biochemistry. This document provides detailed application notes and experimental protocols for deploying these integrated strategies, equipping researchers with a robust pipeline for comprehensive microbial metabolome exploration.
Network Annotation Propagation (NAP): Leveraging Spectral Networks for Confident Annotation
Conceptual Foundation and Integration Rationale
Network Annotation Propagation (NAP) is founded on the principle that structurally related molecules yield similar fragmentation spectra. These relationships are captured in molecular networks, where nodes represent consensus MS/MS spectra and edges signify spectral similarity [47]. While DEREPLICATOR+ provides putative structural identities for individual nodes, NAP enhances this by using the network's topology to improve the ranking of candidate structures proposed by in silico tools like MetFrag [49].
The integration with DEREPLICATOR+ is logical and powerful. DEREPLICATOR+ can serve as a superior input provider for NAP. Where traditional in silico searches might yield candidate lists with uncertain rankings, DEREPLICATOR+'s class-specific fragmentation rules can generate higher-quality initial candidate proposals for nodes in a network, particularly for complex microbial natural products. NAP then applies two core re-ranking strategies:
- Fusion Scoring: Used when a node in the network has a confident spectral library match (e.g., from a DEREPLICATOR+ identification or GNPS library). This match acts as an "anchor," and candidate structures for neighboring unknown nodes are re-ranked based on their structural similarity to the anchor compound [47].
- Consensus Scoring: Applied in molecular families lacking library matches. Candidate structures for all nodes in a connected component are evaluated, and rankings are optimized to promote a consensus of structurally similar candidates across neighboring nodes [47].
This process effectively propagates annotations from known points in the network (which DEREPLICATOR+ can help establish) to unknown neighbors, transforming isolated predictions into a consistent, network-supported annotation hypothesis.
Performance and Quantitative Insights
Benchmarking studies demonstrate NAP's efficacy. In a validated test set, NAP's re-ranking was able to place the correct chemical substructure within the top-ranked candidate for up to 81% of nodes when library matches were present, and for 63% of nodes in networks devoid of library matches [47]. This represents a substantial improvement over the baseline performance of standalone in silico fragmentation tools.
Table 1: Key Performance Metrics for Annotation Tools in Microbial Metabolomics
| Tool | Primary Function | Typical Annotation Rate/Improvement | Key Strength | Key Dependency/Limitation |
|---|---|---|---|---|
| DEREPLICATOR+ | In silico DB search for diverse NPs | 5x more IDs than predecessors; 1.2% of spectra in Actinomyces dataset at 1% FDR [2] | Broad coverage of NP classes; Statistical FDR control | Quality of in silico fragmentation model |
| Library Search (GNPS) | Experimental spectrum matching | ~2-15% of spectra in typical datasets [46] | High confidence (MSI Level 1) | Limited by library coverage |
| Network Annotation Propagation (NAP) | Network-aware re-ranking of in silico candidates | Correct substructure in top candidate for 63-81% of nodes [47] | Leverages network topology for confidence | Requires a pre-existing molecular network |
| MS2LDA | Substructure (Mass2Motif) discovery | Discovers hundreds of motifs from 1000s of spectra [48] | Reveals conserved biochemistry beyond full structures | Requires parameter tuning (LDA free motifs) |
Detailed Protocol for NAP Analysis
Prerequisites: A completed GNPS molecular networking job (Classical or Feature-Based) and a list of candidate structures for nodes of interest (which can be derived from a DEREPLICATOR+ output or other in silico search).
Step 1: Input Preparation
- Obtain GNPS Network Task ID: After running a molecular networking job on GNPS, note the task ID from the results URL or email [49].
- Prepare Structure Database: Compile a relevant structure database in a tab-separated (.tsv) format with two columns: SMILES strings and compound identifiers. This can include:
- Public databases (e.g., HMDB, CheBI, DrugBank) selected within NAP.
- A custom, user-provided database. Format this database using the GNPS structure formatting webserver to generate the required input file [49].
Step 2: Job Submission on GNPS
- Access the NAP workflow via the GNPS interface (under 'Workflows' > 'NAP_CCMS') [13].
- Set Critical Parameters:
GNPS job ID: Enter your molecular networking task ID.Number of a cluster index: Specify a cluster (molecular family) of interest to limit computation. Use '0' to process all clusters.Cosine value to subselect inside a cluster: Adjust (default 0.5) to simplify overly dense networks.Accuracy for exact mass candidate search (ppm): Set according to instrument accuracy (default 15 ppm).Structure databases: Select relevant public DBs.User provided database: Upload your formatted custom structure file.Maximum number of candidate structures in the graph: Limits output complexity (default 10) [49].
Step 3: Results Exploration
- Online Viewer: Use the "EXPERIMENTAL - NAPviewer" link on the results page to explore [49]:
- Structure View: Compare the original in silico rankings (e.g., from MetFrag) with the NAP re-ranked list.
- Graph View: Visualize the molecular family with node borders colored by annotation source (green: library; magenta: original in silico; blue: Fusion score; red: Consensus score).
- Fragment View: Inspect predicted fragments for candidate structures.
- Cytoscape Visualization:
- Download the
structure_graph_alt.xgmmlfile from the results. - In Cytoscape (v3.4+), install the ChemViz2 plugin via the App Manager.
- Import the .xgmml file and apply a layout (e.g., Prefuse Force Directed).
- Use the ChemViz2 settings to map SMILES columns (e.g.,
ConsensusSMILES) to node images, painting the propagated structures onto the network [49].
- Download the
Diagram 1: NAP Workflow Integrates Network and Database Search
MS2LDA: Decoding Substructure Patterns in Complex Metabolomes
Conceptual Foundation and Integration Rationale
MS2LDA applies Latent Dirichlet Allocation (LDA), a topic modeling algorithm, to mass spectrometry fragmentation data. It deconvolutes thousands of MS/MS spectra into a set of recurring fragmentation patterns called Mass2Motifs [48]. Each Mass2Motif represents a co-occurring set of mass fragments and/or neutral losses that often correspond to a specific molecular substructure (e.g., a hexose moiety, an arginine-containing dipeptide, or a particular polyketide chain fragment).
The synergy with DEREPLICATOR+ is profound. While DEREPLICATOR+ attempts to identify whole molecules, MS2LDA identifies the building blocks that constitute them. In the context of microbial metabolite research, this is invaluable. For example, DEREPLICATOR+ might identify a variant of a known polyketide. MS2LDA analysis of the same dataset could reveal the specific polyketide synthase extension units or modification patterns that are recurrent across many unknown compounds in the extract, guiding the discovery of entirely new structural families. MS2LDA thus provides a complementary, substructure-centric lens that organizes the chemical space independently of full-structure databases.
Operational Parameters and Output
A successful MS2LDA experiment requires careful parameter setting based on the data characteristics [48] [50].
Table 2: Key MS2LDA Parameters for Microbial Metabolomics Data
| Parameter | Recommended Setting for Microbial Extracts | Function and Rationale |
|---|---|---|
| Bin Width | 0.005 Da (Q-Exactive) / 0.01 Da (ToF) / 0.1 Da (Ion Trap) | Bins MS2 peaks to account for mass drift; instrument-specific. |
| Minimum MS2 Intensity | 100-5000 (Inspect raw spectra for noise level) | Filters out noise to speed analysis and improve motif quality. |
| LDA Free Motifs | 150-300 | The number of novel motifs to discover. Larger datasets (>4000 spectra) with novel chemistry require higher values. |
| Probability (P) & Overlap (O) Thresholds | P ≥ 0.05, O ≥ 0.3 (Start points) | Control linkage between a spectrum and a motif. P is intensity proportion; O is fraction of motif features present [48]. |
| MotifDB Motif Sets | Select GNPS, MassBank; exclude distant sources (e.g., plant if analyzing bacteria) | Uses pre-annotated motifs from reference standards for partial annotation. |
The primary outputs include:
- A list of Mass2Motifs with their associated fragment/loss patterns.
- An annotated edge file linking spectra not only by spectral similarity but also by shared Mass2Motifs. This file can be used to create a motif-enhanced molecular network in Cytoscape.
- An MS2LDA dictionary (.dict) file containing the full model, which can be uploaded to the MS2LDA web application (ms2lda.org) for advanced exploration, manual motif annotation, and differential analysis [48] [50].
Detailed Protocol for MS2LDA Analysis
Prerequisites: A completed GNPS molecular networking job.
Step 1: Input File Collection From your GNPS molecular networking job results folder, download:
- The clustered spectral file (.mgf).
- The edges file with self-loops (typically
networkedges_selfloop/*.pairsinfo). - (Optional) An MS1 feature quantification table (.csv) from MZmine2 for later differential analysis [48].
Step 2: Job Submission on GNPS
- Initiate the MS2LDA workflow. For jobs using the newer GNPS interface, this can often be launched directly via the "Analyze with MS2LDA" button in the "Advanced Views" of a molecular networking result page [48].
- Set Critical Parameters:
- LDA Parameters: Set
Bin Width,Minimum MS2 Intensity, andLDA Free Motifsas guided by Table 2. - MotifDB Selection: Curate the list of pre-annotated motif sets to match your sample type.
- Output Thresholds: Set initial
ProbabilityandOverlapscore thresholds (e.g., 0.05 and 0.3).
- LDA Parameters: Set
Step 3: Advanced Analysis on MS2LDA.org
- Download the
result.ms2lda.dictfile from your completed GNPS job. - Log into ms2lda.org and upload the .dict file via the "Upload" tab, specifying the experiment name and correct bin width [50].
- Explore the experiment:
- Use the Summary Page to browse the discovered Mass2Motifs.
- Annotate Motifs: Click on a "free" (unannotated) motif. Examine its top fragments and the spectra in which it appears. If a substructure can be inferred (e.g., "guanidine group" from a loss of 59.048 Da), add the annotation in the provided field [48].
- Perform Motif Matching: Use the "Start Motif Matching" function to compare your discovered motifs against pre-existing libraries (e.g.,
gnps_binned_005) to automatically propose annotations based on cosine similarity [50].
Diagram 2: MS2LDA Discovers Substructure Motifs from Spectral Data
Integrated Strategy: A Synergistic Pipeline for Thesis Research
The most powerful approach for a comprehensive microbial metabolomics thesis is the sequential and iterative integration of DEREPLICATOR+, NAP, and MS2LDA. This pipeline transforms raw MS/MS data into layered, context-rich structural hypotheses.
Proposed Integrated Workflow
- Data Processing & Dereplication: Process raw LC-MS/MS data through the GNPS pipeline to create a molecular network. Run DEREPLICATOR+ on the dataset to obtain confident, FDR-controlled identifications of known microbial metabolites [2]. These become anchor points.
- Annotation Propagation: Use the DEREPLICATOR+ identifications and the molecular network as input for NAP. Let NAP propagate these annotations and re-rank in silico candidates for unknown neighbors, generating network-consistent structural hypotheses for a larger fraction of nodes [49] [47].
- Substructure Discovery: In parallel, run MS2LDA on the same spectral data. Discover the recurrent Mass2Motifs within the dataset. Annotate these motifs using reference libraries (
MotifDB) and manual inspection based on microbial biochemistry knowledge [48]. - Data Fusion & Interpretation: Overlay the results:
- In the molecular network, color nodes by DEREPLICATOR+/NAP annotations.
- Use the MS2LDA output to add "motif-edges" or annotate nodes with their associated Mass2Motifs.
- This fusion allows you to observe, for instance, that a cluster of nodes annotated by NAP as "angucycline-like polyketides" all share a specific MS2LDA motif that corresponds to a characteristic tetracyclic loss pattern. This triangulates evidence from whole-molecule matching, network topology, and substructure patterns, yielding annotations with higher confidence.
Table 3: The Scientist's Toolkit for Integrated GNPS Analysis
| Tool / Resource | Primary Function in Pipeline | Key Input | Critical Output for Integration |
|---|---|---|---|
| GNPS Platform | Central processing hub for networking. | mzML/mzXML/MGF files. | Molecular network (graph topology & consensus spectra). |
| DEREPLICATOR+ | Initial dereplication & anchor identification. | MS/MS data, structure DBs. | List of high-confidence IDs (anchors for NAP). |
| Network Annotation Propagation (NAP) | Network-aware annotation & candidate re-ranking. | GNPS job ID, structure DBs. | Re-ranked candidate lists; annotated network (.xgmml). |
| MS2LDA | Substructure (Mass2Motif) discovery. | Clustered .mgf, network edges. | List of Mass2Motifs; motif-annotated edge file. |
| Cytoscape | Unified network visualization & data fusion. | NAP .xgmml, MS2LDA edges. | Integrated visual model combining all annotations. |
| MotifDB | Library of pre-annotated Mass2Motifs. | Used within MS2LDA workflow. | Automatic partial annotation of discovered motifs. |
| ClassyFire | Automated chemical classification. | SMILES strings (from annotations). | Standardized chemical class assignments for candidates [2]. |
Case Example within a Thesis Framework
A thesis chapter could demonstrate this pipeline on a dataset from a novel marine Streptomyces strain.
- DEREPLICATOR+ identifies desferrioxamine B and several known piericidin analogs.
- NAP uses these anchors to propose that an adjacent, unknown molecular family consists of acylated derivatives of these core structures.
- MS2LDA discovers a motif comprising a loss of 42.010 Da and a fragment at 112.112 Da, which you annotate as a "dimethylaminopyridine moiety" based on literature and MotifDB matching.
- Integration Insight: The MS2LDA motif is found not only in the piericidin cluster but also in several completely unannotated clusters. This leads to the novel thesis hypothesis that this bioactive substructure is biosynthesized and incorporated into multiple, potentially novel, scaffold families by this strain, guiding subsequent targeted isolation and genomic mining efforts.
Concluding Protocols for Experimental Design
To implement this integrated strategy, follow this consolidated experimental protocol:
Phase 1: Sample Preparation & LC-MS/MS Acquisition
- Culture & Extraction: Grow microbial strains under varied conditions (e.g., multiple media, co-culture) to induce diverse metabolite production. Perform standard solvent extraction.
- Chromatography: Use reversed-phase LC with gradients suitable for polar to mid-polar natural products.
- Mass Spectrometry: Acquire data in data-dependent acquisition (DDA) mode on a high-resolution instrument (Q-TOF, Orbitrap). Ensure MS/MS fragmentation energy (collision energy) is optimized to produce rich, informative fragment spectra.
Phase 2: Core GNPS Processing & DEREPLICATOR+ Analysis
- Convert raw data to .mzML or .mgf format using MSConvert [51].
- Upload to GNPS and run a Feature-Based Molecular Networking (FBMN) job using MZmine3 for preprocessing. This retains crucial chromatographic alignment information [3].
- Submit the same data to the DEREPLICATOR+ workflow on GNPS. Use the AntiMarin and Dictionary of Natural Products databases as primary references for microbial metabolites [13]. At a 1% FDR threshold, compile the list of high-confidence identifications.
Phase 3: Sequential NAP and MS2LDA Analysis
- NAP Job:
- Input: The FBMN job ID and the list of high-confidence DEREPLICATOR+ identifications (formatted as a custom structure database).
- Goal: Generate a Cytoscape file where structural annotations are propagated.
- MS2LDA Job:
- Input: The .mgf and edges file from the same FBMN job.
- Parameters: Set
LDA Free Motifsto 250,Minimum MS2 Intensityappropriate to your instrument. - Goal: Obtain the motif list and the motif-enhanced edge file.
Phase 4: Data Fusion, Visualization, & Hypothesis Generation
- In Cytoscape, import the NAP-generated network (.xgmml file).
- Import the MS2LDA motif edges as an additional network and merge them with the NAP network.
- Visual Styling:
- Color nodes by the annotation source (DEREPLICATOR+ library match, NAP Fusion, NAP Consensus).
- Resize nodes by feature abundance or degree of connectivity.
- Label edges that represent shared Mass2Motifs and color them by the motif's annotation.
- Interpretation: Analyze the integrated network to identify key molecular families, study the distribution of substructural motifs, and formulate testable biological hypotheses regarding biosynthetic pathways, chemical ecology, or novel compound discovery.
This multi-layered, integrated approach provides a robust and comprehensive framework for a thesis in microbial metabolite identification, moving decisively from simple dereplication to contextualized, systems-level metabolomic analysis.
Benchmarking DEREPLICATOR+: Validation Metrics, Comparative Advantages, and Integrative Discovery
The discovery of novel microbial metabolites for drug development is fundamentally bottlenecked by the persistent re-identification of known compounds, a costly process termed "rediscovery" [52]. Efficient dereplication—the rapid identification of known entities within complex mixtures—is therefore critical for directing resources toward truly novel chemistry. Framed within a broader thesis on accelerating natural product discovery, the DEREPLICATOR+ algorithm represents a paradigm shift in computational metabolomics [2].
Prior to its development, dereplication tools were largely restricted to specific molecular classes, particularly peptidic natural products (PNPs) [2]. Algorithms like the original DEREPLICATOR utilized a fragmentation model focused on amide (N–C) bonds, limiting their applicability [4]. DEREPLICATOR+ overcomes this by introducing a generalized in silico fragmentation graph approach that simulates the breaking of O–C and C–C bonds in addition to N–C bonds, and accommodates multi-stage fragmentation events [2] [4]. This expansion enables the algorithm to dereplicate a vastly broader spectrum of natural product classes—including polyketides, terpenes, benzenoids, alkaloids, and flavonoids—directly from tandem mass spectrometry (MS/MS) data by searching against databases of chemical structures [2].
The core thesis advanced by this technological leap is that by dramatically improving the scale, accuracy, and scope of automated dereplication, DEREPLICATOR+ clears the primary roadblock in the discovery pipeline. It allows researchers to efficiently map the "known" within massive spectral datasets, such as the Global Natural Products Social (GNPS) molecular network, thereby illuminating the "unknown" and novel variants that hold promise as new pharmaceuticals [2] [52]. The following application note details the quantitative performance gains delivered by this algorithm and provides the essential protocols for its implementation.
Quantitative Performance Benchmarks
The performance of DEREPLICATOR+ was rigorously benchmarked against its predecessor using large-scale, publicly available MS/MS datasets from microbial extracts [2]. The results demonstrate substantial and quantitative improvements in identification rates, spectral coverage, and chemical class diversity.
Table 1: Comparative Identification Performance of DEREPLICATOR vs. DEREPLICATOR+ on Actinomyces Spectral Data (SpectraActiSeq)
| Metric | DEREPLICATOR | DEREPLICATOR+ | Gain Factor |
|---|---|---|---|
| Unique Compounds Identified (0% FDR) | 66 | 154 | 2.3x |
| Total MS/MS Spectra Matched (0% FDR) | 148 | 2,666 | 18.0x |
| Avg. Spectra per Compound | 2.2 | 16.7 | 7.6x |
| Unique Compounds Identified (1% FDR) | 73 | 488 | 6.7x |
| Total MS/MS Spectra Matched (1% FDR) | 166 | 8,194 | 49.4x |
The benchmark analysis of the SpectraActiSeq dataset (containing 178,635 spectra from Actinomyces strains) reveals the dramatic superiority of DEREPLICATOR+ [2]. At a stringent 0% false discovery rate (FDR), DEREPLICATOR+ identified 154 unique compounds, more than double the 66 identified by DEREPLICATOR. The increase in total metabolite-spectrum matches (MSMs) was even more profound, rising from 148 to 2,666, indicating that DEREPLICATOR+ successfully annotates not only more compounds but also many more lower-quality spectra per compound due to its more robust fragmentation model [2].
At a 1% FDR threshold, the gap widens further, with DEREPLICATOR+ identifying 488 unique compounds versus 73 for DEREPLICATOR. This represents an order-of-magnitude increase in the usable data output, transforming a modest list of hits into a comprehensive chemical profile of the sample [2].
Expansion of Chemical Class Coverage
A pivotal advantage of DEREPLICATOR+ is its ability to move beyond the peptide-centric focus of earlier tools. This is quantitatively evidenced by the diversity of chemical classes identified in the high-confidence (0% FDR) dataset [2].
Table 2: Chemical Class Diversity of High-Confidence Identifications by DEREPLICATOR+
| Chemical Class (ClassyFire Taxonomy) | Number of Compounds Identified | Examples Identified |
|---|---|---|
| Peptides and Amino Acid Derivatives | 92 | Actinomycin D, Gratisin |
| Lipids and Lipid-Like Molecules | 32 | Chalcomycin, FK506 |
| Benzenoids | 5 | Candicidin D |
| Terpenes | 6 | Hopanoid derivatives |
| Polyketides | 2 | Chalcomycin, Elaiophyllin |
| Other / Unclassified | 17 | - |
Of the 154 high-confidence identifications, DEREPLICATOR missed 10 compounds entirely, including all identified polyketides, terpenes, benzenoids, and several short peptides [2]. This directly demonstrates the algorithm's breakthrough capability: the dereplication of complex, non-peptidic natural products that constitute a major fraction of bioactive microbial metabolites. For instance, DEREPLICATOR+ successfully identified macrolide polyketides like chalcomycin and the benzoquinone ansamycin elaiophyllin, which were inaccessible to the previous method [2].
Experimental Protocols for DEREPLICATOR+ Analysis
This section provides a detailed, step-by-step protocol for employing DEREPLICATOR+ via the GNPS platform to analyze liquid chromatography-tandem mass spectrometry (LC-MS/MS) data for microbial metabolite dereplication.
Sample Preparation and Data Acquisition Protocol
Objective: Generate high-quality LC-MS/MS data suitable for in silico database searching. Materials:
- Microbial culture extracts (lyophilized or in solvent).
- Appropriate LC-MS grade solvents (e.g., water, acetonitrile, methanol) and modifiers (e.g., formic acid).
- Reversed-phase analytical column (e.g., C18, 2.1 x 100 mm, 1.7-2.2 µm particle size).
- High-resolution tandem mass spectrometer (e.g., Q-TOF, Orbitrap) capable of data-dependent acquisition (DDA).
Procedure:
- Extract Reconstitution: Redissolve lyophilized microbial extracts in a solvent compatible with the starting LC mobile phase (e.g., 10-50% aqueous methanol). Centrifuge to remove particulates.
- LC Method Setup:
- Utilize a binary gradient. A typical method for medium-polarity natural products uses water (A) and acetonitrile (B), both with 0.1% formic acid.
- Program a linear gradient from 5% B to 95% B over 20-40 minutes, followed by a wash and re-equilibration.
- Maintain a constant flow rate (e.g., 0.3-0.4 mL/min) and column temperature (e.g., 40°C).
- MS/MS Acquisition Parameters:
- Operate in positive or negative electrospray ionization (ESI) mode, as appropriate.
- Set the mass spectrometer to perform a full MS1 scan (e.g., m/z 100-1500) at high resolution (≥ 30,000 FWHM).
- Configure DDA to fragment the most intense ions from each MS1 scan. Use a dynamic exclusion window (e.g., 15 seconds) to prevent repeated fragmentation.
- Employ stepped or optimized collision energies to generate rich fragment ion spectra.
- Data Export: Convert raw instrument files to an open, community-standard format (.mzML or .mzXML) using vendor software or tools like MSConvert (ProteoWizard). The data can also be converted to a peak list format (.mgf) for direct upload [4].
DEREPLICATOR+ Analysis Workflow on GNPS
Objective: Annotate metabolites in the acquired MS/MS data by searching against structural databases.
Procedure:
- Data Submission:
- Parameter Configuration:
- Basic Options:
- Advanced Options:
- Database: Select the predefined "AllDB" (contains ~720,000 compounds) or provide a custom database file [4].
- Fragmentation Model: The default "2-1-3" model allows up to two bridges, one 2-cut, and three total cuts, balancing speed and coverage [4].
- Minimum Score: The default score threshold is 12. Adjust based on desired stringency (a score of 9 corresponded to 0% FDR in benchmark studies) [2] [4].
- Job Submission and Monitoring: Submit the job. Processing time varies with dataset size. Completion is notified by email [4].
- Interpretation of Results:
- The primary output is a list of Metabolite-Spectrum Matches (MSMs), each with a computed score and p-value [2].
- Inspect high-scoring matches by examining the annotated spectrum, which shows the experimental peaks matched to theoretical fragments from the candidate structure [10].
- Filter results based on p-value (e.g., p < 10⁻⁸ for high confidence) and biological context (e.g., plausibility given the microbial source) [2].
Diagram 1: DEREPLICATOR+ Analysis Workflow (75 characters)
The Scientist's Toolkit: Essential Research Reagent Solutions
Successful dereplication with DEREPLICATOR+ relies on both computational tools and curated chemical knowledge. Below is a table of essential "research reagent solutions" for designing and executing these experiments.
Table 3: Essential Research Reagent Solutions for DEREPLICATOR+ Experiments
| Tool / Resource | Type | Primary Function in Dereplication | Key Source / Reference |
|---|---|---|---|
| GNPS Platform | Computational Infrastructure | Hosts the DEREPLICATOR+ workflow and provides access to public spectral datasets and libraries for analysis and comparison [4] [10]. | Global Natural Products Social (gnps.ucsd.edu) |
| AntiMarin / Dictionary of Natural Products (DNP) | Curated Chemical Structure Database | Provides comprehensive, structured lists of known natural products against which DEREPLICATOR+ performs its in-silico search. Critical for benchmark studies [2]. | Commercial & Academic Databases |
| AllDB | Integrated Structural Database | The default, consolidated database within DEREPLICATOR+ containing approximately 720,000 compounds for routine searching [4]. | GNPS / DEREPLICATOR+ |
| ClassyFire | Chemical Taxonomy Tool | Automatically classifies identified compounds into standardized chemical classes (e.g., benzenoids, terpenes), enabling rapid biological interpretation of results [2]. | Standalone Web Tool |
| Molecular Networking (GNPS) | Spectral Relationship Analysis | Clusters MS/MS spectra by similarity, allowing identified compounds to contextualize entire clusters of related analogs and novel variants [2] [10]. | GNPS Workflow |
| Authentic Analytical Standards | Physical Chemical Reagents | The gold standard for final, definitive validation of computational identifications via retention time and spectral matching [10]. | Commercial Suppliers |
Visualizing the DEREPLICATOR+ Algorithm Architecture
The performance gains of DEREPLICATOR+ are rooted in its innovative computational architecture. The following diagram illustrates its core algorithm, which generalizes the fragmentation process to enable universal metabolite identification.
Diagram 2: DEREPLICATOR+ Algorithm Pipeline (81 characters)
The algorithm begins by converting a candidate chemical structure into a metabolite graph, a mathematical representation of atoms and bonds [2]. It then generates a comprehensive fragmentation graph by theoretically cleaving not just amide (N–C) bonds, but also ether/ester (O–C) and carbon-carbon (C–C) bonds, simulating the multi-step fragmentation that occurs in a mass spectrometer [2] [4]. This theoretical fragmentation profile is compared to an experimental MS/MS spectrum to produce a scored Metabolite-Spectrum Match (MSM). Statistical significance is estimated using decoy databases to control the false discovery rate (FDR) [2]. Finally, identified spectra can seed molecular networks, grouping related analogs and expanding the discovery power beyond exact database matches [2].
The identification of microbial metabolites, particularly in drug discovery pipelines, is persistently challenged by the re-isolation of known compounds, a costly and time-consuming process known as "rediscovery." Dereplication—the rapid early-stage identification of known compounds within complex mixtures—is therefore a critical gatekeeping step. The advent of high-throughput mass spectrometry (MS) and repositories like the Global Natural Products Social Molecular Networking (GNPS) infrastructure has generated billions of tandem mass (MS/MS) spectra, necessitating equally advanced computational tools for annotation [2] [7].
The original DEREPLICATOR algorithm, introduced in 2017, marked a significant advance by enabling the high-throughput identification of peptidic natural products (PNPs), including nonribosomal peptides (NRPs) and ribosomally synthesized and post-translationally modified peptides (RiPPs). It employed a fragmentation graph model focused on amide (N–C) bond cleavages and integrated with spectral molecular networking for variant discovery [7]. However, its scope was inherently limited to peptide-like compounds.
DEREPLICATOR+, introduced in 2018, represents a major algorithmic evolution designed to overcome this limitation. It generalizes the fragmentation model to include O–C and C–C bonds, enabling the dereplication of a vastly broader spectrum of natural product classes, such as polyketides, terpenes, benzenoids, alkaloids, and flavonoids [2] [4]. This expansion, framed within a broader thesis on microbial metabolite identification, transforms the tool from a specialized peptide analyzer into a universal platform for microbial metabolomics and natural product discovery.
This article provides a comparative analysis of DEREPLICATOR+ against its predecessor and other tools like iSNAP, detailing their algorithmic foundations, performance, and providing explicit protocols for their application in research.
Algorithmic Foundations and Comparative Innovations
The core innovation of dereplication tools lies in their method for generating in silico fragmentation spectra from chemical structures and matching them to experimental MS/MS data. The differences between DEREPLICATOR, DEREPLICATOR+, and iSNAP are foundational to their capabilities and limitations.
- DEREPLICATOR (Original): This algorithm is specialized for peptidic natural products (PNPs). It constructs a "fragmentation graph" from a database compound by breaking specific bonds. Its model is primarily designed for the amide bonds found in peptides. It considers cleavages that result in fragments with at most two disconnected components (bridges) after breaking a limited number of bonds [7]. This model effectively captures linear and cyclic peptide fragments but is not suited for the diverse bond types in other metabolite classes.
- DEREPLICATOR+: This is a generalized algorithm that significantly expands the fragmentation model. It can fragment a molecule by breaking O–C and C–C bonds in addition to N-C bonds. Furthermore, it allows for multi-stage fragmentation (e.g., a fragment ion undergoing further cleavage), which is common in the MS/MS spectra of complex polyketides and terpenes [2] [4]. This comprehensive approach allows it to generate theoretical spectra for virtually any small molecule. The tool uses a default "2-1-3" fragmentation model (max two bridges, one 2-cut, three total cuts) but can be parameterized [4].
- iSNAP (Informatic Search of Natural Products): An earlier tool (2012) focused specifically on nonribosomal peptides (NRPs). It operates by identifying all amide bonds in a structure (from a SMILES string) and generating hypothetical spectral fragments (hSFs) based on amide cleavage, accounting for protonation states and neutral losses (H₂O, NH₃, CO) [53]. Its scoring function was designed to handle the complex architectures of NRPs (linear, cyclic, branch-cyclic) but lacks the generalized bond cleavage and statistical frameworks of the later DEREPLICATOR tools.
Key Differentiating Concept: Spectral Networks and Variant Search Both DEREPLICATOR and DEREPLICATOR+ integrate with the concept of molecular networking on GNPS. Once a known compound is identified, spectral networks can propagate this annotation to related, unidentified spectra in the same dataset. This enables the discovery of new variants of known compounds (e.g., with a methylation, oxidation, or amino acid substitution) [7]. A related tool, DEREPLICATOR VarQuest, formalizes this into a modification-tolerant database search, which is recommended for use alongside DEREPLICATOR [10]. iSNAP, in its original form, did not perform this type of variable dereplication [7].
Table 1: Core Algorithmic Comparison of Dereplication Tools
| Feature | DEREPLICATOR (Original) | DEREPLICATOR+ | iSNAP |
|---|---|---|---|
| Primary Scope | Peptidic Natural Products (NRPs, RiPPs) | Universal Microbial Metabolites (PNPs, Polyketides, Terpenes, etc.) | Nonribosomal Peptides (NRPs) |
| Fragmentation Bonds | Primarily N–C (amide) bonds | N–C, O–C, and C–C bonds | Amide bonds |
| Fragmentation Model | Single-stage, limited cuts [7] | Multi-stage fragmentation allowed [4] | Amide cleavage with offsets [53] |
| Variant Discovery | Via spectral networks / VarQuest [7] [10] | Via spectral networks | Not performed in original algorithm [7] |
| Statistical Framework | p-value & FDR via decoy databases [7] | Score-based significance & FDR [2] | Raw, α, β scores for match significance [53] |
| Typical Use Case | Targeted analysis of microbial peptides | Untargeted metabolomics of microbial extracts | Targeted NRP discovery in pre-2017 workflows |
Performance Benchmarking and Quantitative Analysis
Empirical evaluations demonstrate the superior recall and accuracy of DEREPLICATOR+ over the original DEREPLICATOR, particularly as scoring thresholds are tightened.
A benchmark on the SpectraActiSeq dataset (containing MS/MS from Actinomyces strains) revealed a dramatic increase in identifications. At a strict 0% False Discovery Rate (FDR), DEREPLICATOR+ identified 154 unique compounds, which is more than twice the number identified by the original DEREPLICATOR under comparable conditions [2]. Furthermore, DEREPLICATOR+ consistently identified more spectra per compound, indicating its ability to annotate lower-quality spectra that the more restrictive model of DEREPLICATOR would miss [2].
A separate evaluation on 5,414 annotated spectra from GNPS libraries quantified the precision of DEREPLICATOR+. The results showed that the scoring function is highly predictive: as the score threshold increases, the probability that the top candidate is correct rises significantly [54].
Table 2: Performance Metrics of DEREPLICATOR+ at Different Score Thresholds [54]
| Score Threshold | Number of Annotations | Correct Candidate Ranked #1 | Incorrect Annotations with Structurally Similar Candidate (Tanimoto >0.7) |
|---|---|---|---|
| 3 | 1,574 | 55.5% | Not Specified |
| 5 | 865 | 68.4% | 30.7% |
| 8 | 364 | 78.5% | 52.5% |
DEREPLICATOR+ also enables new discovery avenues. In the Actinomyces study, at a stringent score threshold of 15, it identified 24 high-confidence metabolites. Molecular networking around these 24 "seed" compounds revealed an additional 557 spectral variants, showcasing the power of combining precise database search with network-based propagation [2]. Ten of these 24 seed metabolites—including polyketides, terpenes, and short peptides—were completely missed by the original DEREPLICATOR, highlighting the critical importance of its generalized fragmentation model [2].
Experimental Protocols and Workflows
Protocol: Executing a DEREPLICATOR+ Analysis on GNPS
This protocol details the steps for annotating metabolites in an untargeted MS/MS dataset using the DEREPLICATOR+ workflow on the GNPS platform [4].
Sample Preparation & LC-MS/MS Acquisition:
- Prepare microbial extracts using standard solvent extraction (e.g., 1:1:1 Dichloromethane:Methanol:Water).
- Analyze using reversed-phase liquid chromatography coupled to a high-resolution tandem mass spectrometer (e.g., Q-TOF, Orbitrap) in data-dependent acquisition (DDA) mode.
- Convert raw data files (.d, .raw) to open formats (.mzML, .mzXML, or .mgf) using MSConvert (ProteoWizard).
Data Submission to GNPS:
- Navigate to the GNPS website and log in.
- From the main page, find the "In Silico Tools" box and click "Browse Tools". Select "DEREPLICATOR+" [4].
- Under "Select Input Data," upload your .mzML/.mzXML files or select an existing dataset from the GNPS repository.
Parameter Configuration:
- Basic Options:
- Precursor Ion Mass Tolerance: Set according to instrument accuracy (±0.005 Da for high-res instruments like Orbitrap).
- Fragment Ion Mass Tolerance: Typically ±0.01 Da for high-resolution fragment data.
- Advanced Options:
- Database: The default "AllDB" (contains ~720K compounds) is recommended for universal discovery. A custom database (e.g., in-house library) can be supplied via file or URL.
- Fragmentation Model: The default "2-1-3" model is suitable for most applications [4].
- Min score to consider an MSM as significant: The default is 12. Lowering this increases sensitivity but may reduce precision [4].
- Provide a job title and email for notification.
- Basic Options:
Job Submission and Result Retrieval:
- Click "Submit". Processing time varies with dataset size.
- Upon completion, follow the link in the email or find the job in your GNPS job list.
Interpretation of Results:
- Click "View Unique Metabolites" for a summary list of annotated compounds, sorted by score.
- Click "View All MSM" for detailed Metabolite-Spectrum Matches. Inspect individual matches by clicking "Show Annotation" to visualize the experimental spectrum overlaid with the theoretical fragments on the compound structure.
- Validation: Cross-check high-value annotations by:
- Inspecting the MS/MS spectrum for key fragment ions.
- Checking the biological source plausibility (e.g., is this polyketide known from Actinobacteria?).
- Using other GNPS tools like SIRIUS for molecular formula prediction or MolNetEnhancer for chemical class insights [3].
Protocol: Targeted Peptide Dereplication with DEREPLICATOR (VarQuest)
For projects focused specifically on peptides, the original DEREPLICATOR with VarQuest is optimal for discovering modified variants [10].
- Data Preparation: Follow the same LC-MS/MS acquisition and file conversion steps as in Section 4.1.
- Access Workflow: On GNPS, from "In Silico Tools," select "DEREPLICATOR (VarQuest)" [10].
- Critical Parameter Setting:
- Under Basic Options, enable "Search analog (VarQuest)." This is essential for modification-tolerant search [10].
- Set mass tolerances appropriately.
- Under Advanced Options, the "Max Allowed Modification Mass" parameter (e.g., 300 Da) defines the mass window for unknown modifications to be searched.
- Analysis and Validation: Submit the job. Results will list both known peptides and their putative variants. Validation requires careful manual inspection of the spectral match and the proposed modification site.
Workflow for Metabolite ID with DEREPLICATOR+
Fragmentation Model: DEREPLICATOR vs. DEREPLICATOR+
Effective dereplication requires more than just an algorithm; it is supported by an ecosystem of databases, software, and computational platforms.
Table 3: Key Research Reagent Solutions for Dereplication Studies
| Resource Name | Type | Primary Function in Dereplication | Relevance to DEREPLICATOR+ |
|---|---|---|---|
| Global Natural Products Social (GNPS) | Mass Spectrometry Data Platform | Central repository for public MS/MS data and cloud computing workflows. Hosts DEREPLICATOR+ and related tools [4] [13]. | Essential platform for accessing and running the DEREPLICATOR+ workflow. |
| AllDB / AntiMarin / DNP | Chemical Structure Databases | Curated collections of known natural product structures used as reference for in silico fragmentation. DEREPLICATOR+ uses AllDB (~720K compounds) by default [2] [4]. | The source of truth for known compounds. Database breadth directly impacts dereplication success. |
| MassSpecBlocks | Web-Based Database Builder | Tool for creating custom databases of nonribosomal peptide and polyketide building block sequences for use in other software (e.g., CycloBranch) [55]. | Useful for constructing specialized, project-specific databases that could be used as a custom input for DEREPLICATOR+. |
| Cytoscape with ChemViz2 | Network Visualization Software | Used to visualize molecular networks and map DEREPLICATOR(+) annotations onto network nodes for contextual interpretation [10]. | Critical for the validation and discovery phase, allowing visualization of annotated compounds within their spectral families. |
| SIRIUS | Computational MS Suite | Provides independent molecular formula identification, fragmentation tree calculation, and CSI:FingerID for structure database matching [3]. | A key orthogonal validation tool for cross-checking high-confidence DEREPLICATOR+ annotations. |
DEREPLICATOR+ represents a paradigm shift in dereplication, evolving from a class-specific tool to a universal metabolite identification engine. Its generalized fragmentation model and integration with the GNPS ecosystem address the core challenge of modern microbial metabolomics: efficiently mining vast MS/MS datasets for both known and novel compounds. Compared to the original DEREPLICATOR, it offers a dramatic increase in scope and recall. Compared to earlier tools like iSNAP, it provides a more robust statistical framework and network-powered discovery of variants.
The future of dereplication lies in deeper integration: coupling tools like DEREPLICATOR+ with genome-mining predictions (e.g., linking a detected polyketide to a biosynthetic gene cluster) and machine learning approaches for spectral prediction will further close the gap between measurement and identification [6]. As these tools become more accessible through platforms like GNPS, they empower researchers to accelerate the discovery of next-generation microbial metabolites for drug development and beyond.
This application note details an integrated genomics and metabolomics workflow for the discovery of novel variants of known microbial metabolites, using the 16-membered macrolide antibiotic chalcomycin as a primary case study. The protocol is framed within the broader research thesis on advancing microbial metabolite identification through the DEREPLICATOR+ algorithm, a computational tool designed for the high-throughput dereplication and annotation of natural products from mass spectrometry data [2].
Chalcomycin, produced by Streptomyces bikiniensis, is a structurally distinct polyketide characterized by a 2,3-trans double bond and the neutral sugar D-chalcose at the C-5 position, unlike related macrolides which typically contain an amino sugar [56]. Its biosynthesis is governed by a polyketide synthase (PKS) gene cluster (chm) spanning over 60 kb [56]. Notably, the chm PKS lacks the ketoreductase and dehydratase domains in its seventh module necessary to form the signature 2,3-double bond, indicating this modification is introduced by discrete, separate enzymes—an unusual biosynthetic feature [56]. Chalcomycin exhibits modest antibiotic activity against Gram-positive bacteria (MIC₅₀ of 0.19 µg/mL against Staphylococcus aureus) and demonstrates unique activity against some Mycoplasma species and in inhibiting protein synthesis in mammalian HeLa cells [56].
The discovery of variants—such as differentially oxidized or acylated congeners of the parent compound—leverages the synergy between genome mining for biosynthetic gene clusters (BGCs) and tandem mass spectrometry (MS/MS) analysis of microbial extracts [57]. The DEREPLICATOR+ algorithm is central to this process, enabling the identification of known compounds and their structural analogues by searching experimental MS/MS spectra against in-silico fragmented databases of natural product structures [2] [11].
Algorithm Framework: Integrating DEREPLICATOR+ with Genome Mining
The DEREPLICATOR+ algorithm generalizes its predecessor by fragmenting molecules not only at amide bonds (for peptides) but also at O–C and C–C bonds, allowing it to identify a broad spectrum of natural product classes, including polyketides, terpenes, benzenoids, and alkaloids [4]. It constructs a theoretical fragmentation graph from a candidate chemical structure and scores its match against an experimental MS/MS spectrum [2].
For polyketides like chalcomycin, genome mining predictions provide crucial candidate structures for DEREPLICATOR+ to evaluate. Tools like Seq2PKS use machine learning to predict the chemical structures of Type I polyketides from their gene clusters [57]. Seq2PKS improves upon earlier methods by more accurately predicting acyltransferase (AT) domain specificity and module assembly order, generating a ranked list of putative structures that can be searched against MS/MS data using DEREPLICATOR+ [57]. This creates a virtuous cycle: genomic data proposes candidate structures, and metabolomic data via DEREPLICATOR+ validates or refutes these proposals, leading to confident identification of known compounds and discovery of their variants [57].
Table 1: Key Algorithmic Tools for Integrated Metabolite Discovery
| Tool Name | Primary Function | Relevance to Chalcomycin/Variant Discovery |
|---|---|---|
| DEREPLICATOR+ | In-silico database search of MS/MS spectra against structural databases [2]. | Identifies chalcomycin and its variants from Actinomyces extract spectra based on fragmentation patterns. |
| Seq2PKS | Predicts chemical structures of Type I polyketides from biosynthetic gene cluster sequences [57]. | Proposes potential variant structures from mined chm-like gene clusters for targeted MS/MS search. |
| GNPS Molecular Networking | Clusters MS/MS spectra based on similarity to visualize related metabolites [2]. | Groups spectra of chalcomycin variants, allowing annotation propagation from one identified node. |
| antiSMASH | Identifies and annotates biosynthetic gene clusters in genomic data [57]. | Initial discovery of putative polyketide synthase clusters related to chalcomycin production. |
Experimental Protocols
Protocol 1: Cultivation, Extraction, and LC-MS/MS Analysis of Actinomyces Strains
This protocol outlines the preparation of microbial samples for metabolomic analysis.
Materials:
- Bacterial Strains: Actinomyces strains (e.g., from soil or culture collections).
- Growth Media: Tryptone Soya Broth (TSB) or ISP2 medium for seed cultures; R medium (complex fermentation medium containing wheat flour, corn gluten, molasses) for production [56].
- Extraction Solvents: Ethyl acetate, methanol, dichloromethane (HPLC grade).
- Equipment: Centrifuge, rotary evaporator, ultrasonic bath, UHPLC system coupled to a high-resolution tandem mass spectrometer (e.g., Q-TOF or Orbitrap).
Procedure:
- Cultivation: Inoculate a single colony into 50 mL of TSB seed medium and incubate at 30°C with shaking (200 rpm) for 48 hours. Transfer 5 mL of the seed culture into 500 mL of R production medium in a 2 L baffled flask. Incubate at 30°C with shaking (200 rpm) for 5-7 days [56].
- Metabolite Extraction: Separate the broth from the mycelium by centrifugation (8,000 × g, 15 min, 4°C). Extract the supernatant with an equal volume of ethyl acetate (3 times). Combine the organic layers and dry over anhydrous sodium sulfate. Filter and concentrate the extract to dryness using a rotary evaporator.
- Sample Preparation: Reconstitute the dried extract in methanol to a concentration of 1 mg/mL. Filter through a 0.22 µm PTFE membrane syringe filter prior to LC-MS injection.
- LC-MS/MS Analysis:
- Chromatography: Use a reversed-phase C18 column (e.g., 2.1 x 100 mm, 1.7 µm). Employ a gradient from 5% to 100% acetonitrile in water (both with 0.1% formic acid) over 20 minutes.
- Mass Spectrometry: Acquire data in data-dependent acquisition (DDA) mode. Use a mass range of m/z 100-2000. Collision energies should be stepped (e.g., 20, 35, 50 eV) to generate comprehensive fragmentation patterns.
- Data Conversion: Convert raw instrument files to open formats (.mzML or .mzXML) using tools like MSConvert (ProteoWizard) [9].
Protocol 2: Metabolite Identification with DEREPLICATOR+ on GNPS
This protocol describes the steps to annotate metabolites from the acquired MS/MS data using the DEREPLICATOR+ web platform on the Global Natural Products Social (GNPS) site [4].
Procedure:
- Access Workflow: Log in to the GNPS website . Navigate to "Workflows" and select "DEREPLICATOR+ - Identification of Metabolites" [4].
- Upload Data: Click "Upload Files" to transfer your converted .mzML files, or select an existing dataset from your GNPS account.
- Set Parameters: Configure the job with the following key parameters [4]:
- Job Title: Provide a descriptive name.
- Precursor Ion Mass Tolerance: ±0.005 Da (for high-resolution MS1 data).
- Fragment Ion Mass Tolerance: ±0.01 Da.
- Database: Select the predefined AllDB (contains ~720,000 compounds) or upload a custom database [4].
- Fragmentation Model: Retain default (
2-1-3, allowing for multi-stage fragmentation). - Minimum Score: Set to 12 as a starting threshold for significant matches [4].
- Submit Job: Enter an email address for notification and click "Submit". Processing time varies with dataset size.
- Analyze Results: Upon completion, explore results via "View Unique Metabolites". The output lists annotated compounds, their scores, and p-values. Examine spectra matches to confirm annotations. Identified chalcomycin variants will appear with structural differences noted (e.g., mass shifts corresponding to methylation, oxidation, or glycosylation).
Protocol 3: Genomic Mining for Chalcomycin-like Biosynthetic Gene Clusters
This protocol guides the in-silico discovery of gene clusters potentially responsible for producing chalcomycin-like structures.
Materials: Draft genome sequence data of the target Actinomyces strain (in FASTA format).
Procedure:
- BGC Prediction: Run the genome sequence through the antiSMASH web server or standalone tool to identify all biosynthetic gene clusters [57].
- Cluster Analysis: From the antiSMASH results, filter for Type I Polyketide Synthase (T1PKS) clusters. Examine the domain architecture of the PKS modules, particularly looking for a signature missing KR/DH domain in a specific module (analogous to module 7 in the chm cluster) [56].
- Structure Prediction (Optional): For a prioritized T1PKS cluster, use Seq2PKS to predict the chemical structure of its potential product [57]. Input the GenBank file of the cluster region. Seq2PKS will generate a list of candidate structures.
- Integration with Metabolomics: Convert the SMILES strings of the top predicted structures from Seq2PKS into a custom database file. Use this custom database as the input for a targeted DEREPLICATOR+ search (Protocol 2, Step 3) of your experimental MS/MS data to seek direct evidence for the production of the predicted compound or its variants [57].
Data Analysis and Interpretation
Performance of DEREPLICATOR+ in Actinomyces Metabolite Discovery
Benchmarking demonstrates the superior capability of DEREPLICATOR+ in dereplicating complex microbial extracts. In a dataset of Actinomyces spectra (SpectraActiSeq, 178,635 spectra), DEREPLICATOR+ identified 488 unique compounds at a 1% False Discovery Rate (FDR), a more than six-fold increase over the original DEREPLICATOR tool, which identified only 73 [2]. At a more stringent 0% FDR, DEREPLICATOR+ identified 154 unique compounds, including peptidic natural products, lipids, terpenes, benzenoids, and crucially, polyketides [2].
Table 2: Representative Metabolite Identifications in Actinomyces Extracts via DEREPLICATOR+ (0% FDR) [2]
| Compound Class | Number of Compounds Identified | Example(s) | Key Utility |
|---|---|---|---|
| Peptidic Natural Products | 19 | Actinomycins, Thiopeptides | Antibiotic, anticancer activities |
| Polyketides (PKs) | 2 | Chalcomycin, Aureolic acids | Antibiotic, immunosuppressive |
| Terpenes | 2 | Albaflavenone, Geosmin | Antimicrobial, volatile signaling |
| Benzenoids | 1 | Dihydrochalcomycin | Structural diversity exploration |
Discovery and Characterization of Chalcomycin Variants
The application of this integrated workflow enables the discovery of variants. For instance, heterologous expression of the chm PKS in a modified Streptomyces fradiae host resulted in the production of a novel 3-keto macrolactone containing the sugar mycaminose instead of chalcose, confirming the flexibility of the post-PKS tailoring machinery [56]. Furthermore, DEREPLICATOR+ can identify such analogues directly from crude extract spectra by matching MS/MS patterns against structural databases.
The algorithm's power is amplified by molecular networking on GNPS. When DEREPLICATOR+ identifies a node in a network as chalcomycin, closely connected spectral nodes likely represent structural variants (e.g., differing in hydroxylation, glycosylation, or methylation) [2]. This allows for the annotation of an entire family of related compounds from a single confident identification.
Table 3: Key Research Reagent Solutions for Metabolite Discovery
| Item Name | Function/Description | Source/Example |
|---|---|---|
| R Medium | Complex fermentation medium for enhanced secondary metabolite production in Streptomyces [56]. | Contains wheat flour, corn gluten, molasses, soybean oil [56]. |
| Ethyl Acetate | Organic solvent for liquid-liquid extraction of medium-polarity metabolites from culture broth. | HPLC grade solvent. |
| C18 Reversed-Phase LC Column | Standard chromatography column for separating natural product mixtures prior to MS analysis. | e.g., Waters ACQUITY UPLC BEH C18. |
| AllDB Database | Curated structural database of ~720,000 compounds used as the default search space in DEREPLICATOR+ [4]. | Pre-installed in the GNPS DEREPLICATOR+ workflow. |
| AntiMarin Database | Database of known microbial natural products, useful for custom DEREPLICATOR+ searches and validation [2]. | Contains ~60,000 compounds [2]. |
| NPDtools Software Suite | Command-line toolkit containing Dereplicator+, VarQuest, and MetaMiner for advanced in-silico analysis [9]. | Available for Linux/macOS; requires Python [9]. |
Workflow and Pathway Diagrams
Diagram 1: Integrated genomics & metabolomics workflow for variant discovery.
Diagram 2: Chalcomycin biosynthesis pathway highlighting unique PKS architecture.
The discovery of microbial natural products (NPs) has undergone a paradigm shift from serendipitous, phenotype-driven isolation to a targeted, data-driven “deep-mining” approach [41]. This transition is fueled by the recognition that traditional methods overlook the vast majority of chemical diversity, as only a fraction of a microbe's biosynthetic potential is expressed under standard laboratory conditions [41]. The central challenge of modern NP research is to bridge the “genome-metabolome gap”—where typically less than 25% of predicted biosynthetic gene clusters (BGCs) are linked to known chemical products [41].
This application note, framed within the broader thesis on the DEREPLICATOR+ algorithm, details protocols for a synergistic workflow that integrates genomics and metabolomics. The core strategy involves using genome mining tools like antiSMASH to predict chemical blueprints, which are then cross-validated with high-resolution metabolomic data analyzed by DEREPLICATOR+ for rapid metabolite identification [2]. This integration creates a powerful feedback loop: genomic predictions guide metabolomic analysis, while experimental mass spectrometry (MS) data validates and refines genomic hypotheses, dramatically accelerating the dereplication of known compounds and the discovery of novel ones [12] [58].
Technological Foundations for Integration
Genome Mining: Predicting Chemical Blueprints
Genome mining involves the computational identification and analysis of BGCs in genomic sequences. Key tools have evolved to predict not only the presence of BGCs but also the structural features of their metabolites.
- antiSMASH: This is the most widely used platform for the rapid identification, annotation, and analysis of BGCs in bacterial and fungal genomes. It uses hidden Markov models (HMMs) to detect a wide array of BGC types [41] [58].
- PRISM 4: This platform extends beyond BGC detection to predict the chemical structures of encoded antibiotics, including non-ribosomal peptides (NRPs), polyketides (PKs), and other classes [59]. It connects biosynthetic genes to enzymatic reactions, enabling in silico reconstruction of pathways.
- Specialized Tools: Pipelines like DeepBGC employ machine learning (e.g., BiLSTM networks) to identify novel BGCs in under-explored taxa [41]. For ribosomally synthesized and post-translationally modified peptides (RiPPs), tools like RiPPer and RiPPquest are essential [41].
Table 1: Comparative Analysis of Primary Genome Mining Tools
| Tool | Primary Function | Key Capabilities | Key Limitation |
|---|---|---|---|
| antiSMASH | BGC detection & annotation | Identifies >40 BGC types; integrates various analysis modules [41]. | Provides limited detailed chemical structure prediction. |
| PRISM 4 | Chemical structure prediction | Predicts structures for 16 metabolite classes; models tailoring reactions [59]. | Structural uncertainty remains for some classes (e.g., glycosidic bond configuration). |
| DeepBGC | Novel BGC discovery | Uses ML to find BGCs in unexplored genomic data [41]. | Requires training data; best used complementarily with rule-based tools. |
Metabolomics and Dereplication: Identifying Chemical Realities
Metabolomics captures the actual chemical output of a microbial strain. Dereplication—the early identification of known compounds—is critical to avoid rediscovery.
- High-Resolution Mass Spectrometry (HRMS): Orbitrap, TOF, and FT-ICR MS provide the high mass accuracy and resolution needed to determine elemental formulas [41].
- DEREPLICATOR+ Algorithm: Central to this workflow, DEREPLICATOR+ enables the in silico identification of metabolites from MS/MS data. It generalizes the earlier DEREPLICATOR by fragmenting molecules not just at amide bonds (for peptides) but also at O–C and C–C bonds, allowing it to identify polyketides, terpenes, alkaloids, and other major NP classes [2] [4]. It scores matches between experimental spectra and theoretical fragmentation graphs from structure databases.
- Molecular Networking (GNPS): Platforms like the Global Natural Products Social Molecular Networking (GNPS) enable the visualization of spectral similarity, clustering related metabolites and aiding in the identification of novel analogs of known compounds [12] [2].
Experimental Workflow: From Strain to Validated Metabolite
The following integrated protocol is designed for a single bacterial isolate with a sequenced genome.
Stage 1: Genomic Analysis and Hypothesis Generation
Protocol 1.1: Genome Sequencing, Assembly, and Mining
- DNA Sequencing: Extract high-quality genomic DNA from a pure culture. Sequence using a long-read platform (e.g., PacBio HiFi) for high continuity, which is crucial for capturing complete BGCs [41].
- Genome Assembly & Annotation: Assemble reads into contigs. Annotate the genome using a standard pipeline (e.g., Prokka).
- BGC Detection with antiSMASH: Submit the assembled genome to the antiSMASH web server or run it locally. Use default parameters for a comprehensive scan [4].
- Structure Prediction with PRISM 4: For high-priority BGCs (e.g., those with low similarity to known clusters), submit the genomic region to PRISM 4 to generate predicted chemical structures [59].
- Output & Hypothesis: Generate a strain-specific BGC inventory table. For each cluster, note the type, similarity to known clusters, and predicted core structure(s). This forms the genomic hypothesis: "Strain X contains a BGC predicted to produce a compound with Y scaffold."
Stage 2: Metabolomic Analysis and Dereplication
Protocol 2.1: Metabolite Extraction and LC-HRMS/MS Analysis
- Cultivation: Grow the strain in multiple media (e.g., using OSMAC approach) to stimulate the expression of different BGCs [41].
- Extraction: Harvest culture broth. Separate supernatant and biomass. Extract metabolites from both fractions using organic solvents (e.g., ethyl acetate for supernatant, methanol for biomass). Combine extracts for analysis.
- LC-HRMS/MS Data Acquisition: Analyze extracts via reversed-phase liquid chromatography coupled to a high-resolution tandem mass spectrometer.
- MS1 Parameters: Collect data in positive and/or negative mode with a resolution of ≥ 60,000.
- MS2 Parameters: Use data-dependent acquisition (DDA) to fragment the top N most intense ions per cycle. Set a dynamic exclusion window.
Protocol 2.2: Dereplication with DEREPLICATOR+
- Data Preparation: Convert raw MS files to open formats (.mzML, .mzXML, .mgf).
- Job Submission on GNPS:
- Interpretation of Results: Review the "View Unique Metabolites" output. High-score matches (score ≥15 are high-confidence) indicate identified known compounds [2] [4]. This step rapidly clears known metabolites from the discovery pipeline.
Stage 3: Cross-Validation and Targeted Discovery
Protocol 3.1: Linking Metabolites to BGCs This is the critical synergy step.
- Match Molecular Features to Predictions: Compare the accurate mass and, when available, the DEREPLICATOR+ identification of a metabolite of interest against the PRISM 4 predicted structures from the strain's BGCs.
- Analyze Non-annotated Features: For major spectral features not identified by DEREPLICATOR+, calculate their molecular formulas. Check if the formula and isotopic pattern align with a polyketide or NRP predicted from a specific BGC.
- Use Molecular Networking: Create a molecular network of your data on GNPS. If a known compound (identified by DEREPLICATOR+) forms a network cluster with unknown molecules, these unknowns are likely structural analogs [2]. Examine if the genomic prediction for the relevant BGC suggests a plausible analog scaffold.
Protocol 3.2: Targeted Isolation for Novelty Confirmation
- Priority Target Selection: Select a metabolite for isolation where evidence from Protocols 3.1 is strong (e.g., a unique molecular formula matching a unique BGC prediction, or a novel analog in a network with a BGC-linked compound).
- Fractionation: Use guidance from the LC-MS trace to fractionate the extract via preparative HPLC.
- Structure Elucidation: Analyze pure compound using NMR and advanced MS to determine the full structure. The final step is to confirm the structure matches the genomic prediction from PRISM 4, thereby definitively linking the BGC to its product.
Integrated Genomic-Metabolomic Workflow
Data Integration and Cross-Validation Strategies
True synergy is achieved by quantitative and logical cross-validation.
Table 2: Metrics for Cross-Validating Genomic Predictions with Metabolomic Data
| Validation Aspect | Genomic Data (Prediction) | Metabolomic Data (Observation) | Cross-Validation Criteria |
|---|---|---|---|
| Molecular Formula | Calculated from PRISM 4 predicted structure [59]. | Derived from high-accuracy MS1 isotopic pattern [41]. | Exact match confirms strong link. |
| MS/MS Fragmentation | In silico fragmentation graph of predicted structure [2]. | Experimental MS/MS spectrum. | High DEREPLICATOR+ score indicates identity [2] [4]. |
| Analog Series | BGC suggests a scaffold prone to modifications (e.g., alkylation, hydroxylation). | Related molecules in a GNPS molecular network cluster [2]. | Network topology aligns with predicted biosynthetic logic. |
| BGC Expression | Presence of a specific, unique BGC. | Detection of its predicted product only under specific culture conditions. | Conditional production confirms regulatory link. |
A key strategy involves using DEREPLICATOR+ identifications as anchors. For example, if DEREPLICATOR+ identifies a known siderophore, and the genome contains the corresponding BGC, one can then examine the molecular network for unannotated clusters linked to this known compound. These may be analogs produced by the same biosynthetic machinery with variations predicted by the genomic analysis of tailoring enzymes [2].
Metabolite Prioritization Logic
The Scientist's Toolkit: Essential Research Reagents & Materials
Table 3: Key Reagents and Materials for Integrated Genomic-Metabolomic Studies
| Item | Function & Specification | Application in Protocol |
|---|---|---|
| PacBio HiFi or NanoporeSequencing Kit | Long-read sequencing for complete, high-quality genome assemblies to capture entire BGCs [41]. | Protocol 1.1: Genome Sequencing. |
| antiSMASH Database(Local Installation) | Enables high-throughput BGC detection on local servers for large-scale genomic studies [41]. | Protocol 1.1: BGC Detection. |
| Various Culture Media(e.g., R2A, ISP2, SMS Agar) | OSMAC approach: Diverse media to trigger the expression of silent or condition-specific BGCs [41] [12]. | Protocol 2.1: Cultivation. |
| Ethyl Acetate & Methanol(HPLC Grade) | Broad-spectrum organic solvents for extracting medium-polarity to polar metabolites from culture broth and biomass [12]. | Protocol 2.1: Metabolite Extraction. |
| C18 Reversed-PhaseLC Column | Standard chromatographic separation for complex natural product extracts prior to MS analysis. | Protocol 2.1: LC-HRMS/MS Analysis. |
| DEREPLICATOR+ CustomDatabase File | User-curated database of suspected or predicted compounds (e.g., from PRISM 4 output) to search against MS data [4]. | Protocol 2.2: Targeted dereplication. |
| GNPS Account | Access to the molecular networking infrastructure and the DEREPLICATOR+ workflow for cloud-based analysis [2] [4]. | Protocols 2.2 & 3.1. |
| Semi-Permeable Membranes(0.03 µm) | For constructing microbial diffusion chambers to cultivate "uncultivable" microbes from environmental samples [12]. | (Extended protocol for environmental isolation). |
The field of metabolomics, which involves the comprehensive profiling of low-molecular-weight molecules in biological systems, has emerged as a critical component of precision medicine and drug development [60]. As the functional readout of cellular processes, the metabolome provides a direct snapshot of phenotypic state, capturing the influence of genetics, environment, and disease [60]. This is particularly valuable in addressing persistent challenges in pharmaceutical research, including high clinical trial failure rates and adverse drug reactions (ADRs). Current data underscores this crisis: over 30% of compounds fail in Phase II trials, and nearly 60% fail in Phase III. Furthermore, ADRs contribute significantly to morbidity and mortality, with over 9 million reported events between 2020-2025, 7.84% of which were fatal [60].
Computational metabolomics represents the necessary evolution to harness this complex data. It applies advanced bioinformatics, artificial intelligence (AI), and machine learning (ML) to interpret vast metabolomic datasets, transforming raw spectral data into biological insight [61]. Within this framework, tools like the DEREPLICATOR+ algorithm for annotating microbial metabolites from mass spectrometry data are pioneering examples of this convergence [4]. This article details the application notes and protocols for integrating AI/ML with computational metabolomics, framed within ongoing research to advance microbial metabolite identification and its implications for therapeutic discovery.
Technical Convergence: AI and ML Paradigms in Metabolomic Analysis
The integration of AI into metabolomics is propelled by two synergistic branches: traditional predictive machine learning and generative AI. Understanding their distinct and complementary roles is essential for experimental design.
- Traditional Machine Learning excels at identifying complex, non-linear patterns within structured, high-dimensional data—a hallmark of metabolomic datasets from mass spectrometry or NMR. It is the preferred method for classification (e.g., disease vs. healthy states), regression (predicting continuous outcomes like drug response), and clustering unknown samples [62]. Its strength lies in delivering statistically robust, interpretable models from well-curated, domain-specific data.
- Generative AI and Large Language Models (LLMs), a subset of ML, introduce capabilities for reasoning, synthesis, and generation. In metabolomics, they are increasingly used for tasks such as de novo molecular structure generation, hypothesizing novel metabolic pathways, and interpreting scientific literature in context [63]. They can augment traditional ML by providing external biochemical context or generating synthetic data to overcome limitations in training datasets [62].
Table 1: Comparison of AI/ML Approaches in Metabolomics
| Aspect | Traditional/Predictive ML | Generative AI / LLMs |
|---|---|---|
| Core Function | Pattern recognition, prediction, clustering | Content creation, reasoning, data synthesis |
| Primary Use Case | Building classifiers from spectral data, biomarker discovery | Hypothesizing novel metabolites, automating literature review, explaining patterns |
| Data Dependency | Requires large, structured, domain-specific datasets | Trained on broad corpora; can work with prompts and smaller data |
| Interpretability | Often high (e.g., feature importance in random forests) | Lower, "black-box" nature; requires careful validation |
| Best for Metabolomics | Target validation, diagnostic model development, pharmacokinetic prediction | Knowledge integration, accelerating data annotation, generating research hypotheses |
This convergence is accelerating due to trends in AI itself: the rise of smaller, more efficient models reduces computational barriers, while multimodal AI systems capable of processing text, spectra, and structural data simultaneously promise more intuitive analysis platforms [63]. Furthermore, the democratization of AI through cloud-based services and AutoML platforms is making these powerful tools accessible to metabolomics researchers without deep AI expertise [63].
Protocol 1: DEREPLICATOR+ for Annotating Microbial Metabolomes
1.0 Application Note: The DEREPLICATOR+ algorithm is an in-silico tool for annotating tandem mass spectrometry (MS/MS) data of microbial metabolites, including non-ribosomal peptides, polyketides, and other natural products [4]. It generalizes earlier versions by modeling multi-stage fragmentation of O–C and C–C bonds, significantly improving annotation rates and statistical confidence for diverse metabolite classes [4]. Its integration is crucial for dereplicating known compounds and prioritizing novel chemistries in drug discovery pipelines.
1.1 Experimental Protocol: Sample Preparation for Microbial Metabolomics
Note: This protocol is adapted for challenging samples, such as microbes grown on mineral substrates [21].
- Cell Culture & Quenching: Grow microbial culture (e.g., Metallosphaera sedula) under relevant conditions. Rapidly quench metabolism using cold methanol (-40°C) or plunge freezing in liquid nitrogen.
- Metabolite Extraction:
- For microbes adherent to mineral particles, add a mixture of methanol:chloroform:water (2:2:1.8 v/v/v) directly to the culture/mineral slurry [21].
- Agitate vigorously for 20-30 minutes using a bead beater or vortex with glass beads to mechanically disrupt cells and desorb metabolites from the mineral surface.
- Centrifuge (15,000 x g, 15 min, 4°C) to pellet cell debris and minerals.
- Phase Separation & Collection: Transfer the supernatant to a new tube. The addition of chloroform and water will induce biphasic separation. Collect both the upper (aqueous, polar metabolites) and lower (organic, lipophilic metabolites) phases for comprehensive coverage [21].
- Concentration & Reconstitution: Dry collected phases under a gentle nitrogen stream. Reconstitute the dried metabolites in a solvent compatible with subsequent LC-MS analysis (e.g., 100 µL of 50% methanol).
1.2 Computational Protocol: MS/MS Analysis with DEREPLICATOR+ on GNPS
- Data Acquisition: Analyze reconstituted samples via LC-MS/MS (e.g., UHPLC-Q/TOF). Use data-dependent acquisition (DDA) to collect MS/MS spectra for precursor ions.
- Data Conversion: Convert raw instrument files (.d) to open formats (.mzML or .mzXML) using tools like MSConvert (ProteoWizard).
- GNPS Workflow Submission:
- Navigate to the Global Natural Products Social Molecular Networking (GNPS) platform and log in [4].
- Access the DEREPLICATOR+ workflow via the "In Silico Tools" page.
- Upload your .mzML file(s) or select an existing dataset.
- Parameter Configuration:
- Basic Options: Set precursor and fragment ion mass tolerances (e.g., ±0.005 Da and ±0.01 Da, respectively, for high-resolution instruments) [4].
- Advanced Options: Select the predefined database (e.g., "AllDB" containing ~720K compounds). For specialized microbial products, a custom database can be supplied. Set the fragmentation model (default "2-1-3") and a minimum match score (default 12) [4].
- Job Submission & Results: Submit the job. Upon completion, review the "Unique Metabolites" list. Annotations are sorted by score; examine high-scoring matches and their corresponding p-values. Validate annotations by inspecting the matched fragment ions between experimental and theoretical spectra.
Table 2: Key Parameters for DEREPLICATOR+ Analysis [4]
| Parameter | Recommended Setting (High-Res MS) | Function |
|---|---|---|
| Precursor Mass Tolerance | ± 0.005 Da | Window to match observed precursor m/z to database compound mass. |
| Fragment Mass Tolerance | ± 0.01 Da | Window to match observed fragment m/z to theoretical fragments. |
| Database | AllDB (default) or custom | Defines the chemical space searched for annotations. |
| Fragmentation Model | 2-1-3 (default) | Defines rules for in-silico bond cleavage and fragmentation. |
| Min. Significant Score | 12 (default) | Threshold for reporting a Metabolite-Spectrum Match (MSM). |
Diagram 1: Workflow for DEREPLICATOR+ Analysis on GNPS.
Protocol 2: Building Predictive ML Models for Pharmacometabolomics
2.0 Application Note: Pharmacometabolomics aims to predict individual responses to drugs by analyzing pre- and post-treatment metabolomes [60]. Supervised ML models are trained on labeled metabolomic data (e.g., responders vs. non-responders) to identify predictive biomarker signatures. This protocol outlines the pipeline for developing such models, crucial for patient stratification and trial design.
2.1 Experimental Protocol: Generating Training Data
- Cohort Design: Define clear phenotypic endpoints (e.g., drug efficacy score, toxicity grade). Collect biofluids (plasma, urine) from subjects before and at defined time points after drug intervention.
- Untargeted Metabolomics: Perform LC-MS/MS analysis on all samples in randomized batches to minimize technical variation.
- Data Preprocessing: Use computational tools (e.g., MZmine, XCMS) for peak picking, alignment, and integration. Normalize data (e.g., using probabilistic quotient normalization) and log-transform where appropriate. Impute missing values using methods like k-nearest neighbors.
2.2 Computational Protocol: ML Model Development & Validation
- Feature Engineering: Use the preprocessed peak intensity table. Perform feature selection to reduce dimensionality: remove low-variance features, then apply univariate statistical tests (e.g., ANOVA) or ML-based methods (Recursive Feature Elimination) to identify features associated with the outcome.
- Model Training: Split data into training (70%) and hold-out test (30%) sets. On the training set, train multiple classifiers (e.g., Random Forest, Support Vector Machine, Lasso Regression) using k-fold cross-validation (e.g., k=5) to tune hyperparameters and prevent overfitting.
- Validation & Interpretation: Apply the best-performing model to the held-out test set. Evaluate using metrics: accuracy, precision, recall, AUC-ROC. Use model-specific methods (e.g., permutation feature importance for Random Forest) to interpret the top predictive metabolites.
- Pathway Analysis: Input the top predictive metabolites into pathway analysis tools (e.g., MetaboAnalyst) to infer impacted biological pathways, generating mechanistic hypotheses.
Diagram 2: Iterative Knowledge Expansion via AI in Metabolomics.
Integrated Applications and the Scientist's Toolkit
The convergence of these protocols enables advanced applications. For instance, DEREPLICATOR+ can rapidly annotate microbial metabolites in a microbiome study, the output of which becomes the structured data for an ML model predicting host disease status. Furthermore, generative AI can interrogate the resulting biomarker list against known biochemical databases to propose previously unreported metabolic connections [62].
Table 3: The Scientist's Toolkit for AI-Driven Computational Metabolomics
| Tool Category | Example Resources | Primary Function in Workflow |
|---|---|---|
| Analytical Platforms | LC-UHR-Q/TOF MS, NMR Spectrometry [60] | Generate raw spectral metabolomics data. |
| Data Processing & Annotation | MZmine, XCMS, DEREPLICATOR+ [4], Sirius [60] | Convert raw data to peak tables, annotate metabolites. |
| Machine Learning Libraries | Scikit-learn, TensorFlow, PyTorch [64] | Build and train predictive and generative models. |
| Multi-Omics Integration | MetaboAnalyst [60] | Perform pathway analysis and integrate with other omics data. |
| Cloud & Workflow Platforms | GNPS [4], Google Colab, IBM Watsonx [64] | Provide accessible compute and pre-built workflows. |
Diagram 3: Multi-Omics Integration Pathway for AI-Driven Discovery.
Current Challenges and Future Trajectories
Despite progress, significant challenges remain. A primary issue is the integration and standardization of data across disparate studies and analytical platforms. Furthermore, the "black-box" nature of many advanced AI models necessitates ongoing development of explainable AI (XAI) techniques to build trust and provide mechanistic insight in biomedical contexts [65]. Rigorous validation of AI-generated hypotheses in wet-lab experiments is essential to close the discovery loop.
Future directions will be shaped by broader AI trends:
- Multimodal and Agentic AI: Systems that can seamlessly process spectral data, molecular structures, and scientific text will act as automated research assistants, designing experiments and iterating on hypotheses [63].
- Quantum-Inspired Computing: As datasets grow, quantum and bitnet computing paradigms promise exponential speed-ups in molecular simulations and optimization problems relevant to metabolite identification [63].
- Regulatory and Ethical Frameworks: The increase in AI-related incidents underscores the need for robust governance [65]. The development of "hallucination insurance" and adherence to frameworks like the EU AI Act will be critical for deploying AI in high-stakes drug development [63].
Investment and research are rapidly accelerating. In 2024, private AI investment in the U.S. reached $109.1 billion, with generative AI alone attracting $33.9 billion globally [65]. This funding, directed towards making AI more efficient and accessible, will directly lower the barriers to implementing the sophisticated computational metabolomics pipelines described here, ultimately accelerating the journey from microbial discovery to patient-specific therapy.
Conclusion
DEREPLICATOR+ represents a significant leap forward in computational metabolomics, effectively transforming the daunting task of dereplication into a high-throughput, statistically robust process. By enabling the rapid identification of a vast array of microbial metabolites—from peptides to polyketides and terpenes—it clears a critical path toward the discovery of truly novel natural products with therapeutic potential. Its integration within the GNPS ecosystem, coupled with molecular networking and genomic context, fosters a powerful, holistic discovery pipeline. The future of natural product research is inherently computational, and tools like DEREPLICATOR+ are pivotal. Continued development, particularly through deeper integration with artificial intelligence for structural prediction and the expansion of annotated spectral-structure databases, will further democratize and accelerate the journey from complex microbial extracts to new drug candidates and biochemical insights.
References
- 1. Advanced Methods for Natural Products Discovery: Bioactivity Screening, Dereplication, Metabolomics Profiling, Genomic Sequencing, Databases and Informatic Tools, and Structure Elucidation [https://www.mdpi.com/1660-3397/21/5/308]
- 2. Dereplication of microbial metabolites through database search of mass spectra | Nature Communications [https://www.nature.com/articles/s41467-018-06082-8]
- 3. Molecular networking: An efficient tool for discovering and ... [https://www.sciencedirect.com/science/article/abs/pii/S0731708525000822]
- 4. DEREPLICATOR+ - GNPS Documentation - GitHub Pages [https://ccms-ucsd.github.io/GNPSDocumentation/dereplicator%2B/]
- 5. High-Throughput Mining of Novel Compounds from Known ... [https://www.mdpi.com/1420-3049/29/13/3237]
- 6. Advanced Methods for Natural Products Discovery: Bioactivity ... [https://pmc.ncbi.nlm.nih.gov/articles/PMC10222211/]
- 7. Dereplication of peptidic natural products through database ... [https://pmc.ncbi.nlm.nih.gov/articles/PMC5409158/]
- 8. Evolution and Diversity of Assembly-Line Polyketide Synthases [https://pmc.ncbi.nlm.nih.gov/articles/PMC6935866/]
- 9. ablab/npdtools: Natural Product Discovery tools [https://github.com/ablab/npdtools]
- 10. DEREPLICATOR - GNPS Documentation [https://ccms-ucsd.github.io/GNPSDocumentation/dereplicator/]
- 11. Dereplication of microbial metabolites through database ... [https://www.semanticscholar.org/paper/Dereplication-of-microbial-metabolites-through-of-Mohimani-Gurevich/0bc0a7810dfe5983d3b23bdc46fb4a0c10242430]
- 12. An integrated multi-omic approach for discovery and ... [https://pmc.ncbi.nlm.nih.gov/articles/PMC12560952/]
- 13. Theoretical/Insilico Tools and Libraries [https://gnps.ucsd.edu/ProteoSAFe/static/gnps-theoretical.jsp]
- 14. Identifying variants of molecules through database search ... [https://www.nature.com/articles/s43588-025-00923-5]
- 15. Mass-spectrometry based metabolomics - PubMed Central - NIH [https://pmc.ncbi.nlm.nih.gov/articles/PMC12105183/]
- 16. Enabling pan-repository reanalysis for big data science of ... [https://www.nature.com/articles/s41467-025-60067-y]
- 17. Dereplication of microbial metabolites through database ... [https://pmc.ncbi.nlm.nih.gov/articles/PMC6168521/]
- 18. Mass Spectrometry in Metabolomics [https://biocrates.com/mass-spectrometry-in-metabolomics/]
- 19. AI redefines mass spectrometry chemicals identification [https://pmc.ncbi.nlm.nih.gov/articles/PMC12647117/]
- 20. learning mass spectrometry fragmentation of small molecules [https://pmc.ncbi.nlm.nih.gov/articles/PMC8211649/]
- 21. Improved protocol for metabolite extraction and ... [https://www.frontiersin.org/journals/microbiology/articles/10.3389/fmicb.2024.1473270/full]
- 22. Microbiome metabolite quantification methods enabling ... [https://www.sciencedirect.com/science/article/pii/S1046202323002189]
- 23. Mass Spec Algorithm Sorts Known from New Natural Product Drug... [https://www.genengnews.com/news/mass-spec-algorithm-sorts-known-from-new-natural-product-drug-candidates/]
- 24. HypoRiPPAtlas as an Atlas of hypothetical natural products ... [https://www.nature.com/articles/s41467-023-39905-4]
- 25. Artificial intelligence in microbial natural product drug discovery [https://pmc.ncbi.nlm.nih.gov/articles/PMC9931531/]
- 26. Recommendations for Reporting Metabolite Data - PMC [https://pmc.ncbi.nlm.nih.gov/articles/PMC3226225/]
- 27. Proposed minimum reporting standards for chemical ... [https://pmc.ncbi.nlm.nih.gov/articles/PMC3772505/]
- 28. A database of high-resolution MS/MS spectra for lichen ... [https://www.nature.com/articles/s41597-019-0305-1]
- 29. Trackable and scalable LC-MS metabolomics data ... [https://www.nature.com/articles/s41467-023-39889-1]
- 30. Effective data visualization strategies in untargeted ... [https://pmc.ncbi.nlm.nih.gov/articles/PMC11610048/]
- 31. Compliance with minimum information guidelines in public ... [https://www.nature.com/articles/sdata2017137]
- 32. Discovering type I cis-AT polyketides through ... [https://www.nature.com/articles/s41467-024-49587-1]
- 33. A metabologenomics strategy for rapid discovery of ... [https://pubs.rsc.org/en/content/articlehtml/2025/sc/d4sc04174g]
- 34. MS2Lipid: A Lipid Subclass Prediction Program Using ... [https://www.mdpi.com/2218-1989/14/11/602]
- 35. Optimized protocol for the identification of lipid droplet ... [https://pmc.ncbi.nlm.nih.gov/articles/PMC8190507/]
- 36. False discovery rate [https://en.wikipedia.org/wiki/False_discovery_rate]
- 37. The False Discovery Rate (FDR) – an important statistical ... [https://paasp.net/the-false-discovery-rate-fdr-an-important-statistical-concept/]
- 38. Control procedures and estimators of the false discovery rate ... [https://bmcbioinformatics.biomedcentral.com/articles/10.1186/s12859-018-2081-x]
- 39. False Discovery Rate [https://www.publichealth.columbia.edu/research/population-health-methods/false-discovery-rate]
- 40. Beware of counter-intuitive levels of false discoveries in ... [https://pmc.ncbi.nlm.nih.gov/articles/PMC12359981/]
- 41. The Deep Mining Era: Genomic, Metabolomic, and Integrative ... [https://pmc.ncbi.nlm.nih.gov/articles/PMC12299652/]
- 42. Advances in decomposing complex metabolite mixtures ... [https://www.sciencedirect.com/org/science/article/pii/S0265056822008807]
- 43. MiMeDB [https://mimedb.org/]
- 44. Web Servers and Databases [https://www.wishartlab.com/web_servers]
- 45. Metabolomics and dereplication strategies in natural ... [https://pubmed.ncbi.nlm.nih.gov/23963915/]
- 46. Analysis of plant metabolomics data using identification‐free ... [https://pmc.ncbi.nlm.nih.gov/articles/PMC12319716/]
- 47. Propagating annotations of molecular networks using in ... [https://pmc.ncbi.nlm.nih.gov/articles/PMC5927460/]
- 48. MS2LDA and MotifDB Substructure Discovery - GNPS ... [https://ccms-ucsd.github.io/GNPSDocumentation/ms2lda/]
- 49. Network Annotation Propagation (NAP) - GNPS Documentation [https://ccms-ucsd.github.io/GNPSDocumentation/nap/]
- 50. MS2LDA - [https://www.ms2lda.org/user_guide/]
- 51. Quick Start Guide - GNPS Documentation [https://gnpsdocs.readthedocs.io/en/latest/quickstart/]
- 52. New algorithm efficiently finds antibiotic candidates | ScienceDaily [https://www.sciencedaily.com/releases/2018/10/181002155250.htm]
- 53. Dereplicating nonribosomal peptides using an informatic ... [https://pmc.ncbi.nlm.nih.gov/articles/PMC3511102/]
- 54. lfnothias/dereplicator_plus_evaluation [https://github.com/lfnothias/dereplicator_plus_evaluation]
- 55. MassSpecBlocks: a web-based tool to create building blocks ... [https://jcheminf.biomedcentral.com/articles/10.1186/s13321-021-00530-2]
- 56. Chalcomycin Biosynthesis Gene Cluster from ... [https://pmc.ncbi.nlm.nih.gov/articles/PMC529187/]
- 57. Discovering type I cis-AT polyketides through ... [https://pmc.ncbi.nlm.nih.gov/articles/PMC11199612/]
- 58. Integrating genomics and metabolomics for scalable non- ... [https://www.nature.com/articles/s41467-021-23502-4]
- 59. Comprehensive prediction of secondary metabolite ... [https://www.nature.com/articles/s41467-020-19986-1]
- 60. Metabolomics and Pharmacometabolomics - PubMed Central [https://pmc.ncbi.nlm.nih.gov/articles/PMC12654014/]
- 61. A comprehensive review on computational metabolomics [https://www.sciencedirect.com/science/article/pii/S2001037025002806]
- 62. Machine learning and generative AI: What are they good ... [https://mitsloan.mit.edu/ideas-made-to-matter/machine-learning-and-generative-ai-what-are-they-good-for]
- 63. The future of AI: trends shaping the next 10 years [https://www.ibm.com/think/insights/artificial-intelligence-future]
- 64. The 2025 Guide to Machine Learning [https://www.ibm.com/think/machine-learning]
- 65. The 2025 AI Index Report | Stanford HAI [https://hai.stanford.edu/ai-index/2025-ai-index-report]