The Three Pillars of Natural Product Dereplication: Integrating Taxonomy, Spectroscopy, and Structures for Efficient Discovery
This article provides a comprehensive guide to the three pillars of natural product dereplication—biological taxonomy, spectroscopic signatures, and molecular structures—targeted at researchers, scientists, and drug development professionals.
The Three Pillars of Natural Product Dereplication: Integrating Taxonomy, Spectroscopy, and Structures for Efficient Discovery
Abstract
This article provides a comprehensive guide to the three pillars of natural product dereplication—biological taxonomy, spectroscopic signatures, and molecular structures—targeted at researchers, scientists, and drug development professionals. It explores foundational concepts, methodological applications, troubleshooting strategies, and validation techniques, covering workflows from database utilization to advanced analytical tools like NMR and MS, with the aim of accelerating drug discovery from natural sources.
Laying the Groundwork: Understanding the Core Pillars of Dereplication
Defining Natural Product Dereplication and Its Critical Role in Drug Discovery
The rediscovery of known compounds has historically been a significant and costly bottleneck in natural product (NP) research, consuming valuable time and resources in the isolation and re-elucidation of already characterized molecules [1]. Dereplication, defined as the rapid identification of previously reported compounds within a complex mixture, has thus emerged as a critical, upfront strategy to streamline the discovery pipeline [2]. Its primary role is to triage extracts, allowing researchers to focus efforts and resources on truly novel chemistry with the potential for new bioactivity.
This process is fundamentally framed within the three-pillar paradigm of dereplication, which integrates: 1) the biological taxonomy of the source organism, 2) the spectroscopic and spectrometric signatures of metabolites, and 3) comprehensive databases of known molecular structures [3]. The convergence of these pillars enables a probabilistic and efficient filtering strategy, moving from the broad universe of all known NPs to a much smaller, taxonomically informed candidate list that can be matched against analytical data. This guide provides an in-depth technical examination of dereplication methodologies, experimental protocols, and essential tools, underscoring its indispensable function in accelerating the discovery of new therapeutic leads from nature.
The Conceptual Foundation: The Three Pillars of Dereplication
Effective dereplication is not reliant on a single technique but on the strategic integration of three core informational domains. The interdependence of these pillars creates a robust framework for efficient compound identification.
- Taxonomy (The Biological Context): The taxonomic classification of the source organism provides a powerful first filter. Secondary metabolism is genetically encoded, meaning phylogenetically related organisms often produce structurally similar or identical specialized metabolites [3]. Restricting initial database searches to compounds reported from the same genus or family dramatically reduces the number of candidate structures, increasing the speed and confidence of identification [4].
- Spectroscopy (The Analytical Fingerprint): This pillar encompasses the empirical data used for direct comparison, primarily from mass spectrometry (MS) and nuclear magnetic resonance (NMR) spectroscopy. High-Resolution MS (HRMS) delivers exact molecular formulas, while tandem MS (MS/MS) provides fragmentation patterns indicative of structural motifs [1]. NMR, particularly ¹³C NMR, offers highly specific structural information about the carbon skeleton, with chemical shifts that are predictable and less susceptible to solvent effects than ¹H NMR [4].
- Structures (The Reference Library): This pillar consists of the curated databases linking chemical structures to taxonomic origin and, ideally, to associated spectroscopic data. The utility of dereplication is directly proportional to the comprehensiveness and accuracy of these databases. Key resources include the fully open-source LOTUS database, which explicitly links structures to taxonomy, and COCONUT, a large collection of unique NP structures [4] [3]. The absence of experimental spectra in many databases is increasingly mitigated by the use of in-silico prediction tools for NMR and MS/MS data [4].
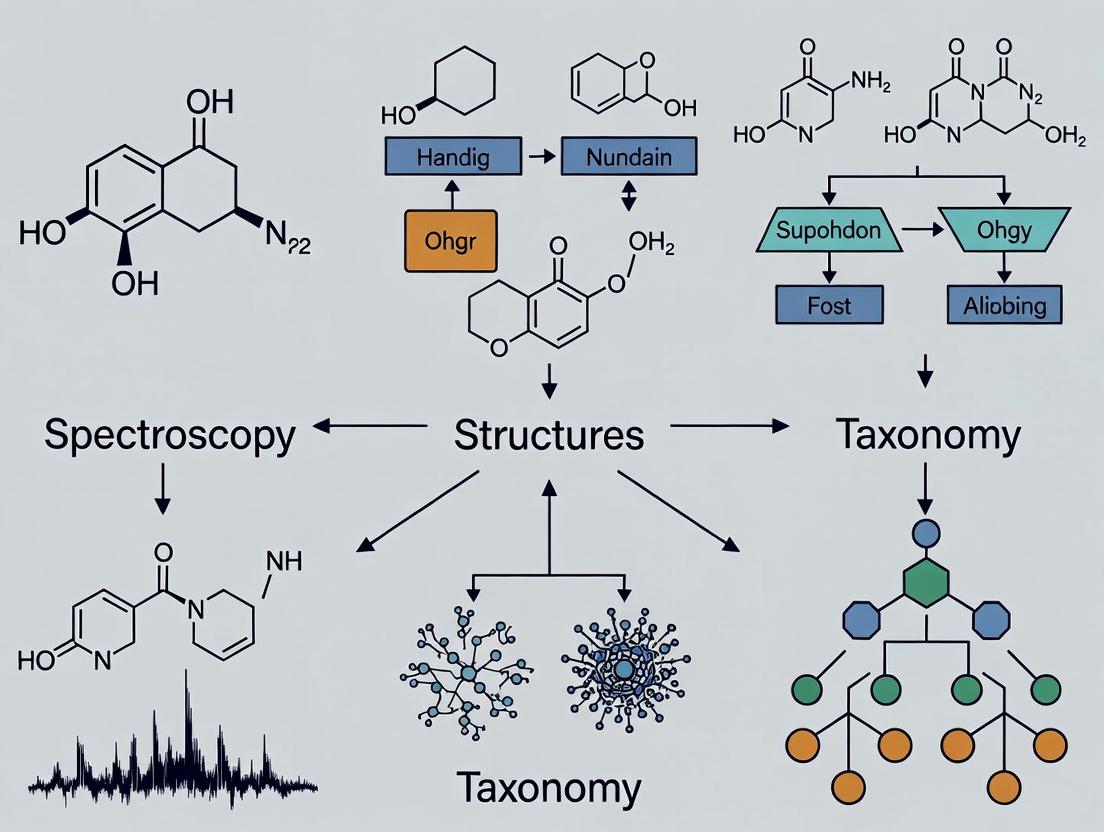
The following diagram illustrates how these three pillars interact within a dereplication workflow, guiding the process from a raw extract to a confident compound annotation.
Diagram 1: The Three-Pillar Dereplication Workflow Logic. This diagram shows how taxonomy filters the structural database to create a candidate list, which is then matched against experimental spectroscopic data for identification.
Core Analytical Methodologies and Protocols
Modern dereplication employs hyphenated analytical techniques that separate complex mixtures and provide rich spectroscopic data for component identification.
Liquid Chromatography-High Resolution Tandem Mass Spectrometry (LC-HRMS/MS)
LC-HRMS/MS is the cornerstone of high-throughput dereplication, enabling the profiling of hundreds of compounds in a single analysis.
Experimental Protocol: Building an In-House MS/MS Library for Dereplication [1]
- Standard Pooling: Select analytical standards of target compound classes. Group standards into pools based on log P values and exact masses to minimize co-elution and isomer interference during LC-MS analysis.
- LC-HRMS/MS Analysis:
- Chromatography: Use a C18 reversed-phase column. Employ a gradient elution with water (with 0.1% formic acid) and acetonitrile as mobile phases.
- Mass Spectrometry: Operate in positive electrospray ionization (ESI+) mode. Acquire HRMS data for accurate mass.
- MS/MS Acquisition: For each pool, acquire MS/MS spectra using both [M+H]⁺ and [M+Na]⁺ adducts. Use a data-dependent acquisition (DDA) method, fragmenting the top ions at multiple collision energies (e.g., 10, 20, 30, 40 eV) to capture comprehensive fragmentation patterns.
- Library Construction: Process data to extract for each compound: name, molecular formula, exact mass, retention time, and all associated MS/MS spectra. Compile into a searchable library format.
- Dereplication Application: Analyze crude extracts under identical LC-MS conditions. Use the library to search for matches based on retention time, exact mass (error < 5 ppm), and MS/MS spectral similarity.
Advanced Strategy: Molecular Networking Molecular networking (MN) on platforms like Global Natural Products Social (GNPS) is a powerful untargeted extension of MS/MS dereplication [5]. It visualizes relationships between compounds in an extract based on spectral similarity, clustering analogs and known compounds together. This allows for the annotation of entire compound families based on the annotation of a single node in the network and prioritizes unique clusters for novel chemistry [2] [5].
Nuclear Magnetic Resonance (NMR) Spectroscopy and Database Creation
While less sensitive than MS, NMR provides highly definitive structural information, making it crucial for final confirmation. ¹³C NMR is particularly valuable for dereplication due to its wide spectral dispersion and predictable chemical shifts [4].
Experimental Protocol: Creating a Taxon-Specific ¹³C NMR Database [4] This protocol details the creation of a focused database for a specific organism (e.g., Brassica rapa).
- Structure Retrieval: Query the LOTUS database using the organism's scientific name. Download all associated chemical structures in SDF format.
- Structure Curation: Use Python scripts (e.g., RDKit) to clean the structure file:
- Remove duplicate entries.
- Correct tautomeric forms (e.g., convert iminols to amides).
- Standardize atom valence representations for compatibility with prediction software.
- Chemical Shift Prediction: Import the curated SDF file into a prediction software (e.g., ACD/Labs CNMR Predictor). Batch-calculate the ¹³C NMR chemical shifts for every structure in the library.
- Database Deployment: Export the structures and their predicted shifts into a dedicated, searchable database (e.g., as an SDF file with chemical shift tags). This taxon-focused database can now be used to rapidly search experimental ¹³C NMR data from a purified compound or fraction.
Integrated and Bioactivity-Guided Workflows
Cutting-edge approaches combine chemical analysis with biological screening to dereplicate specifically the bioactive constituents.
Protocol: Integrated Online DPPH-Assisted Dereplication [6] This workflow identifies antioxidant compounds directly in mixtures.
- Fractionation: First, fractionate the crude extract using Centrifugal Partition Chromatography (CPC) to reduce complexity.
- Online Bioactivity Screening: Subject CPC fractions to LC-MS analysis where the effluent is split. One stream goes to the MS, the other passes through a reaction coil containing the stable radical DPPH•. A UV detector monitors the DPPH• bleaching, indicating radical-scavenging activity.
- Correlated Analysis: The MS data (retention time, MS/MS spectrum) of a peak is directly correlated with a dip in the DPPH• trace, pinpointing the exact compound responsible for antioxidant activity.
- Confidence Annotation: Use tools like CATHEDRAL to integrate the HRMS/MS data and any available NMR data, assigning a confidence level to the annotation of the active compound [6].
The table below summarizes quantitative performance data from recent dereplication studies employing these methodologies.
Table 1: Performance Metrics from Recent Dereplication Studies
| Study Focus | Methodology | Sample/Organism | Key Outcome | Reference |
|---|---|---|---|---|
| MS/MS Library Development | LC-HRMS/MS, in-house library | 31 standard phytochemicals | Library enabled dereplication in 15 food/plant extracts with <5 ppm mass error. | [1] |
| Molecular Networking | LC-MS/MS, GNPS-based MN | Sophora flavescens root extract | 51 compounds annotated; DIA and DDA data were complementary. | [5] |
| Bioactivity-Guided | Online DPPH, LC-HRMS/MS, NMR | Makwaen pepper by-product | 50 antioxidant compounds identified, 10 first reports for the genus. | [6] |
| NMR Database Creation | LOTUS + ¹³C NMR prediction | Brassica rapa (Turnip) | Created a taxon-specific DB with predicted shifts for 120 compounds. | [4] |
Successful dereplication relies on a combination of physical reagents, software, and data resources.
Table 2: Key Research Reagent Solutions for Dereplication
| Category | Item/Resource | Function in Dereplication |
|---|---|---|
| Chromatography & Separation | C18 Reversed-Phase U/HPLC Columns | High-resolution separation of complex natural extracts prior to MS or NMR detection. |
| Centrifugal Partition Chromatography (CPC) | Solvent-based fractionation technique for gentle, high-capacity separation of crude extracts [6]. | |
| Mass Spectrometry | High-Resolution Mass Spectrometer (Q-TOF, Orbitrap) | Provides exact mass measurement for molecular formula determination (<5 ppm error is standard) [1]. |
| Analytical Standards (e.g., flavonoid, alkaloid libraries) | Used to build in-house MS/MS spectral libraries for targeted dereplication [1]. | |
| Nuclear Magnetic Resonance | Deuterated Solvents (CD₃OD, DMSO-d₆) | Required for acquiring NMR spectra; provides a deuterium lock and minimal interfering signals. |
| NMR Prediction Software (e.g., ACD/Labs CNMR Predictor) | Generates predicted ¹³C NMR chemical shifts for database creation when experimental data is absent [4]. | |
| Bioactivity Screening | DPPH (2,2-Diphenyl-1-picrylhydrazyl) | Stable radical used in online or offline assays to detect antioxidant compounds directly in LC effluents [6]. |
| Data Analysis & Databases | GNPS (Global Natural Products Social) | Web-based platform for mass spectrometry data sharing, molecular networking, and library searches [5]. |
| LOTUS Database (lotus.naturalproducts.net) | Open-source database linking NP structures to taxonomic origin, essential for taxon-focused searches [4]. | |
| RDKit Cheminformatics Toolkit | Open-source software for manipulating chemical structures (e.g., standardization, tautomer correction) during database curation [4]. | |
| MZmine / MS-DIAL | Open-source software for processing LC-MS data, including feature detection, alignment, and export for GNPS [5]. |
Natural product dereplication has evolved from a simple avoidance tactic into a sophisticated, integrated discipline that is the critical gatekeeper of efficiency in drug discovery. By systematically applying the three-pillar framework—leveraging taxonomy, spectroscopy, and structural databases—researchers can swiftly discard known entities and concentrate resources on promising novel leads.
The future of dereplication lies in deeper automation and artificial intelligence. Machine learning models are being trained to predict MS/MS spectra and NMR shifts with greater accuracy, while also mining genomic data to predict biosynthetic pathways and their products [2]. The continued expansion and open sharing of curated, high-quality spectral databases will be paramount. Furthermore, the tight integration of bioactivity screening with real-time chemical analysis, as seen in online assays, will make dereplication not just about identity, but also about function, ensuring that the novel compounds prioritized are also biologically relevant. In this way, dereplication remains the essential engine that powers the sustainable and rational discovery of new medicines from nature's vast chemical repertoire.
1. Introduction: The Imperative of Dereplication in Natural Product Research
The investigation of natural products (NPs) for drug discovery and chemical innovation is fundamentally constrained by the challenge of redundancy. A significant proportion of bioactivity detected in crude extracts originates from already known compounds. Dereplication—the rapid identification of known entities—is therefore a critical, efficiency-driven discipline designed to prevent the costly re-isolation and re-elucidation of reported molecules [7]. Its successful execution hinges on the integrative use of three core informational pillars: the biological taxonomy of the source organism, the spectroscopic signatures of the compound, and its definitive molecular structure [7]. This guide details the theoretical framework, modern methodologies, and practical tools that unite these pillars into a powerful strategy for accelerating natural product research.
2. Foundational Theory: Interdependence of the Three Pillars
The three pillars are not merely parallel data streams but are deeply interconnected, forming a convergent logic system for identification.
- Taxonomy as a Prior Probability Filter: The evolutionary principle of biosynthetic pathway conservation implies that taxonomically related organisms are more likely to produce chemically similar secondary metabolites [7]. Thus, taxonomy constrains the vast chemical search space (estimated at >400,000 known NPs) to a much smaller, phylogenetically relevant subset, dramatically increasing the odds of correct dereplication [7].
- Spectroscopy as the Empirical Interrogator: Spectroscopic techniques provide the physical data against which candidate structures are matched. NMR and MS are paramount, delivering atomic-level (NMR) and molecular/formula-level (MS) information [7]. The reliability of dereplication scales with the specificity of the spectral data, from molecular formula to full (^{13})C NMR shifts or MS/MS fragmentation patterns.
- Molecular Structure as the Unifying Identifier: The structure is the ultimate endpoint, the unique identifier that connects taxonomic origin (what produces it) to spectroscopic manifestation (how it is detected). Robust structural representation formats (InChI, SMILES, SDF) and their accurate linkage to taxonomic and spectral data in databases are the bedrock of computational dereplication [7].
The synergy is clear: Taxonomy directs the where to look, spectroscopy provides the what to look for, and the molecular structure is the final answer.
3. Quantitative Landscape: Databases and Spectroscopic Metrics
The efficacy of dereplication is quantifiably linked to the scope and quality of underlying databases and the performance metrics of spectroscopic techniques.
Table 1: Key Databases for Natural Product Dereplication
| Database Name | Primary Focus (Pillar) | Key Features & Scope | Utility in Dereplication |
|---|---|---|---|
| LOTUS [4] | Taxonomy-Structure Linkage | Fully open-source; connects ~400k NP structures to organism taxonomy and literature [4]. | Enables creation of taxon-specific candidate lists for targeted searches. |
| COCONUT [7] | Molecular Structure | Large, curated collection of NP structures compiled from multiple sources. | Provides a comprehensive structural reference space. |
| ACD/Lotus & nmrshiftdb2 [8] | Spectroscopy-Structure (NMR) | Combines LOTUS taxonomy with predicted/experimental (^{13})C NMR spectra. ACD/Lotus uses commercial prediction; nmrshiftdb2 is open-access [8]. | Direct spectral searching against a taxonomically informed NMR database. |
| GNPS [7] | Spectroscopy-Structure (MS) | Public platform for MS/MS spectral library matching and molecular networking. | Untargeted metabolite identification via crowd-sourced spectral libraries. |
Table 2: Performance Metrics of Core Spectroscopic Techniques
| Technique | Key Measurable Data | Typical Dereplication Power | Limitations / Notes |
|---|---|---|---|
| High-Resolution MS | Exact mass, Molecular Formula | High-confidence formula assignment. Distinguishes isomers poorly. | Foundation for all further MS-based steps [9]. |
| MS/MS (Tandem MS) | Fragmentation Pattern | High. Library match scores (e.g., cosine score) quantify similarity. | Depends on library coverage; patterns can be instrument-dependent [9]. |
| (^{1})H NMR | Chemical Shift, Coupling, Integration | High for simple mixtures. Susceptible to solvent and pH effects. | Rapid analysis but signals may overlap in complex extracts [7]. |
| (^{13})C NMR | Chemical Shift (typically 0-250 ppm) | Very High. Direct structure fingerprint; 1 signal per C atom. | Lower sensitivity; often requires isolation or enrichment [4] [7]. |
| SERS with ML [10] | Vibrational Fingerprint | >90% accuracy reported for epimer differentiation [10]. | Requires specific substrate/functionalization; emerging technique. |
Table 3: Comparative Analysis of Dereplication Workflows
| Workflow Name/Type | Core Input Data | Search Space Constraint Method | Reported Outcome |
|---|---|---|---|
| Taxonomy-Focused (^{13})C NMR DB [4] [8] | Experimental (^{13})C NMR shifts of isolate/mixture | Pre-filtered database of NPs from a specific taxon (e.g., genus Brassica). | Efficient retrieval of known structures from the target organism group. |
| Forward-Predictive SERS Taxonomy [10] | SERS spectrum of an unknown epimer | Hierarchical ML model deduces structural features (e.g., sugar type, chain length) stepwise. | Untargeted identification and quantification with <10% error for cerebrosides [10]. |
| Multiplexed Chemical Metabolomics (MCheM) [11] | LC-MS/MS data + functional group reactivity | Online derivatization (e.g., with AQC, L-cysteine) predicts functional groups to filter CSI:FingerID results. | Improved Top-1 annotation for 15-49% of test molecules; guided novel NP discovery [11]. |
4. Experimental Protocols
Protocol 1: Constructing a Taxonomy-Focused (^{13})C NMR Database for Dereplication
- Objective: To create a custom database of predicted (^{13})C NMR spectra for all NPs reported from a specific taxon.
- Materials: LOTUS database access; ACD/Labs CNMR Predictor and DB software (or alternative); Python environment with RDKit.
- Method:
- Taxon-Specific Structure Retrieval: Query the LOTUS database using the organism's scientific name (e.g., Brassica rapa) and download the resulting structures in SDF format [4].
- Structure Curation: Use Python scripts (e.g.,
uniqInChI.py) to remove duplicate structures. Correct common tautomeric misrepresentations (e.g., iminol to amide) using a tool liketautomer.py[4]. - Spectral Prediction: Import the curated SDF file into ACD/Labs CNMR Predictor. Batch-predict (^{13})C NMR chemical shifts for all structures using the built-in function. Export the combined structure-spectra data as a new, searchable database file (e.g.,
.NMRUDB) [4]. - Deployment: Use this custom database within the NMR prediction software's search module. Query it with experimental (^{13})C NMR shift lists from new isolates of the target taxon for rapid identification [4] [8].
Protocol 2: SERS-Based Hierarchical Chemical Taxonomy for Epimer Identification
- Objective: To differentiate and quantify structurally similar epimers (e.g., GlcCer vs. GalCer) without pure standards.
- Materials: Ag nanocube SERS substrate; 4-mercaptophenylboronic acid (4-MPBA); hydrophobic perfluorothiol-Ag concentrating substrate; Target epimers.
- Method:
- Selective Capture: Functionalize the Ag SERS substrate with 4-MPBA, which covalently binds to the 1,2-diol group on the epimers at their site of isomerism [10].
- Signal Amplification: Concentrate the formed epimer-MPBA adducts on a hydrophobic secondary substrate to enhance the SERS signal [10].
- Spectral Acquisition & Feature Engineering: Acquire SERS spectra for all target epimers. Extract specific features (peak position, intensity, width, skew) corresponding to five hierarchical structural categories: 1) presence of epimer, 2) monosaccharide vs. cerebroside, 3) ceramide saturation, 4) glucosyl vs. galactosyl, 5) carbon chain length [10].
- Machine Learning Classification: Train a cascading machine learning model (e.g., four Random Forest classifiers followed by SVM regressors) using the engineered spectral features. Each model level predicts one of the hierarchical structural categories [10].
- Prediction: Input the SERS spectrum of an unknown epimer. The hierarchical model sequentially predicts its structural attributes, ultimately reconstructing its full identity and enabling quantification [10].
5. Visualizing the Workflow and Hierarchical Logic
The following diagrams illustrate the integrated dereplication process and the logical flow of a hierarchical identification model.
Diagram 1: The Integrated Three-Pillar Dereplication Workflow (75 chars)
Diagram 2: Hierarchical ML Model for SERS Chemical Taxonomy (75 chars)
6. The Scientist's Toolkit: Essential Research Reagent Solutions
| Category | Item / Reagent | Function in Dereplication | Key Reference |
|---|---|---|---|
| Database & Software | LOTUS Database | Provides the essential taxonomic-structural relationship data to build focused libraries. | [4] |
| ACD/Labs CNMR Predictor | Generates high-accuracy predicted (^{13})C NMR spectra for database creation and shift verification. | [4] [8] | |
| RDKit (Python) | Enables cheminformatic curation of structure files (deduplication, tautomer correction). | [4] | |
| SIRIUS Software | Performs molecular formula identification (via isotope pattern) and MS/MS fragmentation analysis. | [11] | |
| SERS Analysis | 4-Mercaptophenylboronic Acid (4-MPBA) | SERS probe that selectively captures diol-containing analytes, creating diagnostic adduct spectra. | [10] |
| Ag Nanocube Substrate | Provides high surface enhancement for Raman signal amplification. | [10] | |
| Functional Group Labeling | 6-Aminoquinolyl-N-hydroxysuccinimidyl Carbamate (AQC) | Online derivatization reagent that labels amine/phenol groups, revealing their presence via MS mass shift. | [11] |
| L-Cysteine | Online derivatization reagent that reacts with electrophilic groups (e.g., β-lactones), constraining possible structures. | [11] |
7. Conclusion: Synthesis and Future Directions
The triad of taxonomy, spectroscopy, and molecular structures forms an indispensable, synergistic framework for modern natural product dereplication. The field is evolving from simple library matching toward predictive and intelligence-driven workflows. The integration of machine learning with spectroscopic techniques (as seen in SERS taxonomy) [10] and the use of chemical reactivity to constrain structural space (as in MCheM) [11] represent the vanguard. These approaches increasingly handle the "unknown unknowns" by deducing structural features de novo, moving beyond the limitations of static libraries. Future advancements will likely involve deeper integration of genomic data (biosynthetic gene clusters) as a fourth informing pillar, further closing the loop between an organism's genetic potential and its expressed chemical identity. For researchers, mastering the interplay of the three pillars, and leveraging the tools and databases that embody them, is fundamental to achieving efficiency and discovery in natural product science.
The Historical Evolution and Rationale Behind the Pillars
The renaissance of natural products (NP) as a critical source for new drug leads has been fundamentally enabled by the development of efficient dereplication strategies [9]. Dereplication—the rapid identification of known compounds within complex biological extracts—prevents the costly and time-consuming re-isolation and re-elucidation of previously characterized molecules, thereby streamlining the discovery pipeline [4]. This field's evolution is anchored in three interconnected pillars: Taxonomic Classification, Advanced Spectroscopy, and Structural Databases. Together, these pillars form a cohesive framework that transforms raw chemical data into actionable biological knowledge [9]. The integration of these domains is not merely operational but conceptual, providing a robust taxonomy for NP research that enhances reproducibility, accelerates discovery, and bridges the gap between chemical analysis and therapeutic application [12].
This article delineates the historical evolution and scientific rationale of these three pillars, framing them within the broader thesis that a tripartite, integrated approach is indispensable for modern NP research. We provide a technical examination of core methodologies, supported by quantitative data, detailed experimental protocols, and specialized visualization, tailored for researchers and drug development professionals engaged in the search for novel bioactive entities.
Historical Evolution of the Dereplication Framework
The dereplication landscape has evolved from a labor-intensive, discipline-siloed process to an integrated, informatics-driven science. Historically, NP discovery relied on bioactivity-guided fractionation coupled with structure elucidation using classical spectroscopic methods, a process often leading to the "rediscovery" of common metabolites [9]. The first major shift began with the digitization of chemical data. Early databases were simple compilations of structures and sources, but the need for cross-referenced information soon became apparent [4].
The advent of hyphenated analytical techniques, such as Liquid Chromatography-Mass Spectrometry (LC-MS), in the late 20th century provided the second catalyst for change. This allowed for the partial characterization of compounds directly in complex mixtures [9]. However, the true transformation commenced with the conceptual integration of biological context (taxonomy) with chemical and spectroscopic data. This recognized that the metabolic profile of an organism is a product of its evolutionary history, implying that related taxa are more likely to produce structurally related NPs [4]. This principle provided the logical basis for integrating taxonomy as a filtering and prioritization layer in dereplication.
Concurrently, the proliferation of public spectral libraries and the development of reliable in-silico spectral prediction tools for both MS and NMR data allowed researchers to compare experimental results against vast virtual libraries [9] [4]. The most recent evolutionary phase is characterized by the rise of collaborative, open-data platforms like the Global Natural Products Social Molecular Networking (GNPS), which leverage crowd-sourced data and network algorithms to visualize chemical space and identify novel compounds [9]. This historical arc demonstrates a clear trajectory toward deeper integration of the three pillars: using taxonomy to define a search space, spectroscopy to generate chemical descriptors, and curated databases to map those descriptors to known or predicted structures.
The Three Pillars: Rationale, Function, and Synergy
The efficacy of modern dereplication is predicated on the strength and interdependence of three foundational pillars.
Pillar 1: Taxonomic Classification
Taxonomy provides the biological context for chemical discovery. The rationale is rooted in chemotaxonomy—the observation that evolutionary relationships correlate with biosynthetic pathways and secondary metabolite production [4]. By defining the biological source (e.g., species, genus, family), researchers can constrain the vast universe of possible chemical structures to a more manageable subset associated with that taxon and its relatives. This significantly reduces false positives during database searching. For instance, a novel antifungal compound from a Penicillium species is more likely structurally related to other fungal metabolites than to algal terpenes. Modern taxonomy-focused databases like LOTUS directly link organism classification to reported metabolites, enabling this targeted filtering [4].
Pillar 2: Analytical Spectroscopy
Spectroscopy provides the unambiguous chemical descriptors of the sample. Mass Spectrometry (MS), particularly high-resolution MS (HRMS), delivers exact molecular mass and formula, along with fragmentation patterns that serve as a "fingerprint" of molecular structure [9]. Nuclear Magnetic Resonance (NMR) spectroscopy, especially 13C NMR, offers complementary, information-rich data on the carbon skeleton and functional groups, with high predictability and low susceptibility to solvent effects, making it ideal for database matching [4]. The synergy between MS (high sensitivity, mixture analysis) and NMR (high structural resolution) is paramount for confident identification.
Pillar 3: Integrated Structural & Spectral Databases
Databases serve as the collective memory and reference standard of the field. They integrate and curate data from the first two pillars: chemical structures, taxonomic origins, and associated spectroscopic signatures (both experimental and predicted) [9]. The power of this pillar lies in its searchability and interconnectivity. A dereplication workflow queries the spectral and chromatographic data of an unknown against these databases to find matches. The integration of predicted data, such as in-silico 13C NMR shifts, dramatically expands the coverage of these databases beyond compounds with fully published experimental spectra [4].
Table 1: Key Dereplication Databases and Their Characteristics
| Database Name | Primary Data Type | Notable Feature | Taxonomic Focus | Reference |
|---|---|---|---|---|
| LOTUS | Structures, Taxonomy | Links ~700k NPs to organism taxonomy; open-source | Comprehensive | [4] |
| GNPS | MS/MS Spectra | Crowd-sourced spectral library; molecular networking | Comprehensive | [9] |
| COCONUT | Structures | Aggregated collection from multiple NP DBs | Comprehensive | [4] |
| KNApSAcK | Structures, Taxonomy | Links species, metabolites, and biological activities | Comprehensive | [4] |
The synergistic interaction of these pillars creates a logical funnel. Taxonomy narrows the search space, spectroscopy generates precise query data, and integrated databases enable the final matching or annotation. This tripartite system mirrors structured cognitive frameworks used in other scientific fields, such as the Triple Taxonomy Technique (TTT) in medical education, which segments learning into recall, interpretation, and problem-solving to optimize outcomes [12]. Similarly, dereplication uses taxonomy (context recall), spectroscopy (data interpretation), and database mining (identification problem-solving).
Quantitative Analysis of Integrated Workflow Efficacy
The impact of integrating the three pillars is quantifiable in terms of efficiency gains and accuracy improvements. A study on educational methodology using a Triple Taxonomy Technique (TTT)—a relevant analog for structured, multi-stage processes—demonstrated high effectiveness when a tri-level approach was employed [12].
Table 2: Effectiveness Assessment of a Structured Tri-Level Methodology (Analogous to Integrated Dereplication)
| Metric | Result | Implication for Dereplication Workflow |
|---|---|---|
| Agreement on Method Effectiveness | 92.5% (474 of 512 participants) | Validates the user acceptance and perceived utility of a structured, multi-stage framework. |
| Neutral or Disagreeing Response | 7.5% (38 of 512 participants) | Highlights a minority where the method may not fit or requires optimization. |
| Primary Strengths Identified | Enhanced data interpretation, analysis, decision-making, and problem-solving. | Directly correlates to the dereplication goals of accurate spectral interpretation and confident identification. |
In a technical context, the creation of a taxonomy-focused 13C NMR database for Brassica rapa using the CNMR_Predict workflow illustrates efficiency. Starting from 121 unique structures sourced from the LOTUS database (Pillar 1 and 3), the automated prediction and database creation process (leveraging Pillar 2 data) enables rapid future dereplication of compounds from this taxon [4]. This eliminates the need for manual literature searching and data entry for each candidate structure.
Detailed Experimental Protocols
Protocol 1: Creating a Taxonomy-Focused NMR Database for Dereplication
This protocol, based on the CNMR_Predict workflow, details the construction of a specialized database for dereplicating compounds from a specific organism or taxon using predicted 13C NMR data [4].
Define Taxon & Source Structures:
- Identify the biological source of the extract (e.g., Brassica rapa subsp. rapa L.).
- Query the LOTUS database using the organism's scientific name as a keyword. Export all associated chemical structures in V3000 SDF file format (e.g.,
lotus_result.sdf).
Structure File Preprocessing:
- Convert Format: Use cheminformatics tools (e.g., RDKit, Open Babel) to convert the SDF file to V2000 format for broader software compatibility.
- Remove Duplicates: Execute a script (e.g.,
uniqInChI.py) to remove duplicate structures based on standardized InChI identifiers. - Standardize Tautomers: Apply a tautomer standardization script (e.g.,
tautomer.py) to convert non-standard representations (e.g., iminol forms of amides) to their more common tautomeric form to ensure accurate chemical shift prediction. - Fix Atomic Valence: Run a script (e.g.,
rdcharge.py) to reset non-standard valence notations on charged atoms to default values to prevent errors in prediction software.
Predict 13C NMR Chemical Shifts:
- Import the cleaned structure file (
processed_structures.sdf) into spectroscopic prediction software (e.g., ACD/Labs CNMR Predictor). - Configure the prediction parameters (solvent, NMR frequency). Batch-process all structures to generate predicted 13C NMR chemical shift lists for each compound.
- Import the cleaned structure file (
Build and Export Searchable Database:
- Compile the structures and their associated predicted NMR data into a dedicated database file (e.g., an ACD/Labs .NMRUDB file or a SQLite database).
- Structure the database to allow searching by chemical shift ranges, molecular formula, or substructure. Export a final, portable version for use in dereplication workflows.
Protocol 2: Implementing a Triple Taxonomy Technique (TTT) for Method Validation
Adapted from educational research, this protocol provides a framework for systematically validating and optimizing individual components of a dereplication pipeline by breaking down the evaluation into distinct cognitive levels [12].
Design a Validation Case Study:
- Case Stem: Create a realistic dereplication scenario (e.g., "Identify the major antifungal component in this Streptomyces extract given the following HR-MS and 1H NMR data...").
- Three-Level Question Design:
- Recall/Knowledge: Questions testing knowledge of database resources, taxonomic principles, or fundamental spectroscopic rules (e.g., "Which public database is best for searching MS/MS spectra of natural products?").
- Interpretation/Analysis: Questions requiring analysis of provided spectral data (e.g., "Interpret the key fragments in this MS/MS spectrum to propose a molecular substructure.").
- Problem-Solving/Application: Tasks requiring the integrated use of tools and data to reach a conclusion (e.g., "Using the provided links, query the GNPS and LOTUS platforms to propose an identity for Compound X and justify your answer.").
Execute the Validation Session:
- Present the case study to a group of researchers or students trained in dereplication.
- Allocate a fixed time (e.g., 20-30 minutes) for participants to work through the questions.
Provide Structured Feedback:
- Review answers by explicitly categorizing them according to the three levels.
- For each level, discuss correct approaches, common pitfalls, and optimal strategies (e.g., for the "Problem-Solving" level, demonstrate the exact database query sequence).
Quantitative and Qualitative Assessment:
- Collect anonymous feedback via a structured questionnaire (e.g., using a platform like Porsline or Google Forms) to assess the perceived effectiveness of the method and identify pain points in the workflow.
- Analyze the accuracy of answers at each taxonomic level to pinpoint specific areas (e.g., spectral interpretation vs. database navigation) that require improved training or tool development.
Diagram Title: Taxonomy-Focused NMR Database Creation Workflow
Diagram Title: Triple Taxonomy Technique for Method Validation
The Scientist's Toolkit: Essential Research Reagent Solutions
Table 3: Essential Tools and Reagents for Integrated Dereplication Research
| Tool/Reagent Category | Specific Example | Primary Function in Dereplication |
|---|---|---|
| Taxonomic & Structural Databases | LOTUS, GNPS, COCONUT, KNApSAcK | Provide the reference corpus of known compounds linked to biological sources and/or spectra for comparison [9] [4]. |
| Analytical Instrumentation | UPLC-HRMS/MS, High-Field NMR Spectrometer (e.g., 500+ MHz) | Generate high-quality, information-rich spectroscopic data (exact mass, MS^n fragments, 13C/1H NMR shifts) from crude or fractionated extracts [9]. |
| Spectral Prediction Software | ACD/Labs CNMR Predictor, MS Fragmenters (e.g., CFM-ID, SIRIUS) | Generate in-silico reference spectra for database expansion or for matching when experimental reference is unavailable [4]. |
| Cheminformatics & Scripting Tools | RDKit, Python/Anaconda, Open Babel | Enable automated processing of chemical structure files (SDF, SMILES), data wrangling, and custom workflow creation (e.g., CNMR_Predict scripts) [4]. |
| Data Analysis & Visualization Platforms | GNPS Molecular Networking, Cytoscape, R/Python for statistics | Facilitate the visualization of complex datasets, reveal clusters of related compounds in extracts, and enable statistical analysis of results [9]. |
The future of dereplication lies in the deeper artificial intelligence (AI)-driven integration of the three pillars. Machine learning models are being trained to directly predict bioactive compounds from a combination of taxonomic metadata and untargeted metabolomics data, effectively bypassing traditional stepwise identification [9]. Furthermore, the expansion of real-time, on-demand spectroscopic prediction coupled with blockchain-verified data provenance will enhance the reliability and speed of database searches [4]. The ongoing development of microcoil and cryoprobe NMR technology will continue to improve sensitivity, allowing the full NMR characterization of ever-smaller quantities of material directly from chromatographic peaks [9].
In conclusion, the historical evolution of natural product dereplication has solidified around three indispensable pillars: Taxonomic Classification, Analytical Spectroscopy, and Integrated Databases. Their rationale is proven: taxonomy provides biological context and filters chemical space, spectroscopy delivers precise analytical descriptors, and databases offer the collective knowledge base for matching. As demonstrated by quantitative assessments and structured protocols, the synergy between these pillars creates a workflow that is greater than the sum of its parts. For researchers and drug developers, mastering this integrated framework is no longer optional but fundamental to efficiently navigating the complex yet rewarding landscape of natural product discovery.
The discovery and development of novel bioactive compounds from nature are complicated by the immense chemical diversity and the frequent re-isolation of known entities. Dereplication, the rapid process of identifying known compounds within complex mixtures, has therefore become a critical first step in natural product (NP) research [7]. This process is fundamentally supported by three interconnected pillars: biological taxonomy, molecular structure elucidation, and spectroscopic analysis [7] [13]. Chemotaxonomy, which utilizes the chemical profile of an organism for classification, provides the essential biological context, narrowing the search space to compounds likely produced by taxonomically related species [14]. The definitive identification rests on elucidating the precise molecular structure, while spectroscopic and spectrometric techniques provide the unique spectral signatures that serve as fingerprints for comparison [7] [15]. This whitepaper explores these core terminologies and methodologies, framing them within the integrated workflow of modern NP dereplication, which is essential for efficient drug discovery.
Foundational Concepts and Terminologies
- Chemotaxonomy: A subdiscipline of systematics that uses the distribution and composition of secondary metabolites (e.g., alkaloids, flavonoids, terpenoids) to classify and identify organisms [14]. It operates on the principle that related organisms share biosynthetic pathways and thus chemical profiles.
- Spectral Signature: The characteristic pattern of electromagnetic radiation absorbed, emitted, or scattered by a specific material or molecule at various wavelengths [15]. In NP research, this most commonly refers to signatures from Nuclear Magnetic Resonance (NMR), Mass Spectrometry (MS), Infrared (IR), and Ultraviolet-Visible (UV-Vis) spectroscopy.
- Dereplication: The process of efficiently screening crude extracts or partially purified fractions to determine if a constituent is a novel compound or one that has been previously reported, thereby avoiding redundant isolation and characterization efforts [7] [16].
- Secondary Metabolite: Organic compounds not directly involved in the normal growth, development, or reproduction of an organism but which often play roles in defense, competition, and species interaction. They are the primary source of bioactive NPs [14].
- Chemotype: Intraspecific variants of a plant species that differ quantitatively and/or qualitatively in their secondary metabolite profile due to genetic variation, often leading to differences in biological activity [16].
Table 1: Core Analytical Techniques in Dereplication and Chemotaxonomy
| Technique | Acronym | Key Output/Data | Primary Role in Dereplication |
|---|---|---|---|
| Nuclear Magnetic Resonance | NMR | ¹H/¹³C chemical shifts, coupling constants, 2D correlation spectra | Definitive structural elucidation and fingerprint matching [7] [16]. |
| Liquid Chromatography-Mass Spectrometry | LC-MS / LC-MSⁿ | Molecular mass, fragment ion patterns, chromatographic retention time | Rapid annotation of molecular formulas and tentative identification via fragmentation libraries [7] [17]. |
| Gas Chromatography-Mass Spectrometry | GC-MS | Volatile compound profiles, mass spectra | Chemotaxonomic profiling of volatile metabolites (e.g., terpenes, essential oils) [17]. |
| High-Performance Thin-Layer Chromatography | HPTLC | Chromatographic fingerprint (Rf values, band colors) | Low-cost, high-throughput screening for chemotype variation and sample comparison [16]. |
The Three Pillars of Dereplication: Taxonomy, Structures, and Spectroscopy
Pillar 1: Biological Taxonomy
Taxonomy provides the biological context essential for efficient dereplication. The evolutionary relationships between organisms imply shared biochemistry; thus, searching for known compounds from taxonomically related species significantly narrows the list of candidate structures [7]. Modern research integrates traditional morphology with molecular phylogenetics (using DNA barcodes like ITS, matK, and rbcL) to establish accurate taxonomic frameworks [17]. This integrated approach is crucial for resolving species complexes in genera like Kaempferia and Clusia, where morphological similarities obscure taxonomic boundaries [16] [17].
Pillar 2: Molecular Structure Representation and Databases
The unambiguous representation of molecular structures is fundamental. Structures are stored digitally as connection tables (e.g., in MOL or SDF file formats) or linear notations (SMILES, InChI) [7]. These digital representations populate Natural Product Databases (NP DBs), which are the essential tools for dereplication. Key databases include:
- LOTUS: A comprehensive, open-source database that rigorously links NP structures to the taxonomy of their source organisms [4].
- COCONUT: A collective database compiling structures from numerous public NP resources [7].
- KNApSAcK: A species-metabolite relationship database useful for chemotaxonomic searches [7].
- PubChem: A general chemical database containing a vast number of NP structures and associated biological data [7].
Pillar 3: Spectroscopic and Spectrometric Signatures
Spectroscopic data provides the experimental fingerprint for comparison. The trend is toward hyphenated techniques (e.g., LC-MSⁿ, LC-SPE-NMR) that generate multi-dimensional data streams for compounds directly from complex mixtures [18].
- NMR Spectroscopy: Offers the most detailed structural information. ¹³C NMR is particularly valuable for dereplication due to its wide spectral dispersion, sharp signals, and accurate chemical shift predictability [4]. Tools like MixONat software enable the dereplication of mixtures by comparing experimental ¹³C NMR shifts against predicted values in taxonomically focused databases [16].
- Mass Spectrometry: Provides high-sensitivity detection and molecular formula determination. Tandem MS (MSⁿ) and molecular networking (e.g., via the GNPS platform) allow for the visualization of related compounds within extracts based on shared fragmentation patterns [7].
- Integrated Spectral Signatures: The most robust identification comes from combining data types. For example, a molecular formula from HR-MS, combined with key ¹H and ¹³C NMR shifts, can often uniquely identify a known compound [7].
Table 2: Key Databases and Computational Tools for Dereplication
| Name | Type | Key Feature | Application in Workflow |
|---|---|---|---|
| LOTUS [4] | Structure-Taxonomy DB | Open-source, links compounds to source organisms via validated taxonomy. | Initial taxon-focused candidate list generation. |
| GNPS [7] | MSⁿ Data Platform | Crowdsourced mass spectral library and molecular networking. | MS-based annotation and discovery of related compounds. |
| CNMR_Predict [4] | Prediction Tool | Generates taxon-focused DBs with predicted ¹³C NMR shifts. | Creating custom dereplication libraries for specific study organisms. |
| MixONat [16] | Dereplication Software | Compares experimental ¹³C NMR mix data to predicted DBs. | Identifying components in partially purified fractions or crude mixtures. |
Integrated Methodologies and Experimental Protocols
Protocol 1: Constructing a Taxon-Focused ¹³C NMR Dereplication Database
This protocol, exemplified by the CNMR_Predict tool, creates a custom database for targeted dereplication [4].
- Taxon Selection: Define the biological source (e.g., species Brassica rapa, family Clusiaceae).
- Structure Retrieval: Query the LOTUS database using the taxon name and download all associated compound structures in SDF format.
- Data Curation: Use Python/RDKit scripts to remove duplicate structures, correct tautomeric forms (e.g., convert iminols to amides), and standardize file formats.
- Spectral Prediction: Process the curated SDF file through commercial (e.g., ACD/Labs CNMR Predictor) or open-source ¹³C NMR prediction software to generate predicted chemical shifts for each compound.
- Database Deployment: The resulting database (e.g., a dedicated SDF or SQL DB) contains structures, source taxonomy, and predicted NMR shifts, ready for use with dereplication software like MixONat.
Protocol 2: HPTLC-Chemometrics-¹³C NMR for Chemotype Discovery
This integrated protocol identifies intraspecific chemotypes [16].
- Sample Preparation: Extract plant material (e.g., bark of Clusia spp.) and prepare semi-purified fractions of medium polarity.
- HPTLC Profiling: Run extracts/fractions on HPTLC plates. Develop and image plates under UV/Vis light to obtain chromatographic fingerprints.
- Chemometric Analysis: Digitize HPTLC band intensities. Perform Principal Component Analysis (PCA) and Hierarchical Cluster Analysis (HCA) to statistically identify outlier samples representing distinct chemotypes.
- ¹³C NMR Dereplication: Acquire ¹³C NMR spectra of the fractions from putative chemotypes. Input the experimental chemical shift lists into MixONat software, querying against a pre-built, taxonomically focused database (e.g., a Clusiaceae DB).
- Identification & Confirmation: Review top-scoring candidate compounds (score ≥ 0.70). Confirm identity by comparing full experimental and literature NMR data.
Protocol 3: Integrative Taxonomy via Morphology, DNA Barcoding, and Volatile Metabolomics
This protocol resolves classification of morphologically similar species [17].
- Morphological Characterization: Document qualitative and quantitative traits of fresh specimens (e.g., rhizome type, leaf shape, flower morphology).
- Molecular Phylogeny: Extract genomic DNA. Amplify and sequence standard DNA barcode regions (e.g., ITS, matK, rbcL, psbA-trnH). Reconstruct phylogenetic trees.
- Volatile Metabolomics: Use headspace Solid-Phase Microextraction (SPME) coupled with GC-MS to capture the volatile profile of raw rhizome material without solvent extraction.
- Integrated Data Analysis: Perform multivariate analysis (e.g., Orthogonal Projections to Latent Structures Discriminant Analysis - OPLS-DA) on GC-MS data to identify Variable Importance in Projection (VIP) markers that discriminate species. Correlate chemotypic clusters with clades in the phylogenetic tree.
- Marker Validation: Identify key discriminatory metabolites (e.g., specific sesquiterpenes) as validated chemotaxonomic markers for the species.
Diagram 1: The Integrated Dereplication Workflow (Width: 760px)
The Scientist's Toolkit: Essential Research Reagents and Materials
Table 3: Key Research Reagent Solutions for Featured Protocols
| Item / Reagent | Function / Role | Example in Protocol |
|---|---|---|
| Deuterated NMR Solvents (e.g., CD₃OD, DMSO-d₆) | Provides the atomic lock signal and non-interfering environment for acquiring NMR spectra of pure compounds or mixtures. | Used in Protocol 2 for acquiring ¹³C NMR spectra of Clusia fractions [16]. |
| SPME Fiber Assemblies (e.g., DVB/CAR/PDMS) | Adsorbs volatile organic compounds from headspace of solid/liquid samples for direct thermal desorption in GC-MS. | Used in Protocol 3 for solvent-free volatile profiling of Kaempferia rhizomes [17]. |
| HPTLC Plates (Silica gel 60 F₂₅₄) | Stationary phase for high-resolution planar chromatography, enabling parallel analysis of multiple samples. | Used in Protocol 2 for fingerprinting Clusia extracts [16]. |
| DNA Barcoding Primers (e.g., ITS1/ITS4, matK primers) | Oligonucleotides designed to amplify specific genomic regions for phylogenetic analysis. | Used in Protocol 3 to amplify ITS, matK, rbcL regions from Kaempferia [17]. |
| LC-MS Grade Solvents (e.g., Acetonitrile, Methanol) | High-purity mobile phase solvents for LC-MS to minimize background noise and ion suppression. | Used universally for preparing samples for LC-MSⁿ analysis in dereplication [7] [17]. |
| Taxon-Specific Natural Product Database (Custom SDF file) | Digital collection of structures and predicted spectra for a defined biological group, enabling focused searches. | The output of Protocol 1, used as input for dereplication in Protocol 2 [4] [16]. |
Diagram 2: Interrelation of the Three Pillars in Dereplication (Width: 760px)
Applications and Future Directions
The integrated application of these pillars drives modern bioprospecting. Research groups utilize this framework to discover leads for pharmaceuticals (e.g., anti-malarial alkaloids, anti-HIV agents), nutraceuticals, and cosmeceuticals from biodiverse resources [18]. The future of the field lies in further integration and automation:
- Artificial Intelligence and Machine Learning: For advanced pattern recognition in spectral data, predicting bioactive potential, and automating database curation [14].
- Real-Time Metabolomics: The development of faster, more sensitive analytical couplings for real-time, in-flow structural annotation.
- Global Collaborative Platforms: Expansion of open-access, curated databases like LOTUS and GNPS, which democratize data and accelerate discovery through crowdsourcing [7] [4].
- Standardization: Addressing the lack of standardized protocols for metabolite profiling and data reporting to improve reproducibility and data sharing across laboratories [14].
The convergence of chemotaxonomy, advanced spectroscopy, and robust bioinformatics within the three-pillar framework transforms natural product research from a slow, serial process into a rapid, informatics-driven discovery engine, crucial for the future of drug development.
Applied Strategies: Implementing Dereplication in Research Workflows
The re-emergence of natural products (NPs) as a cornerstone of drug discovery has been fueled by advanced dereplication strategies designed to rapidly identify known compounds early in the discovery pipeline [9]. Dereplication prevents the costly rediscovery of known molecules by cross-referencing analytical data against curated databases. This process stands upon three interdependent pillars: Taxonomy, Spectroscopy, and Structural Elucidation. Taxonomy, the science of biological classification, provides the essential evolutionary and ecological context that guides intelligent search strategies. By leveraging the principle that related organisms often produce chemically similar secondary metabolites, taxonomy acts as a powerful filter, dramatically narrowing the search space within complex spectral databases. This targeted approach, integrated with high-resolution spectroscopic data and structural annotation tools, forms the backbone of efficient NP research, accelerating the identification of novel bioactive scaffolds for therapeutic development [9].
Pillar I: Taxonomy – The Biological Context for Targeted Searching
2.1. Theoretical Foundation and Chemotaxonomic Principles Chemotaxonomy operates on the premise that biogenetic pathways for secondary metabolites are conserved within evolutionary lineages. This allows researchers to prioritize analytical efforts based on taxonomic provenance. For instance, searching for diterpenoids is more strategically focused in extracts from plants of the genus Salvia (Lamiaceae), while indole alkaloids are targeted in organisms from the Apocynaceae family. Modern dereplication workflows embed this taxonomic intelligence, using organism metadata as a primary search parameter to constrain database queries, thereby increasing both the speed and accuracy of compound identification [9].
2.2. Taxonomic Data Integration in Dereplication Workflows Effective integration requires structured, annotated databases. Key resources include the Global Biodiversity Information Facility (GBIF) for organism taxonomy and specialized NP databases that link compounds to their biological sources. The first step in a taxonomy-driven protocol is the precise identification of the source organism, often verified by genetic barcoding. This taxonomic identifier then pre-filters spectral database searches, ensuring that MS or NMR data is compared first against compounds reported from related taxa.
Table 1: Key Taxonomic and Natural Product Databases for Dereplication
| Database Name | Primary Content | Role in Taxonomy-Driven Search | Access |
|---|---|---|---|
| GBIF (Global Biodiversity Information Facility) | Authoritative taxonomic metadata and occurrence records | Provides standardized organism identification and phylogenetic context | Public |
| LotuS | Annotated database linking NPs to source organisms | Enables filtering of spectral searches by taxonomic clade | Academic/Commercial |
| CMAUP (Collection of Medicinal Plants and UniProt) | Integrated library of NPs from medicinal plants with target info | Allows target-based discovery within a taxonomic framework | Public |
| NPASS (Natural Product Activity and Species Source) | NP activities linked to species sources | Guides selection of source organisms based on desired bioactivity | Public |
The following diagram illustrates how taxonomic information directs the analytical workflow in natural product dereplication.
Diagram Title: Taxonomy-Guided Dereplication Workflow (100 chars)
Pillar II: Spectroscopy – The Analytical Engine for Compound Detection
3.1. Advanced Instrumentation for Dereplication The second pillar relies on high-resolution analytical technologies to generate robust chemical profiles. As of 2025, instrumentation continues to advance in sensitivity, speed, and hyphenation [19]. Key trends include the proliferation of miniaturized and field-portable devices (e.g., handheld NIR spectrometers) for in-situ analysis and the development of specialized laboratory systems like Quantum Cascade Laser (QCL)-based infrared microscopes for high-resolution spatial mapping of samples [19]. For dereplication, the core setup remains a hyphenated LC-MS/MS system, often coupled with high-resolution mass spectrometry (HRMS) and photodiode array (PDA) UV-Vis detection to provide multidimensional data (mass, fragmentation pattern, UV chromophore) in a single run [9].
3.2. Spectral Data Acquisition and Pre-Processing A standardized protocol is critical for generating reproducible, database-searchable data.
- Sample Preparation: Crude extract is dissolved in appropriate solvent and filtered.
- LC-MS/MS Analysis: Separation is performed on a reversed-phase C18 column with a water-acetonitrile gradient containing 0.1% formic acid. Data is acquired in data-dependent acquisition (DDA) mode on a HRMS instrument (e.g., Q-TOF or Orbitrap). The MS scans a mass range of m/z 100-1500, and the top N most intense ions are selected for fragmentation in each cycle.
- Data Processing: Raw files are converted to open formats (e.g., .mzML). Feature detection, alignment, and annotation are performed using software like MZmine 3 or GNPS, which output lists of m/z, retention time, and associated MS/MS spectra for downstream analysis [9].
Table 2: Comparison of Spectroscopic Techniques for Dereplication
| Technique | Key Information Provided | Typical Role in Dereplication | 2025 Instrumentation Trends [19] |
|---|---|---|---|
| HR-LC-MS/MS | Molecular formula (from m/z), fragmentation pattern | Primary tool for initial annotation via molecular networking and database search | Increased sensitivity; integration with ion mobility for isomeric separation |
| NMR Spectroscopy | Carbon skeleton, functional groups, stereochemistry | Definitive structural confirmation and isomer discrimination | Cryoprobes for microgram-scale analysis; automated structure verification software |
| UV-Vis/PDA | Chromophore presence (e.g., conjugated systems) | Supports compound class prediction (e.g., flavonoids, carotenoids) | Integrated into LC systems; diode array detectors with enhanced resolution |
| FT-IR & Microspectroscopy | Functional group fingerprint | Rapid characterization of bulk material or microscopic samples | QCL-based imaging (e.g., Bruker LUMOS II) for fast, high-contrast chemical mapping [19] |
Pillar III: Structural Elucidation – From Spectral Hit to Confirmed Identity
4.1. Database Searching and Molecular Networking The third pillar translates spectral data into chemical structures. The primary method involves searching acquired MS/MS spectra against reference spectral libraries such as GNPS, MassBank, or commercial databases. A taxonomy-driven approach is applied here by weighting or filtering results based on the source organism's taxonomic family, significantly improving accuracy [9]. For novel or unannotated spectra, molecular networking (via GNPS) is indispensable. This technique clusters MS/MS spectra by similarity, visualizing the chemical space of a sample and allowing analog-based annotation within a taxonomic context—where known compounds in a cluster can guide the identification of unknowns from the same organism.
4.2. Affinity Selection Mass Spectrometry (AS-MS) for Target-Guided Discovery Beyond passive dereplication, AS-MS represents a powerful target-oriented strategy for structural discovery within complex NP mixtures [20]. This label-free, biophysical method directly identifies ligands that bind to a purified protein target.
- Experimental Protocol for Ultrafiltration-Based AS-MS [20]:
- Incubation: A target protein (e.g., an enzyme) at low µM concentration is incubated with a crude natural extract or fraction library.
- Separation: The mixture is transferred to an ultrafiltration device (MWCO 10-30 kDa). Centrifugation retains the protein-ligand complexes while unbound compounds pass through.
- Washing: The retentate is washed with buffer to remove non-specifically bound molecules.
- Dissociation: Ligands are dissociated from the target using a denaturing solvent (e.g., 50% MeOH with 1% formic acid).
- Analysis: The eluent containing putative ligands is analyzed by LC-HRMS/MS. Compounds enriched in the experimental sample versus a target-free control are identified as binders.
- Annotation: The MS data of binders are processed through standard dereplication pipelines (Pillar II & III) for structural identification.
Table 3: The Scientist's Toolkit: Key Reagents & Materials for AS-MS Dereplication
| Item | Function in Experiment | Typical Specification / Example |
|---|---|---|
| Purified Target Protein | Biological receptor for ligand binding. | Soluble, active protein (>90% purity); e.g., kinase, protease, 5-LOX [20]. |
| Ultrafiltration Unit | Physically separates protein-ligand complexes from unbound mixture. | Centrifugal filter, 10-30 kDa molecular weight cut-off (MWCO). |
| Binding/Wash Buffer | Maintains native protein conformation and specific binding interactions. | Typically pH 7.4 phosphate or Tris buffer, may include salts (NaCl) and stabilizers (DTT). |
| Dissociation Solvent | Denatures protein and disrupts non-covalent bonds to release ligands. | Methanol or Acetonitrile (40-60%) with 0.1-1% volatile acid (formic, acetic). |
| LC-HRMS/MS System | Separates, detects, and fragments the released ligands for identification. | Q-TOF or Orbitrap mass spectrometer coupled to UHPLC system. |
| Bioinformatic Software | Processes MS data, calculates enrichment ratios, and annotates structures. | GNPS for molecular networking; MZmine for feature finding; SIRIUS for formula prediction. |
Integrated Taxonomy-Driven Workflow: A Case Study
An integrated approach demonstrates the synergy of the three pillars. Consider the search for 5-lipoxygenase (5-LOX) inhibitors from the fungus Inonotus obliquus.
- Taxonomy (Pillar I): The organism is authoritatively identified. Literature and database mining reveal that Inonotus (Hymenochaetaceae) fungi are known producers of triterpenoids and phenolics with anti-inflammatory activity.
- Spectroscopy & Target Screening (Pillar II): A crude extract is prepared and screened using an ultrafiltration AS-MS assay with 5-LOX protein [20]. The ligand-protein mixture is processed, and putative binders are eluted and analyzed via LC-HRMS/MS, yielding accurate mass and MS/MS data for enriched features.
- Structural Elucidation (Pillar III): The HRMS data for a putative ligand (m/z 455.3523 [M+H]+) is first queried against NP databases filtered for Basidiomycota fungi. A molecular network is constructed, placing the unknown feature in a cluster with known triterpenoids. MS/MS fragmentation matches suggest a lanostane-type triterpenoid. This taxonomy-informed, spectroscopy-guided annotation is ultimately confirmed by isolation and NMR, identifying the compound as lanosterol, a known 5-LOX binder [20].
The relationship between the three pillars and the final research goal is summarized in the following diagram.
Diagram Title: Interdependence of the Three Dereplication Pillars (99 chars)
Taxonomy-driven dereplication represents a paradigm of efficient natural product research, where biological intelligence systematically guides analytical and computational efforts. The integration of the three pillars—leveraging taxonomic context, cutting-edge spectroscopy, and robust structural annotation—creates a powerful feedback loop. Annotated compounds refine chemotaxonomic models, which in turn improve future search strategies.
The field is advancing toward fully automated, AI-integrated platforms. Future developments will likely include:
- Deep Learning-Enhanced Prediction: AI models trained on taxonomic and spectral data to predict novel compound classes directly from genomic or crude spectral data.
- Real-Time, Field-Deployable Systems: Combining portable DNA sequencers for on-site taxonomic identification with handheld MS-NMR devices for instant chemical profiling.
- Blockchain for Data Provenance: Ensuring immutable recording of taxonomic source data, promoting reproducibility and ethical sourcing in NP discovery.
By continuing to deepen the integration of taxonomy, spectroscopy, and structural elucidation, researchers can further streamline the path from complex natural extracts to novel therapeutic candidates, securing the vital role of natural products in the future of drug discovery.
The search for novel bioactive compounds from nature has undergone a paradigm shift, moving from serendipitous discovery to a systematic, data-driven scientific discipline. At the heart of this transformation lies dereplication—the rapid identification of known compounds early in the discovery pipeline to avoid redundant isolation and focus resources on true novelty [9]. This critical process is built upon three interconnected analytical pillars: Nuclear Magnetic Resonance (NMR) spectroscopy, Mass Spectrometry (MS), and Ultraviolet-Visible (UV-Vis) spectroscopy. When integrated within a taxonomy-aware framework, these techniques form a powerful triumvirate for elucidating the structures of natural products (NPs) [4] [9].
This whitepaper provides an in-depth technical guide to the acquisition, analysis, and integrated interpretation of data from these core spectroscopic techniques. Framed within the context of natural product dereplication taxonomy, we detail contemporary methodologies, from experimental protocols to advanced data fusion strategies, equipping researchers with the knowledge to efficiently navigate the complex chemical space of biological extracts [21] [22].
Foundational Techniques: Principles and Data Acquisition
2.1 Nuclear Magnetic Resonance (NMR) Spectroscopy NMR spectroscopy provides unparalleled insight into the covalent structure and three-dimensional configuration of organic molecules. It exploits the magnetic properties of certain atomic nuclei (e.g., ¹H, ¹³C), yielding spectra that inform on atom connectivity, functional groups, and stereochemistry. For dereplication, ¹³C NMR is particularly valuable due to its wide spectral dispersion, minimal signal overlap, and predictable chemical shifts, allowing for direct database matching [4]. Modern workflows often involve the creation of taxonomy-focused ¹³C NMR databases. A representative protocol involves querying a comprehensive resource like the LOTUS database using a taxonomic keyword, processing the resulting structures with cheminformatic tools (e.g., RDKit), and supplementing them with predicted ¹³C chemical shifts from software such as ACD/Labs CNMR Predictor to create a tailored search library [4].
2.2 Mass Spectrometry (MS) MS determines the mass-to-charge ratio (m/z) of ionized molecules and their fragments, providing exact molecular weight and structural clues. It is the cornerstone of high-sensitivity analysis for complex mixtures. Liquid Chromatography-MS (LC-MS) and especially tandem MS/MS are indispensable. The fragmentation patterns in MS/MS spectra are highly reproducible and characteristic of specific molecular substructures [21]. The advent of Molecular Networking (MN), pioneered by the Global Natural Products Social Molecular Networking (GNPS) platform, has revolutionized MS data analysis. MN visualizes the relationships between compounds in a sample based on spectral similarity, grouping structurally related molecules into "molecular families" and guiding targeted isolation [21].
2.3 Ultraviolet-Visible (UV-Vis) Spectroscopy UV-Vis spectroscopy measures the absorption of light by chromophores (e.g., conjugated π-systems, carbonyl groups). While providing less specific structural information than NMR or MS, it offers rapid, non-destructive quantification and is highly sensitive to compound classes. In hyphenated systems like LC-UV-Vis (or LC-PDA), it serves as a robust first-pass detector, generating UV spectra for each chromatographic peak that can be matched against libraries, aiding in the preliminary classification of compounds such as flavonoids, alkaloids, or polyphenols [19] [9].
Table 1: Comparative Analysis of Core Spectroscopic Techniques in Dereplication
| Technique | Key Information Obtained | Primary Role in Dereplication | Typical Sample Requirement | Key Strength | Key Limitation |
|---|---|---|---|---|---|
| NMR | Atomic connectivity, functional groups, stereochemistry, quantification. | Definitive structural elucidation and verification; ¹³C NMR database matching. | ~0.1 - 10 mg (for ¹H). | Non-destructive; provides complete structural details; excellent for quantification. | Lower sensitivity; requires relatively pure compound or advanced mixture analysis methods. |
| MS / MS-MS | Exact mass, molecular formula, fragmentation patterns, isotopic signatures. | High-throughput profiling of mixtures; molecular formula assignment; MN for compound families. | pg - ng (highly sensitive). | Extremely high sensitivity; works directly with complex mixtures; ideal for hyphenation with LC. | Destructive; ionization efficiency varies; limited direct stereochemical information. |
| UV-Vis | Chromophore presence, conjugation, concentration (via Beer-Lambert Law). | Rapid compound class screening; online detection in LC; quantification of known chromophores. | µg - mg. | Fast, simple, and inexpensive; excellent for quantification. | Low structural specificity; requires a chromophore; spectra often broad and overlapping. |
Integrated Analytical Workflows and Data Fusion
The greatest power in modern dereplication is realized not through individual techniques, but through their strategic integration. Hyphenated techniques like LC-MS/MS and LC-SPE-NMR combine separation power with rich spectroscopic detection. The subsequent fusion of data from multiple platforms creates a comprehensive analytical profile that is more than the sum of its parts [22].
3.1 Multi-Technique Dereplication Workflow A robust, taxonomy-informed dereplication pipeline begins with crude extract analysis. LC-MS/MS provides a metabolic fingerprint, which is processed via Feature-Based Molecular Networking (FBMN) on the GNPS platform to visualize compound families and annotate known structures using spectral library matches [21]. Concurrently, LC-UV analysis offers preliminary compound class assignments. Bioactive or novel clusters identified via MN guide the targeted isolation of fractions. These fractions are then subjected to high-resolution ¹H and ¹³C NMR. The NMR data is queried against a taxonomy-focused database (e.g., created via the CNMR_Predict method for ¹³C shifts) [4]. A conclusive identification is achieved when evidence from all techniques—MS/MS fragmentation, UV chromophore, and NMR chemical shifts—converges on a single structure consistent with the known metabolites of the source organism's taxonomic group.
Taxonomy-Aware Dereplication Workflow
3.2 Data Fusion Strategies for NMR and MS Formal Data Fusion (DF) strategies systematically combine the complementary datasets from NMR and MS to build more robust and informative models [22]. These are categorized by the level of data integration:
- Low-Level DF: Direct concatenation of pre-processed raw data or feature tables (e.g., NMR chemical shift bins with MS m/z intensities). This retains maximum information but requires careful scaling to balance the contributions of each technique [22].
- Mid-Level DF: Integration of features extracted from each dataset separately (e.g., PCA scores from NMR and MS data). This reduces dimensionality before fusion, mitigating the "curse of dimensionality" [22].
- High-Level DF: Combination of final model outputs or decisions (e.g., classification results from independent NMR- and MS-based models). This offers flexibility and robustness, as each platform is modeled according to its own optimal parameters [22].
Data Fusion Strategies for NMR-MS Integration
Table 2: Essential Databases and Spectral Libraries for Dereplication
| Resource Name | Type | Key Content / Function | Primary Technique | Access |
|---|---|---|---|---|
| LOTUS Initiative | Structural & Taxonomic DB | Curated relationships between NPs and their biological source organisms [4]. | All (Taxonomic filter) | Public Web Interface |
| GNPS / MassIVE | Spectral Library & Tools | Massive public repository of MS/MS spectra; platform for Molecular Networking and analysis [21]. | MS/MS | Public |
| CNMR_Predict Workflow | Predictive Tool & DB | Creates taxon-specific databases with predicted ¹³C NMR shifts from LOTUS structures [4]. | 13C NMR | Scripts Available |
| SciFinder-n | Comprehensive DB | Chemical Abstracts; extensive search for literature and experimental spectra [23]. | NMR, MS, IR | Subscription |
| Reaxys | Comprehensive DB | Chemical data, reactions, and properties from Beilstein/Gmelin [23]. | NMR, MS | Subscription |
| SDBS | Spectral DB | Curated IR, MS, Raman, and NMR spectra [23]. | NMR, MS | Public |
| NIST WebBook | Spectral DB | IR, MS, and UV-Vis spectra for a wide range of compounds [23]. | MS, UV-Vis | Public |
Table 3: Essential Research Reagent Solutions and Materials
| Item / Solution | Function in Experiment | Key Technical Note |
|---|---|---|
| Deuterated NMR Solvents (e.g., CD3OD, DMSO-d6) | Provides a stable, deuterium lock signal for the NMR spectrometer and minimizes interfering proton signals from the solvent. | Choice affects compound solubility and can induce chemical shift variations. Must be of high isotopic purity (>99.8% D). |
| LC-MS Grade Solvents (Water, Acetonitrile, Methanol) | Used for mobile phase preparation and sample dilution. Minimizes background ions and noise, ensuring high signal-to-noise in MS detection. | Low UV cutoff is also critical for LC-UV detection. Must be free of polymeric and ionic contaminants. |
| Formic Acid / Ammonium Acetate | Common volatile additives for LC-MS mobile phases. Acidifiers (formic acid) promote positive ionization; buffers (ammonium acetate) aid in separation and negative ionization. | Concentration is critical (typically 0.1%). Non-volatile buffers (e.g., phosphate) are incompatible with MS. |
| Silica & C18 Stationary Phases | For preparative and solid-phase extraction (SPE) purification. Isolates individual compounds or enriched fractions for pure NMR analysis. | Particle size and pore geometry dictate resolution and loading capacity. |
| NMR Reference Standards (e.g., TMS, DSS) | Provides a chemical shift reference point (0 ppm) for calibrating NMR spectra, ensuring data is comparable across instruments and labs. | Added in minute quantities. DSS is preferred for aqueous samples. |
| Ultrapure Water System (e.g., Milli-Q) | Produces Type I water for all aqueous solutions, buffers, and mobile phases. Eliminates interferents from ions, organics, and particles. | Essential for baseline stability in LC-UV and to avoid ion suppression in MS [19]. |
The integrated application of NMR, MS, and UV-Vis spectroscopy, contextualized by taxonomic knowledge, constitutes the modern foundation of efficient natural product research. The field is moving decisively toward automated, data-rich workflows that leverage molecular networking, in-silico prediction, and multi-platform data fusion to drastically accelerate dereplication [21] [22]. Future advancements will be driven by artificial intelligence for spectral prediction and interpretation, the expansion of open-access, curated spectral databases, and the development of even more sensitive microcryoprobes for NMR and miniaturized mass spectrometers for in-field analysis [19] [24]. By mastering the technical details of data acquisition, analysis, and integration outlined in this guide, researchers can effectively harness these three analytical pillars to illuminate the vast, untapped chemical diversity of the natural world.
The dereplication of natural products (NPs) is a critical, efficiency-driven process in drug discovery that aims to rapidly identify known compounds within complex biological extracts, thereby preventing the redundant isolation and characterization of previously reported substances. This process is fundamentally supported by three interdependent pillars: Taxonomy, Spectroscopy, and Molecular Structures [7].
- Taxonomy leverages the principle that phylogenetically related organisms often biosynthesize similar secondary metabolites. Knowledge of a source organism's classification allows researchers to narrow the search for potential metabolites to those documented in related species, significantly reducing the candidate pool for identification [7].
- Spectroscopy encompasses the analytical techniques—primarily Nuclear Magnetic Resonance (NMR) and Mass Spectrometry (MS)—that provide the experimental data fingerprint of a compound. The comparison of this spectral data against reference libraries is the core technical act of dereplication [7] [9].
- Molecular Structures represent the definitive endpoint: the chemical identity of the compound. This pillar involves the use of structural databases and cheminformatic tools to store, search, and match chemical entities [7].
The integration of these pillars is facilitated by specialized natural product databases (e.g., LOTUS, KNApSAcK, COCONUT, GNPS) that link compound structures to taxonomic origins and, increasingly, to spectral data [7] [9]. This guide details the practical application of this framework through a case study on Urceolina peruviana, an Amaryllidaceae plant traditionally used for its antibacterial and anticancer properties [7].
Botanical Source:Urceolina peruviana(C. Presl) J.F. Macbr.
Urceolina peruviana is a bulbous perennial plant native to the Andean region of South America. It belongs to the Amaryllidaceae family, a group renowned for producing a specific and pharmacologically valuable class of isoquinoline alkaloids [25]. These Amaryllidaceae alkaloids exhibit a wide range of biological activities, making the plant a relevant subject for phytochemical investigation and a suitable model for dereplication methodology [7].
Experimental Dereplication Workflow
The modern dereplication process for a crude natural extract is a multi-stage analytical workflow. The following diagram and table outline the generalized steps and key tools involved.
Diagram: Integrated Dereplication and Identification Workflow
Table: Key Research Reagent Solutions and Essential Materials
| Item | Function in Dereplication | Example/Note |
|---|---|---|
| LC-HRMS/MS System | Provides accurate mass (molecular formula) and fragmentation patterns (MS²) for components in a mixture without full purification [9]. | Coupled UPLC or HPLC with high-resolution mass spectrometer (e.g., Q-TOF, Orbitrap). |
| NMR Spectrometer | Provides definitive structural information on atomic connectivity and stereochemistry. Critical for confirming identities suggested by MS [7] [9]. | Preferably 400 MHz or higher, with cryoprobes for sensitivity. |
| Dereplication Software | Platforms that automate the comparison of experimental data against databases [9]. | Global Natural Products Social Molecular Networking (GNPS), MS-DIAL, Sirius. |
| Taxonomy-Focused DB | Database that links compounds to biological sources, allowing a taxonomically constrained search [7] [4]. | LOTUS, KNApSAcK, databases generated by KnapsackSearch or CNMR_Predict scripts [4]. |
| Spectral Database | Collections of reference NMR and MS spectra for known compounds [9]. | PubChem, Chenomx NMR Suite, CAS SciFinder, In-house libraries. |
| Fractionation Equipment | To simplify complex extracts into less complex fractions for easier analysis [9]. | Vacuum Liquid Chromatography (VLC), Centrifugal Partition Chromatography (CPC), Solid Phase Extraction (SPE). |
Detailed Methodologies
Methodology for MS-Based Dereplication and Molecular Networking
This protocol is adapted from standard workflows in the field [9] [26].
- Sample Preparation: The dried, powdered plant material (e.g., bulbs) is extracted using a solvent like methanol or ethanol-water. The crude extract is often fractionated using a step like Vacuum Liquid Chromatography (VLC) to reduce complexity [26].
- LC-HRMS/MS Analysis:
- Instrumentation: Analysis is performed on a UPLC system coupled to a high-resolution tandem mass spectrometer.
- Chromatography: Use a reversed-phase C18 column. A binary gradient (e.g., water and acetonitrile, both with 0.1% formic acid) is employed for separation.
- MS Parameters: Data is acquired in data-dependent acquisition (DDA) mode. Full MS scans are recorded at high resolution (e.g., 70,000 FWHM). The top N most intense ions from each scan are selected for fragmentation (MS²) at a defined collision energy.
- Data Processing & Molecular Networking:
- Raw data files are converted to an open format (.mzML).
- Files are uploaded to the GNPS platform (https://gnps.ucsd.edu).
- A molecular network is created where nodes represent parent ions and edges connect ions with similar MS² spectra, suggesting structural similarity [9].
- The network is searched against GNPS spectral libraries. Annotations are propagated within the network, aiding in the dereplication of both library-matched and related, unknown compounds.
Methodology for ¹³C NMR-Based Dereplication
This approach is powerful for identifying known compounds directly in mixtures or partially purified fractions [7] [4].
- NMR Data Acquisition:
- A key fraction or the crude extract is dissolved in a deuterated solvent (e.g., CD₃OD, DMSO-d₆).
- A ¹³C NMR spectrum (with proton decoupling) is acquired. ¹³C NMR is favored for its wide chemical shift dispersion and lower probability of signal overlap compared to ¹H NMR [4].
- Supplementary 2D NMR experiments (e.g., HSQC, HMBC) may be acquired for structure elucidation of unknowns.
- Database Creation & Querying (Taxonomy-Focused):
- A taxon-specific database is constructed. Using a tool like CNMR_Predict [4], the list of compounds reported for the target organism and its close relatives is retrieved from a database like LOTUS.
- Predicted ¹³C NMR chemical shifts are generated for all compounds in the list using prediction software (e.g., ACD/Labs CNMR Predictor).
- The experimental ¹³C NMR spectrum of the sample is automatically compared against this custom database. The software calculates a match score based on the coincidence of chemical shifts, directly proposing the identity of known constituents [4].
Case Study Data: Identified Alkaloids fromU. peruviana
Application of the above dereplication strategies to Urceolina peruviana bulb extracts has led to the consistent identification of a characteristic profile of Amaryllidaceae alkaloids. The following table summarizes key alkaloids identified, along with representative NMR data [25].
Table: Representative Alkaloids Dereplicated from Urceolina peruviana Bulbs [25]
| Compound Name | Class / Skeleton | Key ¹³C NMR Chemical Shifts (δ, ppm) * | Key ¹H NMR Chemical Shifts (δ, ppm) * | Biological Activity Reference |
|---|---|---|---|---|
| Haemanthamine | Crinine-type | 31.5 (C-3), 58.2 (C-2), 88.9 (C-6), 147.1 (C-11) | 4.35 (d, J=4.0 Hz, H-6β), 6.62 (s, H-10) | Anticancer, antiviral |
| Tazettine | Tazettine-type | 56.1 (C-2), 66.5 (C-3), 108.2 (C-10a), 147.8 (C-7) | 2.55 (m, H-3), 5.92 (s, H-7) | Acetylcholinesterase inhibition |
| Crinine | Crinine-type | 28.9 (C-3), 50.5 (C-2), 90.1 (C-6), 111.2 (C-11) | 4.30 (m, H-6β), 6.50 (s, H-10) | Anticholinesterase, cytotoxic |
| Trisphaeridine | Phenanthridine-type | 102.4 (C-1), 124.8 (C-10a), 147.5 (C-4a), 152.8 (C-6) | 7.08 (d, J=8.0 Hz, H-8), 8.30 (d, J=8.0 Hz, H-7) | Cytotoxic, antimicrobial |
| Pretazettine (6β-OH) | Tazettine-type | 56.4 (C-2), 71.8 (C-6), 109.5 (C-10a), 148.0 (C-7) | 4.50 (br s, H-6), 5.95 (s, H-7) | Potent anticancer activity |
*Note: Data is illustrative from published assignments [25]; exact values are solvent-dependent.
Advanced Techniques & Future Directions
- Diffusion-Ordered NMR Spectroscopy (DOSY): DOSY can separate mixture components in the NMR tube based on their diffusion coefficients, which correlate with molecular weight and shape. This provides an additional orthogonal filter for dereplication, as demonstrated in the identification of alkaloids from bryozoans [27].
- Integrated Metabolomics Workflows: The trend is toward fully integrated platforms that combine MS molecular networking, bioactivity screening data, and automated ¹³C NMR dereplication in a single pipeline. This allows for the precise targeting of compounds responsible for observed biological effects [9].
- Machine Learning & AI: Predictive models are being increasingly used to interpret complex spectral data, suggest structural classes for unknown molecules, and improve the accuracy of database matching, moving beyond simple spectral library search.
The dereplication of alkaloids from Urceolina peruviana serves as a practical demonstration of the three-pillar framework in action. By strategically employing taxonomic filtering (Amaryllidaceae focus), advanced spectroscopic profiling (LC-HRMS/MS and NMR), and efficient querying of structural databases, researchers can rapidly map the phytochemical landscape of this medicinal plant. This process confirms the presence of bioactive, known alkaloids like haemanthamine and pretazettine while efficiently flagging unusual signatures for further investigation. As databases grow and analytical technologies become more integrated, dereplication will remain the cornerstone of efficient and impactful natural product drug discovery.
Overcoming Challenges: Optimizing Dereplication Processes
The dereplication of natural products is foundational to modern drug discovery, preventing the costly rediscovery of known compounds. This process is built upon three interdependent pillars: robust taxonomic classification of source organisms, comprehensive spectroscopic and chromatographic analysis, and accurate structural elucidation. However, the efficiency of this framework is critically undermined by pervasive pitfalls, including inconsistent data quality in reference repositories, the inherent incompleteness of specialized databases, and spectral ambiguities arising from analytical limitations. This guide provides an in-depth technical analysis of these challenges, detailing their origins within contemporary research workflows and presenting advanced, integrated methodological solutions—such as multiblock statistical analysis and taxonomy-focused database construction—to enhance the reliability and throughput of natural product identification.
The resurgence of natural products (NPs) as a premier source for novel drug leads hinges on the ability to rapidly identify known compounds—a process termed dereplication [9]. Effective dereplication is built upon three foundational, interconnected pillars:
- Taxonomy: Accurate biological classification of the source organism provides the first filter for candidate NP identification, leveraging the principle of phylogenetically conserved biosynthetic pathways [4].
- Spectroscopy: The generation of high-fidelity analytical data, primarily from Mass Spectrometry (MS) and Nuclear Magnetic Resonance (NMR), forms the core experimental evidence for compound characterization.
- Structures: The final pillar involves the translation of spectral signatures and taxonomic context into a definitive chemical structure, a task reliant on high-quality reference databases and predictive algorithms [9] [8].
These pillars do not function in isolation. Instead, they form an integrated workflow where weaknesses in one compromise the integrity of the entire system. The central thesis of this guide is that the major bottlenecks in dereplication—data quality, incomplete databases, and spectral ambiguities—are systemic issues that manifest at the intersections of these pillars. For instance, a high-quality MS/MS spectrum (Pillar 2) is of limited use if the reference database (Pillar 3) is poorly annotated or lacks taxonomic metadata (Pillar 1). The following sections dissect these pitfalls and present integrative solutions that reinforce the entire dereplication framework.
The Data Quality Challenge: Inconsistency in Reference Repositories
The "Big Data" era in natural products research is characterized by the 4Vs: high Volume, Velocity of generation, great Variety in data types, and low Value density [28]. This environment intensifies long-standing data quality challenges, making the "fitness for use" of data a primary concern [28].
Dimensions of Data Quality in NP Databases
Data quality is not monolithic but comprises multiple dimensions critical for scientific reuse. Key dimensions relevant to NP research include:
- Accuracy & Completeness: Is the stored structural, spectral, or taxonomic data correct and fully represented? Manual curation errors and incomplete fields are common [29].
- Consistency: Is the same compound represented identically across different databases? Fragmentation leads to redundant and conflicting entries [29].
- Timeliness: Is the database current with recent literature? Many public databases suffer from update lags [29].
- Accessibility & Interoperability: Can data be easily retrieved, shared, and combined? Proprietary formats and a lack of standardized metadata hinder the FAIR (Findable, Accessible, Interoperable, Reusable) principles [29].
The landscape of microbial NP databases exemplifies these issues. A review identified 122 structural resources, yet only three (NPASS, StreptomeDB, Natural Products Atlas) allowed effective filtering for microbial compounds and were freely accessible, highlighting problems of accessibility and scope fragmentation [29].
Table 1: Key Microbial Natural Product Structural Databases
| Database | Compound Count (Microbial) | Key Features | Primary Limitation |
|---|---|---|---|
| NPASS [29] | ~9,000 of 35,032 | Includes biological activities & source organisms | Partial coverage of chemical space |
| StreptomeDB [29] | 7,125 | Focus on Streptomyces genus; some bioactivity/spectral data | Limited to a single bacterial genus |
| Natural Products Atlas [29] | 25,523 (v2019_12) | Comprehensive for microbial NPs; links to MIBiG & GNPS | Requires active maintenance to stay current |
| Commercial DBs (DNP, AntiBase) [29] | >30,000 each | Broad literature coverage, rich metadata, high accuracy | High cost, limited access creates barriers |
Consequences and Mitigation Strategies
Poor data quality directly leads to misidentification, wasted resources on rediscovery, and erroneous biological conclusions. Mitigation requires a multi-tiered approach:
- Adoption of FAIR Principles: Implementing standardized metadata schemas, unique identifiers, and open APIs to enhance data integration [29].
- Advanced Curation and Validation: Employing automated checks for structural validity (e.g., via RDKit) and consistency, complemented by expert manual curation [4].
- Distributed Imputation for Incomplete Data: When dealing with missing values in distributed datasets (e.g., multi-institutional studies), methods like Communication-efficient Surrogate Likelihood Multiple Imputation (cslMI) can effectively handle incomplete data without sharing raw patient-level information, preserving privacy while improving analytical power [30].
The Incompleteness Problem: Gaps in Databases and Taxonomic Coverage
A dereplication database is only as useful as its coverage. Incompleteness arises in two major forms: a lack of comprehensive spectral-structural entries and insufficient taxonomic contextualization.
Spectral and Structural Gaps
Despite the existence of numerous databases, the majority of known NPs lack publicly available, high-quality reference spectra. MS/MS libraries are heavily biased toward commercially available standards, while public NMR repositories cover only a fraction of known structures [31] [8]. This turns many "known" compounds into "known unknowns" during analysis. A study assessing dereplication using 58 experimental 13C NMR datasets found that success depended heavily on the selected database's coverage and search algorithms [8].
The Taxonomic Data Gap
A critical shortfall is the disconnect between chemical data and detailed taxonomic provenance. Many databases list a source organism name without standardized classification (e.g., full phylogenetic lineage), preventing powerful taxonomy-based filtering. This gap forces scientists to search the entire chemical universe when a taxon-restricted search would be far more efficient and accurate [4].
Solution: Constructing Taxonomy-Focused Databases
A proactive solution is the creation of custom, taxon-specific databases. The CNMR_Predict pipeline demonstrates this by integrating the LOTUS resource—which links structures to taxonomy—with in silico 13C NMR prediction tools (e.g., ACD/Labs) [4].
Table 2: Experimental Protocol for Building a Taxon-Specific 13C NMR Database
| Step | Protocol Description | Tools/Software | Key Outcome |
|---|---|---|---|
| 1. Taxon Query | Extract all NP structures linked to a target organism or higher taxon. | LOTUS web interface | A structure file (SDF) for the taxon of interest. |
| 2. Structure Curation | Remove duplicates, standardize tautomeric forms (e.g., amide/iminol), and fix valence errors for predictor compatibility. | RDKit, custom Python scripts (uniqInChI.py, tautomer.py) |
A cleaned, standardized structure file. |
| 3. Spectral Prediction | Batch-predict 13C NMR chemical shifts for all curated structures. | ACD/Labs CNMR Predictor (or other in silico tools) | A database file pairing each structure with its predicted spectrum. |
| 4. Database Deployment | Format the output for use in dereplication software or as a searchable local database. | Custom scripts, database management software | A ready-to-use, taxonomy-focused dereplication resource. |
This method was illustrated for Brassica rapa, creating a targeted database that dramatically increases the probability of correct identification by restricting candidate compounds to those biologically plausible for the sample's origin [4].
Spectral Ambiguities: Limitations of Analytical Platforms and Isobaric Challenges
Even with high-quality samples, the intrinsic limitations of analytical techniques and the complexity of NP mixtures generate spectral ambiguities that obstruct definitive identification.
Complementary Strengths and Weaknesses of NMR and MS
NMR and MS are complementary but non-overlapping pillars of spectroscopy. Their comparative strengths and weaknesses are foundational to understanding spectral ambiguity.
Table 3: Comparative Analysis of NMR and MS for Metabolomics/Dereplication
| Parameter | Nuclear Magnetic Resonance (NMR) | Mass Spectrometry (MS) |
|---|---|---|
| Sensitivity | Low (μM to mM range) [32] [33] [34] | Very High (pM to nM range) [32] [33] [34] |
| Quantitation | Excellent (signal directly proportional to nucleus count) [34] | Challenging (depends on ionization efficiency) [34] |
| Sample Prep | Minimal, non-destructive [32] [34] | Often extensive; destructive analysis [32] |
| Key Strength | Structure elucidation power, isotope detection, non-targeted | High throughput, detection of low-abundance metabolites |
| Primary Limitation | Low sensitivity, peak overlap in complex mixtures [32] [33] | Ion suppression, matrix effects, inability to distinguish isomers [32] [31] [33] |
| Information | Direct atomic connectivity, functional groups, stereochemistry | Molecular formula, fragment patterns, exact mass |
Relying on a single platform inevitably creates a biased and incomplete metabolic profile. For example, MS can fail to detect or correctly identify isomers and isobars—compounds with identical mass but different structures—which are rampant among NPs like flavonoid glycosides [31]. NMR can struggle with low-concentration compounds masked by larger peaks.
The Isobaric and Isomeric Hurdle
A case study on flavonol glycosides using LC-QTOF auto-MS/MS revealed the scale of this problem. Twelve closely related compounds, some isomeric (same formula, different structure) or isobaric (same nominal mass, different formula), produced complex data where identification based solely on accurate mass and fragment patterns was ambiguous [31]. Software tools that perform in silico fragmentation (e.g., MS-FINDER, SIRIUS/CSI:FingerID) are essential to rank candidate structures, but final confirmation often requires cross-checking with comprehensive chemical reference databases like SciFinder or Reaxys to verify the plausibility of proposed fragments [31].
Diagram 1: Genesis of Spectral Ambiguity from Analytical Limitations (Max width: 760px)
Modern Solutions: Integrating Data and Techniques
Overcoming these interconnected pitfalls requires moving beyond sequential, single-technique analysis toward integrated methodologies.
Integrated NMR-MS Analysis and Multiblock Statistics
The most robust approach is the concurrent analysis of a single sample by both NMR and MS, followed by integrated data fusion. An optimized protocol involves:
- Sample Preparation: Using a single extraction solvent compatible with both NMR and direct-infusion ESI-MS (DI-ESI-MS), minimizing preparation-induced variation [32].
- Data Acquisition: Collecting 1D 1H NMR spectra and high-throughput, positive-ion DI-ESI-MS data without pre-separation to capture complementary metabolite profiles [32].
- Data Fusion with Multiblock Analysis: Employing multiblock multivariate statistical methods, such as Multiblock Principal Component Analysis (MB-PCA) or Multiblock Partial Least Squares (MB-PLS), to analyze the NMR and MS datasets simultaneously. This technique leverages correlations between the two data blocks, producing models more aligned with the underlying biology than analyzing each block separately or merging results post-hoc [32].
A Unified Dereplication Workflow
The synthesis of taxonomy, integrated spectroscopy, and modern bioinformatics defines the state-of-the-art dereplication pipeline.
Diagram 2: Modern Integrated Dereplication Workflow (Max width: 760px)
The Scientist's Toolkit: Essential Research Reagent Solutions
| Category | Item/Software | Primary Function in Dereplication |
|---|---|---|
| Database & Literature | SciFinder / Reaxys |
Authoritative chemical reference databases to verify candidate structures and find published spectral data [31]. |
LOTUS |
Resource linking NP structures to taxonomic data, enabling taxon-focused database creation [4]. | |
| Spectral Analysis & Prediction | ACD/Labs CNMR Predictor |
Software for in silico prediction of 13C NMR spectra to supplement experimental databases [4] [8]. |
GNPS (Global Natural Products Social) |
Platform for community-wide sharing and analysis of MS/MS spectral data and molecular networking [4]. | |
nmrshiftdb2 |
Open-source NMR database for spectrum prediction and structure search [8]. | |
| Data Processing & Statistics | MS-DIAL |
Software for peak picking, alignment, and deconvolution of LC-MS data [31]. |
MS-FINDER / SIRIUS |
Tools for in silico fragmentation and formula/structure prediction from MS/MS data [31]. | |
| Multiblock PLS/PCA Algorithms | Statistical packages (often in R or Python) for the integrated analysis of fused NMR and MS datasets [32]. | |
| Cheminformatics | RDKit |
Open-source toolkit for cheminformatics (e.g., structure standardization, descriptor calculation) used in curation pipelines [4]. |
The dereplication of natural products is a critical, multi-dimensional challenge in drug discovery. As this guide has detailed, the process is systematically vulnerable where its three core pillars—taxonomy, spectroscopy, and structural databases—are weakened by poor data quality, incomplete coverage, and analytical ambiguities. These are not isolated issues but interconnected failures that amplify each other. The path forward lies in integrative solutions: adopting FAIR data principles, constructing intelligent taxonomy-focused databases, implementing combined NMR-MS analytical workflows, and applying advanced statistical data fusion techniques like multiblock analysis. By addressing these pitfalls through a unified, systems-oriented approach, researchers can solidify the foundation of dereplication, accelerating the efficient and confident discovery of novel bioactive natural products.
The systematic discovery and characterization of natural products (NPs) rest upon three interdependent pillars: taxonomy (organism sourcing and identification), spectroscopy (data acquisition), and structural analysis (data interpretation and compound identification) [21]. This guide focuses on the critical second pillar, detailing advanced methodologies in Nuclear Magnetic Resonance (NMR) spectroscopy and Mass Spectrometry (MS) that optimize data quality and accelerate dereplication—the process of efficiently identifying known compounds within complex mixtures.
Optimization in this context is driven by the need to maximize information content per unit of precious sample and instrument time. For NMR, this translates to enhancing sensitivity and resolution to detect minor constituents or conformational states [35] [36]. For MS, it involves improving the generation and interpretation of fragmentation data for confident structural annotation [21] [37]. When integrated, these optimized spectroscopic workflows feed directly into the third pillar, enabling the precise structural elucidation that defines new chemical entities and informs their taxonomic and biological significance.
Foundational Principles of NMR and MS in Natural Product Analysis
NMR Spectroscopy exploits the magnetic properties of atomic nuclei (e.g., ¹H, ¹³C, ¹⁵N). When placed in a strong magnetic field (B₀), nuclei with spin absorb and re-emit radiofrequency energy at characteristic frequencies (chemical shifts, δ), which are exquisitely sensitive to their molecular environment [38]. Key parameters include the longitudinal (T₁) and transverse (T₂) relaxation times, which govern signal recovery and decay, respectively. The signal-to-noise ratio per unit time (SNRt) is the critical metric for experiment optimization [35].
Mass Spectrometry determines the mass-to-charge ratio (m/z) of ionized molecules and their fragments. In NP research, Liquid Chromatography-MS (LC-MS) is standard, often coupled with tandem MS (MS/MS or MSⁿ) to induce fragmentation. The resulting fragmentation patterns are chemical fingerprints [21]. Electrospray Ionization (ESI) is a soft ionization technique ideal for polar, non-volatile NPs [37]. The core challenge is the accurate, automated annotation of these fragmentation spectra to infer molecular structure.
Optimizing NMR Sensitivity and Resolution
Advanced Pulse Sequences: Phase-Incremented Steady-State Free Precession (PI-SSFP)
The pursuit of higher sensitivity in solution-state NMR has led to the re-evaluation of steady-state free precession (SSFP) sequences. While traditional Fourier Transform (FT) NMR using Ernst-angle excitations offers a robust balance, SSFP can provide a superior SNRt when longitudinal (T₁) and transverse (T₂) relaxation times are similar [35].
- Core Challenge & Solution: Conventional SSFP suffers from strong signal dependency on resonance offset and poor spectral resolution due to short repetition times (TR). The Phase-Incremented SSFP (PI-SSFP) method overcomes this by acquiring an array of M free induction decays (FIDs), where the phase of consecutive radiofrequency pulses is systematically incremented by 2πm/M (for m = 0...M-1). This phase cycling disentangles the overlapping coherence transfer pathways, allowing the reconstruction of high-resolution spectra [35].
- Sensitivity-Resolution Dichotomy: A key finding is that PI-SSFP's spectral resolution is governed not by the FID acquisition time but by the combination of the excitation flip angle (α) and the number of phase increments (M). Historically, small α angles were used to achieve high resolution, but this forfeited SSFP's inherent sensitivity advantage. Recent breakthroughs involve novel processing pipelines that stabilize the reconstruction, enabling the use of larger, more sensitive flip angles without distorting line shapes [35].
- Experimental Protocol: A typical PI-SSFP experiment involves: 1) Calibrating the 90° pulse width. 2) Setting a short repetition time (TR) significantly less than T₂. 3) Choosing a large flip angle (α, e.g., 60°) and a sufficient number of phase steps (M, e.g., 64). 4) Acquiring NS scans per phase increment. 5) Processing the M-point data set for each time-domain sample using a dedicated linear prediction and reconstruction algorithm to yield the final spectrum [35].
Autonomous Optimization of Experimental Conditions
For complex experiments targeting dynamic processes, pre-determining optimal parameters is difficult. Autonomous adaptive optimization, powered by sequential Bayesian experimental design, addresses this.
- Principle: This method treats experiment selection as an iterative decision process. After each measurement, a Bayesian inference model updates the probability distribution (posterior) of the unknown molecular parameters. The next experimental condition is chosen to maximize the expected information gain (utility function) about these parameters [36].
- Application to Chemical Exchange Saturation Transfer (CEST): CEST NMR detects sparsely populated, "invisible" conformational states of proteins (or NPs) by measuring the saturation transfer from a minor to a major state. The adaptive system autonomously optimizes three irradiation parameters: frequency offset (ω), strength (B₁), and duration (τ) [36].
- Experimental Protocol: 1) Begin with a standard reference condition. 2) Acquire a CEST spectrum. 3) Use Markov Chain Monte Carlo (MCMC) sampling to compute the posterior distribution of parameters (e.g., minor state population pB, exchange rate kex). 4) Calculate the utility function (mutual information) for a grid of possible next conditions (ω, B₁, τ). 5) Select and run the condition with maximum utility. 6) Repeat steps 2-5 for a set number of iterations. This focuses measurement time on the most informative data points, dramatically improving precision for minor state parameters [36].
Quantitative Comparison of Advanced NMR Methods
Table 1: Comparison of NMR Sensitivity and Resolution Optimization Techniques.
| Method | Key Principle | Optimal For | Typical SNRt Gain | Key Limitation |
|---|---|---|---|---|
| Traditional FT-NMR (Ernst Angle) | Fourier Transform of FID after single pulse [35]. | Routine 1D/2D experiments with sufficient sample. | Baseline (Reference) | Sensitivity limited by T₁ recovery delay. |
| Phase-Incremented SSFP (PI-SSFP) | Steady-state signal acquisition with phase cycling to resolve offsets [35]. | Samples with long, similar T₁/T₂ (e.g., small organics in non-viscous solvents). | Up to 2x over Ernst-angle [35] | Complex processing; requires stable, precise phase cycling. |
| Autonomous Adaptive CEST | Bayesian optimization of irradiation parameters to maximize info on minor states [36]. | Characterizing low-population conformational exchanges in biomolecules. | Not directly in SNRt; improves parameter precision by >50% vs. uniform sampling [36]. | Computationally intensive; requires a robust forward model of the experiment. |
| Optimal Control (OC) Pulses | Numerically designed RF pulses for uniform performance over wide bandwidths [39]. | Heteronuclear (e.g., ¹³C, ¹⁵N) experiments at very high fields (≥1 GHz). | Improved sensitivity via more complete excitation. | Pulse design required for each field and nucleus; can be power-intensive. |
Optimizing MSⁿ Fragmentation for Structural Annotation
Rule-Based and Quantum-Chemical Prediction of Pathways
Manual interpretation of MSⁿ spectra is a bottleneck. Software like ChemFrag automates this by combining rule-based fragmentation with semi-empirical quantum chemical calculations, providing chemically plausible annotations [37].
- Workflow: 1) Ionization: Generation of a protonated molecule [M+H]⁺. 2) Rule Application: A library of cleavage and rearrangement rules (e.g., retro-Diels-Alder, methyl shifts in steroids) is applied to generate candidate fragment structures. 3) Energetic Filtering: The semi-empirical PM7 method calculates heats of formation. Fragment ions are ranked and filtered based on thermodynamic stability. 4) Iterative Fragmentation: The process repeats on selected fragments, building a fragmentation tree that matches experimental m/z values [37].
- Advantage: This hybrid approach is faster than full quantum chemistry and generates more chemically realistic fragments than pure rule-based systems. For example, it correctly predicts the characteristic methyl group migration in steroid fragmentation, which is crucial for accurate annotation [37].
Molecular Networking for Dereplication and Discovery
Molecular Networking (MN) is a computational visualization tool that groups MS/MS spectra based on spectral similarity, effectively clustering compounds with related structures [21].
- Core Workflow: 1) Data Acquisition: LC-MS/MS data is collected in data-dependent acquisition (DDA) mode. 2) Feature Detection: Software (e.g., MZmine) detects chromatographic peaks and aligns MS² spectra. 3) Spectral Comparison: Cosine similarity scores compare MS² spectra. 4) Network Visualization: Spectra (nodes) are connected by edges if their similarity exceeds a threshold. This maps the "chemical space" of a sample, where closely connected clusters represent molecular families [21].
- Advanced Networking: Feature-Based MN (FBMN) integrates chromatographic alignment for better accuracy. Ion Identity MN (IIMN) links different adducts of the same molecule. Tools like Network Annotation Propagation (NAP) and MolNetEnhancer then propagate structural annotations from known nodes to unknown neighbors within the network, greatly accelerating dereplication [21].
Optimizing Visualization of MS Imaging (MSI) Data
Mass Spectrometry Imaging adds spatial dimension to MS data. Its interpretation relies heavily on accurate visualization.
- Best Practices: The use of perceptually uniform and color-vision-deficiency (CVD)-friendly colormaps is critical. Rainbow colormaps ('jet') are non-linear and can misrepresent data. Scientifically derived colormaps like cividis, viridis, or sequential maps like hot provide a linear relationship between color perception and ion abundance [40].
- Interactive Tools: Software like QUIMBI enables dynamic exploration by coloring pixels based on the spectral similarity to a user-selected reference pixel. This allows researchers to intuitively discover co-localization patterns of molecules directly from the tissue image [41].
Integrated Workflow for Natural Product Dereplication
The ultimate power of optimization is realized when NMR and MS data streams converge within the three-pillar framework.
- Integrated Workflow: 1) Taxonomy-Informed Extraction: A target organism is selected and extracted. 2) LC-MSⁿ Profiling: The crude extract is analyzed by optimized LC-MSⁿ, generating a molecular network via GNPS. 3) Rapid MS Dereplication: The network is annotated using in-silico tools (e.g., ChemFrag, NAP) and spectral libraries to flag known compounds. 4) Targeted Isolation: Nodes representing potential novel compounds are prioritized for isolation. 5) NMR Structure Elucidation: Isolated compounds are analyzed with sensitivity-optimized NMR (e.g., PI-SSFP for ¹³C, adaptive methods for dynamics). The minimal sample amount required due to optimized sensitivity allows for faster throughput. 6) Structure Validation & Database Curation: The final structure is validated by combining MS fragmentation pathways and NMR chemical shifts, then added to in-house databases for future dereplication [35] [21] [37].
The Scientist's Toolkit: Essential Reagents and Software
Table 2: Key Research Reagent Solutions for Optimized Spectroscopic Analysis.
| Category | Item | Function & Role in Optimization |
|---|---|---|
| NMR Reagents | Deuterated Solvents (e.g., DMSO-d₆, CDCl₃) | Provides a field-frequency lock and minimizes interfering ¹H signals from the solvent. |
| Chemical Shift Reference (e.g., TMS, DSS) | Provides a ppm-scale reference point (δ = 0) for reproducible chemical shift reporting [42]. | |
| Cryogenic Probes | Increases sensitivity by cooling the detector electronics, reducing thermal noise. Critical for mass-limited NP studies. | |
| MS Reagents & Standards | HPLC-grade Solvents & Buffers | Ensures low background noise and optimal ionization efficiency in LC-MS. |
| Tuning & Calibration Solutions (e.g., NaTFA, Ultramark) | Calibrates the m/z scale of the mass analyzer for accurate mass measurement. | |
| Internal Standards (isotope-labeled) | Enables relative quantification and monitors instrument performance during long runs. | |
| Software & Databases | GNPS / Molecular Networking [21] | Cloud platform for MS/MS data processing, networking, and library search. Core to dereplication. |
| ChemFrag, MetFrag, CFM-ID [37] | In-silico tools for predicting and annotating MS/MS fragmentation spectra. | |
| NMR Processing Software (e.g., TopSpin, NMRPipe) | Processes raw FID data, implements advanced processing algorithms (e.g., for PI-SSFP). | |
| Bayesian Optimization Suites [36] | Custom or in-house software (e.g., using Python with NumPy, SciPy) to run autonomous adaptive experiments. | |
| CVD-Friendly Colormaps (cividis, viridis) [40] | Essential for accurate, accessible visualization of MS Imaging data. |
Enhancing Database Queries with Focused Libraries and Predicted Data
Abstract This technical guide examines the strategic enhancement of database queries in natural product (NP) research through the integration of taxonomically focused libraries and machine learning (PC)-predicted spectroscopic data. Framed within the essential triad of dereplication—taxonomy, spectroscopy, and structural elucidation—the document details how curated, organism-specific compound libraries drastically reduce candidate search spaces. It further explores how integrating high-accuracy predicted nuclear magnetic resonance (NMR) and mass spectrometry (MS) data directly into these libraries mitigates the limitations of sparse experimental references. Complementing this, advanced database query optimization techniques, such as grouping-based association rule mining, are presented as methods to accelerate the retrieval of correlated data across these specialized knowledge bases. This synergistic approach, supported by detailed experimental protocols and performance metrics, establishes a robust, scalable infrastructure for efficient compound identification and discovery.
The identification of known compounds, or dereplication, is a critical, rate-limiting step in natural product discovery. Efficient dereplication prevents the redundant isolation and characterization of known entities, directing resources toward novel chemistry. Modern dereplication rests on three interdependent pillars: Taxonomy, Spectroscopy, and Structures.
- Taxonomy provides the biological context. Organisms within related taxa often biosynthesize structurally similar secondary metabolites. Therefore, restricting database searches to compounds reported from taxonomically related organisms provides a powerful initial filter [4].
- Spectroscopy supplies the analytical data for comparison. Primarily, NMR and MS data serve as molecular fingerprints. The core challenge is the scarcity and potential error in publicly available experimental spectra for many rare NPs [43] [44].
- Structures represent the ultimate identification goal. Structural databases link chemical entities to their taxonomic origins and reported spectral properties [4].
The convergence of these pillars is where database query enhancement occurs. A "focused library" is a subset of a structural database filtered by taxonomy (Pillar 1) and augmented with high-fidelity predicted spectral data (Pillar 2). Querying such a focused library for a candidate structure (Pillar 3) is exponentially more efficient than searching generic, unfiltered databases. This guide details the construction of these enhanced libraries, the generation of predicted data via state-of-the-art ML models, and the computational techniques to optimize queries against them.
Pillar 1: Taxonomy-Focused Library Creation
The first step is building a structurally focused library constrained by biological origin. This process leverages comprehensive NP databases that link compounds to their source organisms.
Core Methodology: The CNMRPredict Pipeline A practical methodology for creating a taxonomy-focused library with integrated predicted 13C NMR data is exemplified by the CNMRPredict toolchain [4]. The workflow is as follows:
- Taxon Definition & Structural Retrieval: A target taxon (e.g., Brassica rapa) is used to query the LOTUS database (a comprehensive, open-source NP resource linking structures to taxonomy). All associated molecular structures are retrieved in a standard file format (e.g., SDF) [4].
- Structural Curation: The raw structural list undergoes cleaning using cheminformatics tools (e.g., RDKit). Steps include deduplication (removing identical structures) and tautomer standardization (e.g., converting iminol forms to amides) to ensure consistency for subsequent prediction [4].
- Database Creation: The curated structure list is used to create a dedicated database file compatible with spectral prediction software.
- Spectroscopic Data Augmentation: Predicted 13C NMR chemical shifts for every compound in the library are generated using commercial or open-source predictors (e.g., ACD/Labs CNMR Predictor) and appended to the database records [4].
The resulting product is a searchable, taxon-specific library where every entry contains both the chemical structure and its predicted 13C NMR spectrum. This library can then be used as a primary target for dereplication queries based on experimental NMR data.
Key Research Reagent Solutions
- LOTUS Database: A fully open-source database providing validated links between NP structures and their taxonomic sources. It serves as the foundational source for building taxon-focused libraries [4].
- RDKit: An open-source cheminformatics toolkit used for critical structure curation tasks, including file format manipulation, deduplication, and tautomer standardization [4].
- ACD/Labs CNMR Predictor: Commercial software utilizing HOSE code and additive rule algorithms to predict 13C NMR chemical shifts from molecular structure, used to augment library data [4].
Pillar 2: Integration of Predicted Spectroscopic Data
To overcome the "dark matter" of metabolomics—unidentified spectra not in reference libraries—predicted spectral data is essential [45]. ML models now provide quantum-mechanics-level accuracy at a fraction of the computational cost.
3.1 NMR Chemical Shift Prediction ML has revolutionized computational NMR, primarily through two approaches: direct chemical shift prediction and enhanced correlation of calculated-experimental data [43].
Table 1: Performance of Selected NMR Chemical Shift Prediction Tools
| Tool Name | Core Technology | Prediction Target | Reported Mean Absolute Error (MAE) | Key Advantage |
|---|---|---|---|---|
| ShiftML [43] | Gaussian Process Regression (GPR) with SOAP kernel | Solid-state NMR shifts (1H, 13C, 15N, 17O) | 0.49 ppm (1H), 4.3 ppm (13C) | DFT-level accuracy for molecular solids; >1000x speedup vs DFT. |
| IMPRESSION [43] | Machine Learning trained on DFT data | Solution-state NMR shifts (1H, 13C, 15N, 19F) | ~0.1 ppm (1H), ~1.4 ppm (13C) | Focus on solution-state; active learning for optimal training. |
| CASCADE-2.0 [46] | Deep Learning (Graph Neural Network) | Solution-state 13C NMR shifts | 0.73 ppm (13C) | State-of-the-art accuracy for 13C; includes confidence metrics. |
Experimental Protocol for ML-Augmented NMR Dereplication:
- Candidate Generation: From an experimental NMR spectrum of an unknown, generate a set of plausible candidate structures.
- Shift Prediction: Use a tool like CASCADE-2.0 to predict the 13C NMR spectrum for each candidate structure [46].
- Statistical Correlation: Calculate the error (e.g., DP4 probability, MAE) between the predicted shifts for each candidate and the experimental shifts of the unknown.
- Structure Ranking: The candidate with the highest statistical probability (lowest error) is assigned as the most likely structure.
3.2 Mass Spectrum and Chromatographic Property Prediction For LC-MS based dereplication, predicting MS/MS spectra and retention times (RT) adds orthogonal identification filters.
Table 2: Performance of Selected MS & Retention Time Prediction Tools
| Tool Name | Core Technology | Prediction Target | Reported Performance | Key Advantage |
|---|---|---|---|---|
| FIORA [45] | Graph Neural Network (GNN) | MS/MS spectra, RT, Collision Cross Section | Outperforms CFM-ID, ICEBERG in spectral similarity | Predicts from bond neighborhoods; high explainability. |
| NEIMS [44] | Lightweight Neural Network | Electron-Ionization (EI) MS spectra | 91.8% recall-at-10; ~5 ms/prediction | Extreme speed for library augmentation. |
| RT-Pred [47] | Advanced Machine Learning | Liquid Chromatography Retention Time | R² ~0.91 (validation) | Customizable to any chromatographic method. |
Experimental Protocol for LC-MS Dereplication with Predicted Data:
- MS/MS Library Search: Query an experimental MS/MS spectrum against a reference library (e.g., GNPS).
- Candidate List Generation: For unmatched spectra, use in-silico tools (e.g., SIRIUS) to generate a list of plausible molecular structures.
- Spectral & RT Prediction: For each candidate, use a tool like FIORA to predict its MS/MS spectrum and RT under your specific LC method [45] [47].
- Consensus Scoring: Rank candidates based on a composite score weighing the similarity between experimental and predicted MS/MS spectra and the deviation between experimental and predicted RT.
Pillar 3: Optimizing Queries Across Structural Databases
As libraries grow and integrate multiple data dimensions (structure, taxonomy, predicted spectra), query efficiency becomes paramount. Data sparsity—where most queries access only a small subset of tables or columns—is a major performance bottleneck [48].
Methodology: Grouping-Based Association Rule Mining (GARMT) The GARMT approach optimizes queries by predicting future data needs based on historical access patterns [48].
- Query Grouping: Consecutive SQL queries from a workload (e.g., a dereplication session querying structure, taxonomy, and spectrum tables) are grouped into logical sets.
- Pattern Mining: A modified FP-Growth algorithm identifies frequent itemsets of tables accessed together within these groups [48].
- Rule Generation & Prediction: Association rules (e.g., {TaxonomyTable, StructureTable} -> {SpectraTable}) are extracted. When a query accesses the initial table set, the system can pre-fetch or cache the predicted subsequent table.
- Performance Gain: This method reduces query runtime by up to 40% in sparse database environments by minimizing redundant I/O operations [48].
Experimental Protocol for Implementing Query Optimization:
- Workload Logging: Collect a log of SQL queries executed against your NP database over a significant period.
- Apply Grouping Algorithm: Implement the GARMT grouping logic to cluster sequential queries into sessions (e.g., based on user session ID or temporal windows) [48].
- Mine Access Patterns: Run the GFP-Growth algorithm on the grouped table-access data to find frequent co-access patterns.
- Integrate Predictor: Implement a lightweight module in your database application that uses the derived rules to pre-fetch data likely to be requested next.
Integrated Workflow: A Synergistic Query Enhancement System
The true power of this approach is realized when the three pillars are combined into a cohesive system. A researcher begins with an unknown compound from a specific source organism.
- Taxonomic Filtering: The source organism's taxonomy is used to select or generate a focused compound library from a master structural database like LOTUS [4]. This reduces the candidate pool from millions to thousands or hundreds.
- Analytical Data Matching: The experimental spectroscopic data (NMR, MS, RT) of the unknown is compared against the library. Critically, this comparison uses both stored experimental data and on-the-fly or pre-computed predictions from tools like CASCADE-2.0 and FIORA for candidates lacking experimental references [46] [45].
- Optimized Query Execution: Underlying the entire process, a query optimization system like GARMT learns that accessing a compound's structure record frequently leads to subsequent requests for its spectral data and taxonomic source. It pre-fetches this correlated data, making the search across the focused library fast and efficient [48].
This integrated workflow transforms dereplication from a linear, hit-or-miss search into a parallel, predictive, and highly efficient computational identification process.
Enhancing database queries with focused libraries and predicted data represents a paradigm shift in natural product research. By constraining searches biologically, augmenting libraries with accurate in-silico predictions, and optimizing the underlying data retrieval mechanics, researchers can achieve unprecedented dereplication speed and accuracy.
Future advancements will likely involve:
- Tighter Integration: Seamless, real-time prediction APIs embedded directly within database query engines.
- Multi-Modal Prediction Models: Unified models that predict NMR, MS, RT, and other properties simultaneously for consistent candidate scoring.
- Explainable AI (XAI): ML models that provide not just predictions but also chemically interpretable reasoning for fragmentation pathways or shift assignments, increasing trust in the results [45].
The construction of these enhanced, intelligent databases is not merely a technical exercise but a foundational step toward comprehensively mapping the chemical universe of natural products.
Leveraging AI and Machine Learning for Improved Prediction and Efficiency
The discovery of bioactive molecules from nature remains a cornerstone of modern therapeutics, with natural products (NPs) and their derivatives constituting a significant proportion of approved drugs [49]. However, the traditional workflow is plagued by inefficiencies: the repeated discovery of known compounds (dereplication), the challenging identification of source organisms (taxonomy), and the arduous elucidation of complex chemical architectures (spectroscopy structures) [50]. These three interdependent challenges—dereplication, taxonomy, and spectroscopy structure determination—form the critical pillars of NP research. Their resolution is bottlenecked by the multimodal, fragmented, and unstandardized nature of NP data [50].
Artificial Intelligence (AI) and Machine Learning (ML) are emerging as transformative forces capable of integrating these pillars into a cohesive, predictive discovery engine. This technical guide posits that the path to unprecedented efficiency lies in constructing unified computational frameworks. By applying ML to curated, multimodal datasets, researchers can shift from sequential, labor-intensive experiments to parallel, model-guided workflows. This enables the anticipation of novel bioactive chemistry—predicting an organism's metabolome from its genome, a compound's structure from its spectra, or its bioactivity from its structural fingerprints—before committing costly laboratory resources [49] [50]. The subsequent sections detail the technical architectures, experimental protocols, and toolkits required to operationalize this AI-driven vision for the next generation of natural product discovery.
Technical Foundations: Architectures for Integrating Multimodal Data
The fundamental challenge in applying AI to NP science is data structure. NP data is inherently multimodal, encompassing genomic sequences, taxonomic classifications, mass spectral fragmentation patterns, NMR chemical shifts, and bioassay results [50]. Traditional ML models, which require fixed-feature, tabular data, struggle with this complexity. The solution lies in two advanced architectures: knowledge graphs and graph neural networks (GNNs).
The Central Role of Knowledge Graphs
A Natural Product Science Knowledge Graph is a semantically structured network that connects entities (nodes) and their relationships (edges) across all data modalities [50]. For example, a single natural product compound node can be linked to: a taxonomic node for its source organism; several spectral nodes for its MS/MS and NMR data; genomic nodes for its biosynthetic gene cluster (BGC); and bioactivity nodes from assay results. This structure mirrors a scientist's associative reasoning and is machine-readable.
The construction of such a graph involves:
- Entity Resolution: Standardizing identifiers for compounds (e.g., InChIKey), organisms (via taxonomic backbones like the GBIF) [51], and spectral features.
- Relationship Mapping: Defining explicit links (e.g., "produces," "hasfragmentationpattern," "inhibits_target") using ontologies.
- Data Integration: Ingesting and linking disparate public and proprietary datasets into the graph schema.
Table 1: Core Components of a Natural Product Knowledge Graph
| Node Type | Example Entities | Key Attributes | Primary Data Source |
|---|---|---|---|
| Chemical Compound | Berberine, Paclitaxel | Molecular fingerprint, weight, logP, stereochemistry | COCONUT, PubChem, in-house libraries |
| Organism | Penicillium rubens, Taxus brevifolia | Taxonomic lineage, geographic location, genotype | GBIF, GenBank, specimen databases |
| Spectral Data | MS/MS spectrum, 1H-NMR spectrum | m/z values, intensities, chemical shifts, coupling constants | GNPS, Metabolomics Workbench |
| Biosynthetic Gene Cluster (BGC) | PKS, NRPS cluster | DNA sequence, predicted substrate specificity, cluster type | MIBiG, antiSMASH outputs |
| Biological Target | HER2 kinase, 20S proteasome | Protein sequence, 3D structure (e.g., AlphaFold), pathway | UniProt, PDB |
As illustrated in the conceptual workflow below, a knowledge graph integrates disparate data from the three research pillars into a single, queryable resource, forming the foundation for all downstream AI models [50].
Machine Learning on Graphs: GNNs and Embeddings
Once data is structured within a knowledge graph, Graph Neural Networks (GNNs) become the primary tool for inference. GNNs operate by passing messages between connected nodes, allowing each node's representation (or embedding) to be informed by its local network neighborhood [49] [52]. This is powerful for NP discovery:
- Link Prediction: A GNN can predict missing edges, such as proposing a plausible biological target for an uncharacterized compound based on its structural similarity to other compounds with known targets.
- Node Classification: It can classify unlabeled nodes, for instance, predicting the most likely taxonomic family for an unknown microbial extract based on its metabolic profile linked to other characterized extracts.
- Graph Generation: Advanced models can generate subgraphs representing novel, synthetically feasible NP-inspired scaffolds constrained by desired properties [49].
Experimental Protocols & Quantitative Workflows
Translating the theoretical framework into practice requires standardized experimental-computational workflows. The following section details a protocol for AI-driven virtual screening and a quantitative analysis of ML model performance.
Protocol: AI-Driven Virtual Screening for Natural Product Lead Identification
This protocol outlines a structure-based screening pipeline to identify novel NP-derived geroprotectors, adapting methodologies from recent research [53].
1. Objective: To screen the COCONUT natural products database for compounds with predicted geroprotective activity using a trained ML classifier.
2. Materials & Data:
- Positive Set: 206 confirmed geroprotectors from the Geroprotectors database (http://geroprotectors.org/).
- Negative Set: 199 compounds with no reported geroprotective activity (randomly sampled from drug-like chemical space).
- Screening Library: The COCONUT database, containing ~695,000 unique natural product structures [53].
- Software: DataWarrior (for descriptor calculation), Python/scikit-learn (for model building), RDKit (for cheminformatics).
3. Experimental Procedure:
- Step 1 - Descriptor Calculation & Curation: Calculate 1D-3D molecular descriptors (e.g., molecular weight, cLogP, number of rotatable bonds, topological polar surface area) for all compounds in the training and screening sets. Apply PCA and feature selection to reduce dimensionality and avoid overfitting [53].
- Step 2 - Model Training & Validation: Split the labeled dataset (positive + negative) 80:20 for training and testing. Train three distinct classifier models: Support Vector Machine (SVM), Decision Tree (DT), and k-Nearest Neighbors (KNN). Optimize hyperparameters via grid search. Validate using 5-fold cross-validation and evaluate based on Accuracy, Specificity, Recall, and AUC-ROC [53].
- Step 3 - Consensus Screening: Apply all three trained models to the entire COCONUT database. To ensure high confidence, retain only compounds predicted as positive by all three models.
- Step 4 - Leadlikeness & Toxicity Filtering: Filter the consensus hits using standard medicinal chemistry filters (e.g., "Lipinski's Rule of Five," Veber criteria) and in-silico toxicity alerts to prioritize promising lead-like candidates for experimental validation [53].
4. Output: A curated, high-priority list of novel natural product candidates with predicted geroprotective activity, ready for in vitro testing in relevant aging models.
Table 2: Performance Metrics of ML Classifiers in NP Screening Study [53]
| Machine Learning Model | Accuracy | Specificity | Recall (Sensitivity) | AUC-ROC | Key Strength |
|---|---|---|---|---|---|
| Decision Tree (DT) | 0.61 | 0.60 | 0.62 | 0.62 | High interpretability of rules. |
| Support Vector Machine (SVM) | 0.67 | 0.54 | 0.85 | 0.73 | Best overall predictive performance. |
| k-Nearest Neighbors (KNN) | 0.65 | 0.56 | 0.77 | 0.64 | Effective capture of local similarity. |
| Consensus (DT+SVM+KNN) | - | Very High | Moderate | - | Maximizes confidence in predictions. |
The workflow below visualizes this multi-stage pipeline, from data preparation to final candidate selection.
Enhancing Spectroscopic Structure Elucidation
AI dramatically accelerates the interpretation of spectroscopic data, the core of structure determination. Deep learning models are now trained on vast libraries of known MS/MS and NMR spectra paired with their corresponding structures.
- MS/MS De Novo Annotation: Tools like SIRIUS+CSI:FingerID use ML to predict molecular fingerprints directly from fragmentation spectra, which are then searched against structural databases for a match, achieving high accuracy in compound class and even precise structure identification [50].
- NMR Chemical Shift Prediction: GNNs trained on known 3D structures and their experimental NMR shifts can predict shifts for novel compounds with high precision. This creates a powerful feedback loop: predicted shifts for a candidate structure are compared to experimental data, and the structure is refined or ranked based on the discrepancy.
The Scientist's Toolkit: Essential Research Reagent Solutions
Implementing the aforementioned workflows requires a combination of advanced hardware, specialized software, and curated data resources.
Table 3: Essential Research Reagent Solutions for AI-Enhanced NP Research
| Category | Tool/Resource | Specific Function | Application in NP Research |
|---|---|---|---|
| Instrumentation & Analysis | Veloci A-TEEM Biopharma Analyzer (Horiba) [19] | Simultaneously collects Absorbance, Transmittance, and Fluorescence Excitation-Emission Matrix (A-TEEM) data. | Rapid characterization of protein therapeutics (e.g., mAbs) and analysis of complex NP mixtures without separation. |
| Quantum Cascade Laser (QCL) Microscope (e.g., LUMOS II) [19] | Provides high-resolution infrared spectral imaging. | Label-free chemical imaging of tissue samples or microbial colonies to localize NP production and study its spatial distribution. | |
| Broadband Chirped Pulse Microwave Spectrometer (BrightSpec) [19] | Measures rotational spectra for unambiguous 3D structure determination in gas phase. | Definitive configurational analysis of small, volatile natural products or synthetic derivatives. | |
| AI/ML Software & Platforms | Graph Neural Network (GNN) Libraries (PyTorch Geometric, DGL) | Framework for building ML models on graph-structured data. | Developing custom models for link prediction and classification on NP knowledge graphs [50]. |
| Retrosynthesis Planning Software (e.g., ASKCOS, AiZynthFinder) | Uses AI to propose synthetic routes for target molecules. | Planning feasible synthetic routes for novel NP hits or key analogs, assessing synthetic tractability early [49]. | |
| Explainable AI (XAI) Tools (SHAP, LIME) | Interprets predictions of complex ML models (e.g., "why did the model label this compound as active?"). | Builds trust in AI predictions and guides medicinal chemistry SAR by highlighting responsible substructures [49]. | |
| Critical Data Resources | COCONUT Database [53] | Open database of ~695,000 unique natural product structures. | Primary source for virtual screening and training generative models on NP chemical space. |
| Global Biodiversity Information Facility (GBIF) [51] | International network providing global taxonomic and occurrence data. | Provides the taxonomic backbone for linking organisms to chemistry, crucial for bioprospecting and ecological studies. | |
| GNPS (Global Natural Products Social Molecular Networking) | Public repository and ecosystem for mass spectrometry data. | Community resource for spectral matching, dereplication, and sharing experimental MS/MS data to train AI models [50]. |
Challenges and Future Trajectories
Despite its promise, the full integration of AI into NP research faces significant hurdles. Data scarcity and heterogeneity for many NP classes limit model generalizability [50]. Algorithmic bias can occur if models are trained on non-representative data, favoring well-studied chemical classes. The "black-box" nature of complex models like deep neural networks raises issues of interpretability, which is critical for scientific trust and regulatory approval [54] [52].
Future progress depends on addressing these challenges through:
- Community-Driven Data Standardization: Widespread adoption of computable taxonomies [51], standardized metadata, and open data sharing to build the comprehensive, high-quality knowledge graphs necessary for robust AI [50].
- Development of Explainable AI (XAI): Creating models that not only predict but also provide chemically and biologically intuitive explanations for their predictions, turning AI from a oracle into a collaborative partner for the scientist [49].
- Integration with Robotic Automation: Closing the loop between in-silico prediction and physical validation by coupling AI prioritization platforms with automated, high-throughput isolation and assay systems.
The convergence of AI/ML with the three foundational pillars of natural product research—dereplication, taxonomy, and spectroscopy structure determination—is forging a new paradigm. By constructing unified knowledge graphs and applying sophisticated graph-based learning, researchers can transition from a slow, serial process of trial-and-error to an efficient, parallelized engine for anticipatory discovery. This technical guide has outlined the architectures, protocols, and tools required to deploy this approach. While challenges in data quality and model interpretability remain, the trajectory is clear: AI is not merely an auxiliary tool but is becoming the central, integrative framework that will unlock the next wave of innovation in natural product-based drug discovery and beyond.
Ensuring Accuracy: Validating and Comparing Dereplication Methods
Validation Protocols for Confirming Dereplication Results
The systematic discovery of bioactive natural products rests on three interdependent pillars: Taxonomy, Spectroscopy, and Structures. Dereplication—the rapid identification of known compounds within complex extracts—operates at the convergence of these pillars, preventing redundant rediscovery and guiding resource-efficient isolation [55]. However, a putative spectral match is merely a hypothesis. Validation protocols are the critical, often underemphasized, step that confirms this hypothesis, transforming dereplication from a screening tool into a reliable foundation for discovery. This guide details the core experimental frameworks for validating dereplication results, ensuring that spectroscopic predictions are substantiated by chemical and biological reality. It frames these protocols within the holistic research thesis where accurate taxonomy informs sourcing, advanced spectroscopy enables identification, and structural confirmation paves the way for bioactivity assessment and development.
Foundational Concepts in Dereplication Validation
Validation in dereplication moves beyond database matching to establish compound identity and biological relevance through orthogonal analytical and functional assays. The core principle is that evidence must be gathered from multiple, independent domains.
- Orthogonal Analytical Confirmation: A compound tentatively identified via LC-MS/MS and molecular networking must be confirmed by a separate analytical technique, most definitively by comparison with an authentic standard using techniques like HPLC-PDA (Photodiode Array) for UV profile and retention time matching [55]. For final structural proof, especially of novel entities, advanced NMR analysis is indispensable. Research indicates that reporting ¹H NMR parameters with high precision (δ to 0.1–1 ppb, J-coupling to 10 mHz) is essential for creating unambiguous, reproducible spectral fingerprints that allow for definitive dereplication and avoid misidentification [56].
- Biological Relevance Verification: A dereplicated compound is only significant if it contributes to the observed bioactivity of the crude extract. Validation requires dose-response testing of the pure compound in the same biological assay used for the extract [55]. The compound's effect should mirror or explain the extract's activity. Furthermore, assessing its cytotoxicity at bioactive concentrations is crucial to distinguish specific modulation from general cell death [55].
- Quantitative Context: Validation is incomplete without understanding the compound's abundance. Quantification (e.g., via HPLC-PDA or qNMR) within the active extract determines if the compound is present in sufficient quantity to be a major active principle or a minor contributor [55].
Core Validation Protocols and Experimental Methodologies
This section outlines detailed experimental workflows for key validation steps, based on established research practices [55].
Orthogonal Analytical Confirmation Protocol
Aim: To confirm the chemical identity of a compound putatively identified by HRMS/MS and molecular networking.
Protocol:
- Standard Acquisition: Source an authentic commercial standard of the dereplicated compound. If unavailable, proceed with isolation.
- Co-Chromatography:
- Prepare a sample containing the active crude extract.
- Prepare a separate sample of the authentic standard.
- Prepare a third sample spiking the crude extract with the authentic standard.
- Analyze all three samples using identical HPLC-PDA conditions [55].
- Validation Criterion: The peak in the crude extract must show co-elution (identical retention time) with the standard in the spiked sample. Its UV-Vis spectrum (PDA) must be superimposable with that of the pure standard.
- Advanced NMR Profiling (for novel or ambiguous structures):
- Isolate the compound of interest via semi-preparative HPLC or column chromatography.
- Acquire high-resolution 1D and 2D NMR spectra (¹H, ¹³C, COSY, HSQC, HMBC).
- Perform iterative full spin analysis (HiFSA) to achieve quantum-mechanically precise ¹H NMR parameters [56].
- Validation Criterion: The complete NMR dataset must be consistent with the proposed structure. For known compounds, data must match literature values with high precision (δ ± 0.001 ppm) [56].
Biological Relevance Verification Protocol
Aim: To establish that the dereplicated compound is responsible for, or contributes significantly to, the bioactivity of the parent extract.
Protocol (Exemplified with an Anti-Inflammatory Assay) [55]:
- Cell-Based Activity and Cytotoxicity Screening:
- Use a relevant cell line (e.g., murine macrophage J774 cells for inflammation).
- Perform an MTT assay to determine cell viability. Seed cells in a 96-well plate, treat with a range of concentrations of the crude extract and the pure compound (e.g., 10-100 µg/mL), incubate for 24h, add MTT reagent, and measure absorbance at 570nm after solubilization [55].
- Calculate IC₅₀ values for cytotoxicity. Select a non-cytotoxic concentration (e.g., 50 µg/mL for extract) for subsequent bioactivity assays [55].
- Gene Expression Analysis (RT-qPCR):
- Stimulate cells with an appropriate agent (e.g., 100 ng/mL LPS for macrophages).
- Co-treat with the test compound/extract at the non-cytotoxic concentration.
- After incubation (e.g., 8h), isolate total RNA, synthesize cDNA, and perform quantitative PCR using primers for target genes (e.g., IL-6, TNF-α, COX-2, iNOS) [55].
- Analyze data using the ΔΔCₜ method to determine fold-change in expression relative to stimulated controls.
- Protein Secretion Analysis (ELISA):
- Treat cells as for RT-qPCR but collect the cell culture supernatant.
- Use enzyme-linked immunosorbent assay (ELISA) kits to quantify the secretion of specific proteins (e.g., IL-6, TNF-α, MCP-1) [55].
- Perform dose-response experiments with the pure compound to determine its potency (EC₅₀/IC₅₀).
- Validation Criteria: The pure compound must (a) exhibit activity in the same assay as the crude extract, (b) show a dose-dependent response, and (c) demonstrate an effect magnitude that is plausible given its concentration in the extract.
Table 1: Key Quantitative Parameters for Analytical Validation
| Validation Parameter | Target Precision / Requirement | Primary Analytical Technique | Purpose |
|---|---|---|---|
| Retention Time (tᵣ) | Co-elution with standard (RSD < 1%) | HPLC-PDA / UPLC-UV [55] | Confirms identity based on physicochemical properties. |
| High-Resolution Mass | Δ ppm < 3 | HRMS (LC-QTOF/MS) [55] | Confirms elemental composition. |
| ¹H NMR Chemical Shift (δ) | Reported to 0.1-1 ppb (0.0001-0.001 ppm) [56] | NMR with HiFSA analysis [56] | Provides unambiguous fingerprint for structure verification. |
| ¹H NMR J-Coupling | Reported to 10 mHz (0.01 Hz) [56] | NMR with HiFSA analysis [56] | Essential for stereochemical and conformational analysis. |
Table 2: Core Metrics for Biological Validation (Example: Anti-Inflammatory Activity)
| Biological Metric | Assay Type | Measurement | Interpretation for Validation |
|---|---|---|---|
| Cytotoxicity | MTT / Cell Viability [55] | IC₅₀ (µg/mL) | Ensures bioactivity is not due to general cell death. |
| Gene Expression Inhibition | RT-qPCR [55] | % Reduction vs. LPS control (e.g., IL-6 mRNA) | Confirms modulation of transcription for key pathways. |
| Protein Secretion Inhibition | ELISA [55] | IC₅₀ (µM or µg/mL) for cytokine (e.g., IL-6) secretion | Quantifies functional, dose-dependent potency of pure compound. |
| Activity in Crude Extract | Bioassay-guided fractionation | Activity tracked to fraction containing compound | Links the compound directly to the source extract's activity. |
Visualizing the Validation Workflow and Biological Context
Dereplication Validation Protocol Decision Workflow
Inflammatory Pathway and Bioassay Validation Points
The Scientist's Toolkit: Essential Research Reagents and Materials
Table 3: Key Research Reagent Solutions for Dereplication Validation
| Category | Reagent / Material | Function in Validation Protocol |
|---|---|---|
| Cell Culture & Viability | J774 murine macrophage cell line [55] | Model system for immunomodulatory activity screening (e.g., anti-inflammatory assays). |
| Lipopolysaccharides (LPS) [55] | Standard stimulant to induce pro-inflammatory response in immune cells for assay context. | |
| MTT (3-(4,5-Dimethylthiazol-2-yl)-2,5-Diphenyltetrazolium Bromide) [55] | Reagent for colorimetric measurement of cell metabolic activity, used to determine cytotoxicity. | |
| Molecular Biology | TRIzol or equivalent RNA isolation reagent | For extracting total RNA from treated cells for subsequent gene expression analysis. |
| Reverse transcription and quantitative PCR (qPCR) kits [55] | For synthesizing cDNA and quantifying mRNA levels of target genes (e.g., IL-6, TNF-α). | |
| Protein Analysis | ELISA kits for specific cytokines (e.g., murine IL-6, TNF-α) [55] | For quantifying the secretion of specific protein mediators into cell culture supernatant. |
| Chromatography & Analysis | HPLC/UPLC-grade solvents (Acetonitrile, Methanol, Water) | Mobile phases for analytical and preparative chromatography. |
| Authentic chemical standards (e.g., Rutin, Chlorogenic acid) [55] | Crucial references for co-chromatography and confirmation of compound identity via HPLC-PDA. | |
| Deuterated NMR solvents (e.g., DMSO-d₆, CD₃OD) | Solvents for acquiring high-resolution NMR spectra for structural validation. | |
| Software & Databases | Global Natural Products Social Molecular Networking (GNPS) [55] | Platform for MS/MS data organization, dereplication, and visualization via molecular networking. |
| PERCH NMR software or equivalent [56] | For performing quantum-mechanical iterative full spin analysis (HiFSA) to achieve precise NMR parameters. | |
| Chemical databases (SciFinder, Reaxys, PubChem) | For sourcing spectral data of known compounds and literature for comparison. |
The modern landscape of scientific research, particularly in specialized fields like natural product (NP) dereplication, is fundamentally shaped by the databases used to store, organize, and interrogate chemical and biological data. The choice between public (open-source) and commercial (proprietary) database systems represents a critical strategic decision for research institutions and pharmaceutical development teams. This decision influences not only operational cost and flexibility but also the pace of innovation and the ability to integrate novel analytical workflows.
This analysis situates the comparison of database tools within the essential three pillars of NP dereplication research: taxonomy (organism sourcing and classification), spectroscopy (mass spectrometry and nuclear magnetic resonance data), and structural elucidation (chemical entity identification). Effective dereplication—the rapid identification of known compounds to prioritize novel entities—relies on seamless interaction between databases supporting these pillars. The evolution of these databases, driven by both community-driven open-source projects and vendor-led commercial development, now offers researchers a spectrum of tools with varying capabilities in scalability, specialized functionality, and compliance support.
Core Architectural and Functional Comparison
The fundamental differences between public and commercial databases extend beyond licensing to encompass development models, support structures, and core architectural philosophies. As of December 2025, the database landscape includes 427 managed systems, with open-source tools demonstrating significant market penetration [57]. The popularity and adoption of these systems, however, vary considerably based on their underlying database model and intended use case.
Table 1: Foundational Comparison of Public vs. Commercial Databases
| Aspect | Public/Open-Source Databases | Commercial/Proprietary Databases |
|---|---|---|
| Licensing & Cost | Typically free under licenses (e.g., GPL, Apache). No upfront licensing fees [58]. | Require expensive licensing, subscription, or per-user/core fees [58]. |
| Customization & Flexibility | Full access to source code allows deep customization and optimization for specific needs [58]. | Limited customization; modifications depend on vendor support, often incurring additional cost [58]. |
| Support Model | Community-driven: forums, public documentation, user-contributed patches. Commercial support available from third parties [58]. | Vendor-provided: dedicated support, service-level agreements (SLAs), and professional services [58]. |
| Innovation Driver | Global community of contributors; rapid feature iteration and incorporation of cutting-edge enhancements [58]. | Vendor’s internal R&D roadmap; features aligned with broad market demand and strategic vision [57]. |
| Security & Transparency | Code is auditable; security relies on public scrutiny and rapid community patching [58]. | “Security through obscurity”; dependent on vendor’s proprietary audits and patch schedules [58]. |
| Vendor Lock-in Risk | Minimal; data portability and self-management are inherent [59]. | High; deep integration with vendor ecosystem and proprietary formats can hinder migration [58]. |
The popularity trend shows open-source systems maintaining a strong and growing presence, largely due to their adoption in cloud-native and internet-scale applications [57]. The top systems in each category underscore different strengths: commercial leaders like Oracle and Microsoft SQL Server dominate in traditional, high-stakes enterprise environments, while open-source leaders MySQL and PostgreSQL power a vast portion of the web’s infrastructure [57].
Application in Natural Product Dereplication: The Three Pillars
The process of NP dereplication is a multidisciplinary challenge that efficiently intersects the three core pillars. Databases must not only store data but also enable complex queries across taxonomic, spectral, and chemical domains.
Pillar I: Taxonomy Databases
Taxonomic databases link biological source material (e.g., plant, marine organism, microbe) to reported chemical constituents and bioactivities. Public resources like the Global Biodiversity Information Facility (GBIF) offer open access to specimen records, while commercial natural product libraries, such as those curated by Dictionary of Natural Products (DNP), provide highly curated, cross-referenced data linking species to compounds with stringent quality control.
Pillar II: Spectroscopy Databases
These databases house reference spectral data, primarily from Mass Spectrometry (MS) and Nuclear Magnetic Resonance (NMR). Public repositories like GNPS (Global Natural Products Social Molecular Networking) and MassBank are community-driven platforms where researchers contribute and share spectra, fostering collaborative identification [60]. Commercial counterparts, such as SCIQS and those embedded in vendor software (e.g., Bruker, Waters), offer rigorously validated, instrument-tuned libraries often with advanced search algorithms and integration with proprietary analytical hardware.
Pillar III: Structural Databases
Structural databases are the cornerstone, storing chemical structures, properties, and biological activities. Public databases like PubChem and ChEMBL provide immense, freely accessible collections. Commercial structural databases, including SciFinder and Reaxys, differentiate themselves through expert curation, richer data interconnection (reactions, synthesis protocols, patented data), and powerful, intuitive search interfaces designed for complex substructure and similarity queries.
Table 2: Database Tools Aligned with Dereplication Research Pillars
| Research Pillar | Public Database Examples | Commercial Database Examples | Key Differentiating Factors |
|---|---|---|---|
| Taxonomy | GBIF, NCBI Taxonomy | Dictionary of Natural Products (DNP), CRC Ethnobotany DB | Curatorial Depth: Commercial tools offer expert-linked organism-compound data. Access: Public tools provide broader, less curated specimen records. |
| Spectroscopy (MS/NMR) | GNPS, MassBank, HMDB | SCIQS, ACD/Labs Spectra DB, Vendor Libraries (Bruker, Waters) | Spectral Quality & Search: Commercial libraries are often instrument-specific and validated. Innovation: Public platforms enable novel community-driven workflows like molecular networking [60]. |
| Chemical Structures | PubChem, ChEMBL, ZINC | SciFinder, Reaxys, Marvin DB | Data Scope & Links: Commercial tools include patents, reaction steps, and predicted properties. Accessibility & Cost: Public tools are universally accessible but may lack deep inter-data relationships. |
The integration of these pillars is where the most advanced dereplication occurs. Hyphenated analytical platforms combining chromatography with spectroscopy generate multi-dimensional data that require databases capable of unified queries [61]. The trend is toward open data initiatives and cloud-based workflows that can seamlessly pull from both public and commercial sources to rank compounds by novelty and bioactivity [60].
Diagram 1: Integrated Dereplication Workflow (Max width: 760px)
Experimental Protocols for Database-Enabled Dereplication
The following protocol outlines a standard mass spectrometry-based dereplication workflow leveraging both public and commercial databases.
Protocol: LC-MS/MS-Based Dereplication Using Hybrid Database Querying
1. Sample Preparation & Data Acquisition:
- Material: Natural product extract (e.g., microbial fermentation pellet or plant tissue extract).
- Reagent: LC-MS grade solvents (water, acetonitrile, methanol) with 0.1% formic acid.
- Instrumentation: High-resolution LC-MS/MS system (e.g., Q-TOF or Orbitrap).
- Method: Perform reverse-phase chromatography (C18 column). Acquire data in data-dependent acquisition (DDA) mode, fragmenting top ions in each cycle.
2. Data Pre-processing:
- Use software (e.g., MZmine, Progenesis QI, or vendor-specific tools) for peak picking, deisotoping, and alignment.
- Export a feature table containing mass-to-charge ratio (m/z), retention time (RT), and MS/MS fragmentation spectra for each detected compound.
3. Sequential Database Querying: This step embodies the hybrid approach.
- Step A: Public Database Search.
- Tool: Upload the feature list to the GNPS platform [60].
- Workflow: Execute a MASST search against public spectral libraries. Use the Molecular Networking tool to visualize spectral similarity clusters, which can prioritize unknown clusters for novel compounds.
- Output: Candidate matches with cosine similarity scores.
- Step B: Commercial Database Search.
- Tool: Import the same data into a commercial tool like SCIEX OS or Bruker Metaboscape with integrated proprietary libraries.
- Workflow: Search against curated, vendor-validated spectral libraries. Apply advanced filters (e.g., retention time prediction, isotope pattern matching).
- Output: Curated candidate list with confidence scores.
4. Data Triangulation & Structural Annotation:
- Cross-reference results from both searches. Consensus matches are high-confidence identifications.
- For unknowns or discordant results, use commercial structural database tools (e.g., SciFinder or Reaxys) to search the molecular formula or putative structure derived from in-silico fragmentation tools (e.g., CSI:FingerID).
- Validation: For critical novel candidates, proceed with large-scale isolation and NMR-based structure elucidation [61].
The Scientist's Toolkit: Essential Research Reagents & Solutions
Table 3: Key Reagent Solutions for Database-Driven NP Research
| Item / Solution | Function in Dereplication Workflow | Example & Notes |
|---|---|---|
| LC-MS Grade Solvents | Mobile phase for chromatographic separation of complex NP extracts. Ensures minimal background noise. | Acetonitrile, Methanol, Water with 0.1% Formic Acid (for positive ion mode). |
| Reference Standard Compounds | Essential for validating database matches and calibrating instruments (retention time, MS/MS spectrum). | Commercially available pure compounds (e.g., from Sigma-Aldrich) for key expected metabolite classes. |
| Deuterated NMR Solvents | Required for dissolving samples for structural validation via 1D/2D NMR spectroscopy, the definitive method for novel compound confirmation [61]. | Deuterated Chloroform (CDCl3), Deuterated Methanol (CD3OD), Deuterium Oxide (D2O). |
| Database Subscription / Access | The core "reagent" for in-silico identification. Provides the reference data for comparison. | Public: GNPS, PubChem. Commercial: SciFinder, Reaxys, Dictionary of Natural Products. |
| Data Processing Software | Transforms raw instrument data into searchable feature lists (m/z, RT, MS/MS). | Open-source: MZmine, OpenMS. Commercial: Compound Discoverer, MassHunter, UNIFI. |
Future Directions and Strategic Considerations
The trajectory of database development points toward increased interoperability and artificial intelligence (AI) integration. A significant trend is the emergence of cloud-native, fully managed services for open-source databases (e.g., Amazon RDS for PostgreSQL, Google Cloud SQL), which blend the cost and flexibility benefits of open-source with the operational simplicity of commercial offerings [59]. This model is particularly attractive for research consortia requiring scalable, collaborative platforms.
In the pharmaceutical commercial sphere, specialized analytics platforms like Veeva Commercial Cloud and IQVIA OCE demonstrate the power of commercial tools to integrate proprietary data (e.g., prescription claims, HCP engagement) with analytics for strategic decision-making [62]. While not directly used for early-stage dereplication, this ecosystem represents the commercial destiny of successfully developed NP drugs and highlights the value of structured, compliant data management.
For research organizations, the strategic choice is no longer binary. A hybrid architecture is optimal: leveraging robust, scalable open-source databases (like PostgreSQL or MongoDB) to manage in-house experimental data and pipeline results [58], while maintaining targeted subscriptions to commercial databases for specialized, high-value queries during the critical phases of structure annotation and novelty assessment. This approach maximizes financial resources, fosters innovation through community tools, and ensures access to the highest quality curated data when it matters most.
Benchmarking Spectroscopic and Computational Approaches
The systematic discovery and characterization of natural products (NPs) rest upon three foundational pillars: taxonomy (the biological source), spectroscopy (the analytical data), and structures (the elucidated chemical entity). Dereplication—the rapid identification of known compounds within complex mixtures—is the critical process that integrates these pillars to avoid redundant research and accelerate the discovery of novel bioactive molecules [63]. In contemporary research, benchmarking is not merely a performance check but a rigorous framework that evaluates and compares the accuracy, efficiency, and applicability of the spectroscopic and computational tools at the heart of this integration [61].
The inherent complexity of NP extracts, coupled with the exponential growth of spectral and structural databases, has rendered traditional, manual dereplication obsolete. Modern workflows are defined by high-throughput hyphenated techniques (e.g., LC-MS/MS) and sophisticated in silico prediction models [61] [64]. Benchmarking these approaches is essential to answer pressing questions: Which algorithm most accurately predicts a structure from a mass spectrum? Which spectroscopic technique offers the best sensitivity for a given compound class? How do computational predictions fare against experimental validation? By establishing standardized metrics and comparative analyses, benchmarking guides researchers in selecting optimal methodologies, validates new tools, and ultimately builds a more reliable and automated pipeline for NP-based drug discovery [65] [66].
Benchmarking Spectroscopic Techniques and Hyphenated Platforms
Spectroscopic benchmarking focuses on the sensitivity, resolution, and reproducibility of analytical platforms, primarily liquid or gas chromatography coupled with mass spectrometry (LC-MS, GC-MS) or nuclear magnetic resonance (NMR), for detecting and quantifying NPs in complex matrices [61].
Key Performance Metrics
The performance of spectroscopic methods is quantitatively assessed against several criteria:
- Sensitivity: Measured as the limit of detection (LOD) and limit of quantification (LOQ) for target analytes.
- Resolution: The ability to separate and distinguish between co-eluting compounds with similar mass-to-charge (m/z) ratios, often benchmarked using standardized complex mixtures.
- Spectral Fidelity: The reproducibility and accuracy of fragmentation patterns (MS/MS spectra) or chemical shifts (NMR) across different instruments and laboratories.
- Throughput: The number of samples that can be processed per unit time while maintaining data quality.
Benchmarking for Dereplication Efficiency
A core application is benchmarking workflows for dereplication speed and accuracy. This involves processing standardized extract libraries with candidate techniques and measuring the percentage of correctly identified known compounds against a validated reference, the time to identification, and the rate of false positives/negatives [63]. Advanced strategies benchmark not just identification but also the utility of spectral data for downstream computational analysis. For instance, molecular networking—which clusters MS/MS spectra based on similarity—is benchmarked by its ability to correctly group structural analogues and reveal novel scaffold families within untargeted data [66].
Table 1: Performance Benchmark of Spectroscopic Dereplication Strategies
| Strategy | Core Technique | Key Benchmark Metric | Typical Performance Range | Primary Application |
|---|---|---|---|---|
| Library Spectral Matching | LC-MS/MS | Mirror Match Score (e.g., Cosine Score) | >0.7 for high confidence ID [65] | Rapid identification of known compounds in databases |
| Molecular Networking | LC-MS/MS (Untargeted) | Spectral Cluster Consistency & Annotation Rate | Enables prioritization of 80-100% of scaffold diversity in libraries [66] | Visualizing chemical diversity and discovering analogues |
| 13C NMR Database Query | NMR | Mean Absolute Error (MAE) of Predicted vs. Experimental Chemical Shifts | < 2 ppm for reliable candidate ranking [63] | Structure verification and identification of novel NPs |
Benchmarking Computational Algorithms and Prediction Tools
Computational benchmarking evaluates the predictive power of algorithms for tasks ranging from spectral prediction and structure elucidation to bioactivity forecasting.
Spectral Prediction and Database Search
Benchmarking here assesses how well algorithms predict theoretical MS/MS spectra from a chemical structure or, conversely, identify the correct structure from an experimental spectrum. Key metrics include the Top-K accuracy (whether the correct structure is in the top K ranked candidates) and the spectral similarity score (e.g., Cosine score) for the best match [65]. A landmark study benchmarked the VInSMoC algorithm against traditional exact-search tools. Searching 483 million GNPS spectra against 87 million molecules, VInSMoC identified not only 43,000 known molecules but also 85,000 previously unreported structural variants, demonstrating superior capability in identifying modified natural products [65].
Structure Modeling and Conformational Analysis
For 3D structure prediction, benchmarking involves comparing computationally generated models against experimentally determined structures (e.g., from X-ray crystallography). Metrics include the Root-Mean-Square Deviation (RMSD) of atomic positions and the TM-score for global fold accuracy. A 2025 comparative study benchmarked four modeling algorithms (AlphaFold, PEP-FOLD, Threading, Homology Modeling) for short, unstable antimicrobial peptides. The benchmark revealed that no single algorithm was universally superior. Instead, performance was dictated by peptide properties: AlphaFold and Threading complemented each other for hydrophobic peptides, while PEP-FOLD and Homology Modeling were better for hydrophilic ones [67]. This underscores the need for context-aware benchmarking.
Quantum Chemical Property Prediction
At the frontier of computational chemistry, new methods are benchmarked for predicting quantum mechanical properties with high accuracy but low computational cost. The MEHnet (Multi-task Electronic Hamiltonian network), a graph neural network trained on gold-standard CCSD(T) quantum chemistry data, was benchmarked against standard Density Functional Theory (DFT). MEHnet achieved near-experimental accuracy in predicting dipole moments, polarizability, and excitation gaps for small organic molecules, but at a fraction of the computational cost, paving the way for high-throughput screening of electronic properties [68].
Table 2: Benchmarking Computational Algorithms for NP Research
| Algorithm Type | Example Tool | Benchmark Task | Key Performance Outcome | Reference |
|---|---|---|---|---|
| Spectral Database Search | VInSMoC | Variant Identification from MS/MS | Identified 85,000 unreported variants in GNPS data [65] | [65] |
| Peptide Structure Prediction | AlphaFold vs. PEP-FOLD | 3D Model Accuracy for Short Peptides | Algorithm suitability depends on peptide hydrophobicity [67] | [67] |
| Quantum Property Prediction | MEHnet | Dipole Moment, Polarizability Prediction | CCSD(T)-level accuracy at DFT-like cost for small molecules [68] | [68] |
| Library Design | Custom R (Molecular Networking) | Retaining Bioactivity in Minimal Library | Achieved 22% hit rate (vs. 11.3% full library) for P. falciparum with 50-extract library [66] | [66] |
Integrated Experimental Protocols
Protocol: Rational Natural Product Library Minimization Using MS/MS Similarity
This protocol benchmarks a strategy for reducing screening library size while maximizing chemical diversity and retaining bioactivity [66].
- Sample Preparation & Data Acquisition: Generate a library of natural product extracts (e.g., 1,439 fungal extracts). Analyze each extract via untargeted LC-MS/MS on a high-resolution mass spectrometer using standardized chromatographic gradients and data-dependent acquisition for MS/MS.
- Data Processing & Molecular Networking: Process raw MS/MS data using GNPS to create a classical molecular network. Spectra are clustered into "molecular families" (scaffolds) based on fragmentation pattern similarity (cosine score > 0.7).
- Rational Library Algorithm: Use custom R code to select extracts iteratively. The first extract chosen has the highest number of unique molecular families. Each subsequent addition is the extract that contributes the most new families not already present in the selected set. Iteration continues until a pre-defined percentage of total scaffold diversity (e.g., 80%, 95%, 100%) is captured.
- Benchmarking & Validation:
- Size/Diversity Benchmark: Compare the scaffold diversity accumulation curve of the rational selection against 1,000 iterations of random selection.
- Bioactivity Benchmark: Screen both the full library and the rationally minimized library in relevant phenotypic or target-based bioassays (e.g., anti-malarial, enzyme inhibition). Compare hit rates (percentage of active extracts) to validate that bioactivity is concentrated, not lost.
- Statistical Analysis: Use correlation analysis (e.g., Spearman's ρ) to identify MS features (m/z-RT pairs) significantly correlated with bioactivity in the full library, and verify their retention in the minimized library.
Protocol: Comparative Benchmarking of Peptide Structure Prediction Algorithms
This protocol provides a framework for benchmarking computational structure prediction tools [67].
- Peptide Dataset Curation: Select a diverse set of short peptide sequences (e.g., 10-50 amino acids) with varied physicochemical properties (charge, hydrophobicity). Ideally, include peptides with experimentally solved structures for ground-truth validation.
- Structure Prediction: Submit each peptide sequence to multiple prediction algorithms:
- AlphaFold2 (via ColabFold or local installation).
- PEP-FOLD3 (de novo peptide folding server).
- Threading-based methods (e.g., I-TASSER).
- Comparative Homology Modeling (e.g., using MODELLER with a suitable template).
- Structural Validation Metrics:
- Stereo-chemical Quality: Analyze all models with Ramachandran plot analysis (e.g., using PDBsum or MolProbity) to calculate the percentage of residues in favored/allowed regions.
- Packaging and Solvation: Use tools like VADAR to assess volume, packing, and solvent accessibility parameters.
- Molecular Dynamics (MD) Simulation for Stability Benchmark:
- Solvate each predicted model in an explicit water box, add ions, and minimize energy.
- Run 100 ns MD simulations (e.g., using GROMACS or AMBER) for each model under constant temperature and pressure.
- Calculate the Root Mean Square Deviation (RMSD) and Radius of Gyration (Rg) over time to assess conformational stability and compactness. A stable, biologically relevant model will show a plateau in RMSD and consistent Rg.
- Result Correlation: Correlate algorithm performance (model quality, MD stability) with peptide sequence characteristics (hydrophobicity, charge, disorder propensity) to determine algorithmic suitability rules.
Visualizing Integrated Workflows and Relationships
Diagram 1: The Benchmarking Cycle in NP Research
Diagram 2: Rational Library Reduction via MS/MS Workflow
The Scientist's Toolkit: Essential Reagents and Materials
Table 3: Key Research Reagent Solutions for Benchmarking Studies
| Item Name | Function / Role in Benchmarking | Technical Specification Notes |
|---|---|---|
| High-Resolution LC-MS/MS System | Generates the primary spectral data for dereplication and library analysis. Benchmarking compares sensitivity and spectral quality across platforms [61] [66]. | Q-TOF or Orbitrap mass analyzers preferred for high mass accuracy and resolution. Standardized LC columns (e.g., C18) and gradients are critical for reproducibility. |
| Reference Spectral Databases | Serve as the ground truth for benchmarking identification algorithms. The comprehensiveness and curation quality of the database directly impact benchmark results [65] [63]. | Examples: GNPS spectral libraries, NAPROC-13 (13C NMR), MassBank. Benchmarking studies often measure identification rate against these. |
| Molecular Networking Software (GNPS) | Clusters MS/MS data to map chemical diversity. Used to benchmark library reduction strategies by measuring scaffold coverage [66]. | Cloud-based platform. Benchmarking involves parameters like cosine score threshold and minimum matched peaks. |
| Structure Prediction Software Suite | Provides the computational models to be benchmarked against each other or experimental data [67] [69]. | Includes: AlphaFold2/ColabFold (deep learning), PEP-FOLD (de novo), MODELLER/I-TASSER (template-based). |
| Molecular Dynamics Simulation Package | Assesses the stability and dynamics of predicted structures, a key benchmark for model quality beyond static metrics [67] [69]. | Examples: GROMACS, AMBER, NAMD. Benchmarking uses metrics like RMSD, Rg, and interaction energies from simulation trajectories. |
| Validated Natural Product Extract Library | A standardized, chemically characterized set of extracts used as a testbed to benchmark new analytical or computational workflows for dereplication speed and accuracy [66] [63]. | Should have associated metadata (taxonomy, known bioactive compounds) and be available in sufficient quantity for replicate analyses. |
The rediscovery of known compounds, a major bottleneck in natural product (NP) research, necessitates efficient dereplication—the rapid identification of known chemotypes to avoid redundant isolation [4]. Modern dereplication has evolved beyond simple spectral matching into a sophisticated discipline resting on three interconnected pillars: taxonomy, spectroscopy, and structures. This whitepaper posits that the convergence of multi-omics data layers, artificial intelligence (AI), and open-access platforms is fundamentally transforming each pillar, creating a new paradigm for accelerated discovery.
- Pillar I: Taxonomy provides the biological context, anchoring compound discovery to the evolutionary source. The rationale is that taxonomically related organisms often produce chemically related secondary metabolites [4].
- Pillar II: Spectroscopy (encompassing MS, MS/MS, and NMR) generates the analytical fingerprints used for compound characterization and comparison.
- Pillar III: Structures represent the definitive chemical identities, the ultimate goal of the dereplication workflow.
The integration of multi-omics (genomics, transcriptomics, metabolomics) provides a systems biology view, linking taxonomic origin to biosynthetic potential and metabolic output. AI and machine learning (ML) algorithms are essential for interpreting the vast, complex datasets generated, predicting structures, and identifying patterns [70]. Finally, open-access platforms serve as the foundational infrastructure, enabling the curation, sharing, and collaborative annotation of data across all three pillars [71] [72]. This guide details the technical workflows, tools, and future trends at this transformative intersection.
Pillar I: Taxonomy – From Biological Source to In-Silico Prioritization
Taxonomy informs the dereplication strategy by defining a constrained chemical search space. The workflow involves leveraging taxonomic databases to filter and prioritize potential compounds from a biological extract.
Core Concept: A taxonomy-focused database limits candidate structures to those previously reported from organisms within the same genus, family, or order, dramatically increasing identification confidence [4].
Experimental Protocol: Constructing a Taxon-Specific Database for NMR Dereplication
This protocol, adapted from methodologies for creating carbon-13 NMR databases, details the steps for building a taxon-focused library [4].
- Define Taxon & Source Data: Identify the taxonomic node of interest (e.g., Brassica rapa). Use an open-access, taxonomy-aware NP database like LOTUS (lotus.naturalproducts.net) to retrieve all associated compound structures [4].
- Data Retrieval & Cleaning:
- Execute a search on the LOTUS web interface using the taxon name as a keyword.
- Download results in a structured format (e.g., SDF file).
- Process the file using cheminformatics tools (e.g., RDKit in a Python environment) to remove duplicate structures and correct tautomeric forms (e.g., converting iminols to amides) to ensure prediction accuracy [4].
- Spectral Data Generation/Attachment: For NMR-based dereplication, supplement the structural database with predicted or experimental spectral data.
- Prediction Pathway: Use commercial (e.g., ACD/Labs CNMR Predictor) or open-source spectroscopic prediction software to generate theoretical (^{13})C or (^{1})H NMR spectra for each structure [4].
- Curation Pathway: Manually or automatically extract and attach experimental spectral data from published literature or open spectral repositories.
- Database Deployment: Format the final dataset (structures + metadata + spectra) for use within specialized dereplication software (e.g., MixONat, DerepCrude) or as a searchable library within a broader platform like GNPS.
Diagram Title: Workflow for Building a Taxon-Focused Dereplication Database
Pillar II: Spectroscopy & Multi-Omics Integration – From Spectral Data to Biological Context
Modern spectroscopy, particularly high-resolution mass spectrometry (HR-MS/MS), generates the primary data for dereplication. Multi-omics integration layers genomic and transcriptomic context onto this spectral data, transforming annotation from a purely analytical exercise into a biologically informed discovery process.
Core Trend: Single-Cell Multi-Omics. A key 2025 trend is moving from bulk tissue analysis to single-cell resolution. This allows researchers to correlate specific genomic variants, gene expression (transcriptomics), and metabolite production (metabolomics) within individual cells of a tissue or microbial community, uncovering heterogeneous biosynthetic activity [73].
Experimental Protocol: Feature-Based Molecular Networking (FBMN) with Genomic Context
This protocol describes integrating untargeted metabolomics data with genomic data via the Global Natural Products Social Molecular Networking (GNPS) platform [21].
- Multi-Omics Sample Preparation:
- Metabolomics: Prepare extract from source material. Analyze via LC-HR-MS/MS in data-dependent acquisition (DDA) mode.
- Genomics: From adjacent sample material, perform DNA extraction and sequencing (e.g., Illumina for whole genome, or Oxford Nanopore for long-read assembly of biosynthetic gene clusters).
- Metabolomic Data Processing (GNPS Workflow):
- Convert raw MS files to .mzML format using MSConvert.
- Use MZmine3 or similar to perform feature detection, alignment, and ion identity networking. Export a feature quantification table (.csv) and an MS/MS spectral file (.mgf).
- Upload both files to GNPS. Create a Feature-Based Molecular Network (FBMN). This incorporates chromatographic alignment, improving network accuracy over classical MN [21].
- Genomic Data Analysis & Integration:
- Assemble sequenced reads and annotate the genome using antiSMASH or similar tools to identify Biosynthetic Gene Clusters (BGCs).
- Integration Point: Use the taxonomic identity from the genome to inform the dereplication search space in GNPS (linking to Pillar I). Furthermore, predicted substrates or products from annotated BGCs can be used as "seed" structures to search within the molecular network for corresponding metabolites.
- Annotation & Dereplication:
- Within GNPS, use structural annotation tools (DEREPLICATOR+, MolDiscovery) to annotate network nodes [21].
- Leverage the genomic context to prioritize annotations. A molecular family that clusters near a network node annotated as a known compound from a related taxon, and whose structure is congruent with a local BGC, has high confidence for targeted isolation.
Table 1: Key Multi-Omics Data Types and Their Role in Dereplication
| Omics Layer | Primary Technology | Data Output | Role in NP Dereplication |
|---|---|---|---|
| Genomics | Next-Gen Sequencing (NGS) | DNA sequence, Biosynthetic Gene Clusters (BGCs) | Predicts biosynthetic potential; links compound classes to genetic machinery. |
| Transcriptomics | RNA-Seq | Gene expression profiles | Identifies actively expressed BGCs under given conditions; prioritizes targets. |
| Metabolomics | LC-HR-MS/MS, NMR | Spectral fingerprints, molecular networks | Provides direct evidence of compounds produced; enables structural similarity mapping. |
Pillar III: Structures – AI-Driven Prediction and Open Knowledge Bases
The final pillar involves determining the definitive chemical structure. AI is revolutionizing this space by predicting novel structures from spectral data and by intelligently mining vast, interconnected open-access knowledge bases.
Core Trend: Generative AI for Structure Elucidation. Beyond predictive models, generative AI and deep learning architectures (e.g., variational autoencoders, transformer models) are being trained on known structure-spectra pairs. These can propose novel, plausible chemical structures that explain an observed, unknown MS/MS or NMR spectrum, greatly accelerating the discovery of truly novel scaffolds [74].
Experimental Protocol: AI-Augmented Structure Dereplication Workflow
This protocol outlines a hybrid human-AI workflow for resolving an unknown compound.
- Data Collection & Pre-processing: Obtain high-quality MS/MS and/or NMR spectra for the unknown. Clean and standardize the data (peak picking, normalization).
- Multi-Tool Annotation Cascade:
- Step 1 - Library Search: Query open spectral libraries (GNPS, MassBank) for exact or close matches.
- Step 2 - In-Silico Fragmentation: If no match, use tools like SIRIUS to compute molecular formula and predict fragmentation trees from MS/MS data.
- Step 3 - Structure Prediction: Feed the spectral data and any prior information (taxonomy, molecular formula) into an AI prediction tool. This could be a CSM (Competitive Fragmentation Modeling)-based tool within SIRIUS, or a dedicated deep learning model like MolDiscovery or a generative AI platform [21] [75]. The tool outputs a ranked list of candidate structures.
- Candidacy Evaluation & Validation:
- Cross-Referencing: Check top AI-proposed candidates against taxonomic databases (Pillar I). Filter out candidates not reported from related organisms.
- Spectral Prediction & Comparison: Use NMR prediction software (e.g., ACD/Labs, NMRshiftDB2) to generate predicted NMR spectra for the AI-proposed candidate. Statistically compare (e.g., Mean Absolute Error, MAE) the predicted spectrum with the experimental unknown spectrum.
- Final Verification: The top-ranked, taxonomically plausible candidate with strong spectral correlation proceeds to final confirmation, potentially via micro-scale isolation for direct 1D/2D NMR comparison or synthesis of the proposed compound.
Table 2: Performance Metrics of Selected AI/ML Tools for Structure Annotation
| Tool Name | Type | Primary Data Input | Key Output | Reported Advantage/Capability |
|---|---|---|---|---|
| DEREPLICATOR+ [21] | ML (Peptide-focused) | MS/MS Spectra | Peptide sequence & variants | Identifies even non-ribosomal peptides with modifications. |
| SIRIUS [21] | Hybrid (Fragmentation Trees) | MS/MS Spectra | Molecular Formula, Fragmentation Trees | Integrates isotope pattern analysis; provides confidence scores. |
| MolDiscovery [21] | Deep Learning | MS/MS Spectra | Chemical Structure | Designed for novel NP scaffolds; uses a transferable model. |
| MetaMiner [21] | Rule-based/ML | MS/MS, Genomics | Glycosylated NP Structures | Specialized for ribosomally synthesized and post-translationally modified peptides (RiPPs). |
The Enabling Infrastructure: Open-Access Platforms and Collaborative Science
The three-pillar model is functionally impossible without robust, interoperable open-access platforms. These platforms provide the repositories, computational tools, and collaborative frameworks necessary for modern research.
Core Trend: Federated and Integrated Platforms. The future lies in platforms that move beyond simple repositories to offer integrated analysis environments. For example, the GNPS ecosystem provides storage (MassIVE), analysis (GNPS workflows), and discovery tools (MolNetEnhancer) in one cloud environment [21]. Major funders like the Gates Foundation mandate open access, driving policy and infrastructure development [72].
Diagram Title: Ecosystem of Open-Access Platforms for Collaborative Research
Research Reagent Solutions: The Scientist's Toolkit
Table 3: Essential Digital Tools & Platforms for Integrated NP Research
| Category | Tool/Platform Name | Primary Function | Key Application in Dereplication |
|---|---|---|---|
| Taxonomy & Structure DBs | LOTUS [4] | Links NP structures to organism taxonomy. | Defining taxon-specific search space for dereplication. |
| Spectral Data Platforms | GNPS / MassIVE [21] | Repository & ecosystem for MS/MS data analysis. | Molecular networking, library search, community annotation. |
| AI/ML Analysis Tools | SIRIUS [21] | Molecular formula & structure prediction from MS/MS. | Core engine for in-silico structure elucidation. |
| Open Literature | PubMed Central [71] | Free full-text archive of biomedical literature. | Source of experimental spectral data and biological context. |
| Preprint & Review | PREreview, VeriXiv [72] | Preprint server and open peer review. | Rapid sharing of preliminary data and early community feedback. |
| Protocol Sharing | protocols.io [72] | Platform for sharing and collaborating on methods. | Ensuring reproducibility of omics and analytical workflows. |
The trajectory for natural product research is firmly set toward deeper integration. Multi-omics will become more spatially resolved and real-time, moving from single-cell to sub-cellular metabolomics. AI will evolve from predictive to generative and explanatory, capable of proposing biosynthetic pathways and mechanisms of action. Open-access platforms will become more federated, intelligent, and embedded with FAIR (Findable, Accessible, Interoperable, Reusable) data principles, potentially leveraging blockchain for provenance tracking [72] [73].
The main challenges remain data harmonization, computational scalability, and workflow standardization. Addressing these requires continued collaborative efforts across academia, industry, and government to develop shared protocols, benchmarks, and sustainable infrastructure [70] [73].
In conclusion, the synergistic integration of multi-omics, AI, and open science is not merely an incremental improvement but a fundamental shift. It transforms the three pillars of dereplication from sequential, manual tasks into a dynamic, interconnected, and intelligent discovery engine, poised to unlock the next generation of natural product-based solutions for medicine and biotechnology.
Conclusion
The integration of taxonomy, spectroscopy, and molecular structures is essential for efficient natural product dereplication, enabling researchers to rapidly identify known compounds and prioritize novel discoveries. By mastering foundational principles, applying robust methodologies, addressing optimization challenges, and validating results through comparative analysis, the field can accelerate drug discovery from natural sources. Future advancements will likely involve AI-enhanced tools, expanded open-access databases, and interdisciplinary approaches, further bridging dereplication techniques with biomedical and clinical research for therapeutic development.
References
- 1. Rapid Dereplication of Bioactive Compounds in Plant and ... [https://pmc.ncbi.nlm.nih.gov/articles/PMC12380011/]
- 2. Advanced Methods for Natural Products Discovery: Bioactivity Screening, Dereplication, Metabolomics Profiling, Genomic Sequencing, Databases and Informatic Tools, and Structure Elucidation [https://www.mdpi.com/1660-3397/21/5/308]
- 3. The Three Pillars of Natural Product Dereplication. Alkaloids from the Bulbs of Urceolina peruviana (C. Presl) J.F. Macbr. as a Preliminary Test Case [https://www.mdpi.com/1420-3049/26/3/637]
- 4. Taxonomy-Focused Natural Product Databases for Carbon-13 NMR-Based Dereplication [https://www.mdpi.com/2673-4532/2/3/6]
- 5. Dereplication of secondary metabolites from Sophora ... [https://www.nature.com/articles/s41598-025-94958-3]
- 6. Integrated online DPPH-assisted multimodal dereplication ... [https://www.sciencedirect.com/science/article/pii/S0021967325005187]
- 7. The Three Pillars of Natural Product Dereplication. Alkaloids ... [https://pmc.ncbi.nlm.nih.gov/articles/PMC7865595/]
- 8. Identification of known natural products by querying a ... [https://chemrxiv.org/engage/chemrxiv/article-details/6486c8f0e64f843f41ab208e]
- 9. Natural Products Dereplication: Databases and Analytical ... [https://pubmed.ncbi.nlm.nih.gov/39101983/]
- 10. Forward-predictive SERS-based chemical taxonomy for ... [https://www.nature.com/articles/s41467-024-46838-z]
- 11. How to Constrain the Molecular Structure Search Space ... [https://bright-giant.com/2025/09/15/constrain-the-structure-search-space-with-labeling/]
- 12. Using the Triple Taxonomy Technique (TTT) in Teaching ... [https://brieflands.com/journals/erms/articles/162088]
- 13. The Three Pillars of Natural Product Dereplication. ... [https://pubmed.ncbi.nlm.nih.gov/33530604/]
- 14. Chemotaxonomy, an Efficient Tool for Medicinal Plant ... [https://www.mdpi.com/2223-7747/14/14/2234]
- 15. Spectral Signature - an overview [https://www.sciencedirect.com/topics/earth-and-planetary-sciences/spectral-signature]
- 16. Combining chemometric analysis of HPTLC data and 13 C ... [https://www.sciencedirect.com/science/article/abs/pii/S0021967325006004]
- 17. Integrating untargeted volatile metabolomics and ... [https://www.nature.com/articles/s41598-025-17869-3]
- 18. Natural Product Research [https://www.up.ac.za/chemistry/article/2581582/natural-product-research]
- 19. 2025 Review of Spectroscopic Instrumentation [https://www.spectroscopyonline.com/view/2025-review-of-spectroscopic-instrumentation]
- 20. Frontiers | Affinity selection mass spectrometry (AS-MS) for prospecting... [https://www.frontiersin.org/journals/natural-products/articles/10.3389/fntpr.2025.1562501/full]
- 21. Molecular networking: An efficient tool for discovering and ... [https://www.sciencedirect.com/science/article/abs/pii/S0731708525000822]
- 22. Integrating NMR and MS for Improved Metabolomic Analysis [https://pmc.ncbi.nlm.nih.gov/articles/PMC12196070/]
- 23. Spectroscopy Data and Information: Home - Research Guides [https://researchguides.library.wisc.edu/spectra]
- 24. Natural Product Reports - REVIEW - RSC Publishing [https://pubs.rsc.org/en/content/articlepdf/2021/1A/d4np00006d]
- 25. NMR data of alkaloids from Urceolina peruviana [https://zenodo.org/records/4574015]
- 26. Dereplication of Natural Products Using GC-TOF Mass ... [https://www.frontiersin.org/journals/molecular-biosciences/articles/10.3389/fmolb.2016.00059/full]
- 27. Natural products dereplication by diffusion ordered NMR ... [https://pubs.rsc.org/en/content/articlelanding/2021/sc/d1sc02940a]
- 28. The Challenges of Data Quality and Data Quality Assessment ... [https://datascience.codata.org/articles/dsj-2015-002]
- 29. Microbial natural product databases: Moving forward in the ... [https://pmc.ncbi.nlm.nih.gov/articles/PMC7864863/]
- 30. Multiple imputation for analysis of incomplete data in ... [https://www.nature.com/articles/s41467-020-19270-2]
- 31. A Case Study of Untargeted LC–QTOF Auto-MS/MS Analysis [https://www.mdpi.com/2073-4409/11/6/1025]
- 32. Combining DI-ESI–MS and NMR datasets for metabolic ... [https://pmc.ncbi.nlm.nih.gov/articles/PMC4354777/]
- 33. Combining mass spectrometry and nuclear magnetic ... [https://www.sciencedirect.com/science/article/abs/pii/S0079656516300656]
- 34. NMR Spectroscopy for Metabolomics Research - PMC [https://pmc.ncbi.nlm.nih.gov/articles/PMC6680826/]
- 35. Maximizing spectral sensitivity without compromising ... [https://www.nature.com/articles/s41467-025-61215-0]
- 36. Autonomous adaptive optimization of NMR experimental ... [https://journals.plos.org/plosone/article?id=10.1371/journal.pone.0321692]
- 37. Prediction of Fragmentation Pathway of Natural Products ... [https://pmc.ncbi.nlm.nih.gov/articles/PMC11976197/]
- 38. NMR Spectroscopy [https://www2.chemistry.msu.edu/faculty/reusch/OrgTxtBook/Spectrpy/nmr/nmr1.htm]
- 39. 15N optimal control pulses: an efficient approach to ... [https://www.sciencedirect.com/science/article/pii/S1090780725001442]
- 40. On the importance of color in mass spectrometry imaging [https://pmc.ncbi.nlm.nih.gov/articles/PMC9944061/]
- 41. Fast visual exploration of mass spectrometry images with ... [https://www.nature.com/articles/s41598-021-84049-4]
- 42. NMR Chemical Shift Values Table [https://www.chemistrysteps.com/nmr-chemical-shift-values-table/]
- 43. Machine learning in computational NMR-aided structural ... [https://www.frontiersin.org/journals/natural-products/articles/10.3389/fntpr.2023.1122426/full]
- 44. Rapid Prediction of Electron–Ionization Mass Spectrometry ... [https://pmc.ncbi.nlm.nih.gov/articles/PMC6487538/]
- 45. FIORA: Local neighborhood-based prediction of compound ... [https://www.nature.com/articles/s41467-025-57422-4]
- 46. CASCADE-2.0: Real Time Prediction of 13C-NMR Shifts ... [https://chemrxiv.org/engage/chemrxiv/article-details/68828a5a23be8e43d6d83671]
- 47. RT-Pred: A web server for accurate, customized liquid ... [https://www.sciencedirect.com/science/article/pii/S0021967325001645]
- 48. Grouping-Based Association Rule Mining to Predict Future ... [https://www.mdpi.com/2073-431X/14/6/220]
- 49. AI in Natural Product Drug Discovery: Now & Next [https://ai.creative-biolabs.com/blog/ai-in-natural-product-drug-discovery-now-next/]
- 50. Empowering natural product science with AI: leveraging ... [https://pubs.rsc.org/en/content/articlehtml/2025/np/d4np00008k]
- 51. A globally integrated structure of taxonomy to support ... [https://www.sciencedirect.com/science/article/pii/S016953472300215X]
- 52. A Systematic Review on AI-Powered Target Identification and ... [https://sciety.org/articles/activity/10.20944/preprints202503.0912.v1]
- 53. Structure-based machine learning screening identifies ... [https://pmc.ncbi.nlm.nih.gov/articles/PMC12265111/]
- 54. Transformative Role of Artificial Intelligence in Drug ... [https://pmc.ncbi.nlm.nih.gov/articles/PMC12406033/]
- 55. Dereplication and Quantification of Major Compounds ... [https://pmc.ncbi.nlm.nih.gov/articles/PMC8838012/]
- 56. Essential Parameters for Structural Analysis and ... [https://pmc.ncbi.nlm.nih.gov/articles/PMC4076039/]
- 57. DB-Engines Ranking Open Source vs. Commercial DBMS [https://db-engines.com/en/ranking_osvsc]
- 58. Top 10 open source databases: Detailed feature comparison [https://www.instaclustr.com/education/managed-database/top-10-open-source-databases-detailed-feature-comparison/]
- 59. Why Open Source Databases Are Enterprise-Ready in 2025 [https://simplelogic-it.com/open-source-databases-for-enterprises-2025/]
- 60. advances in metabolomics for natural product drug discovery [https://www.sciencedirect.com/science/article/pii/S095816692500117X?via%3Dihub]
- 61. A comprehensive review-current development in ... [https://www.sciencedirect.com/science/article/pii/S2211715625003248]
- 62. Top Software Tools for Pharma Commercial Analytics in 2025 [https://intuitionlabs.ai/articles/top-commercial-analytics-software-in-pharma]
- 63. Chemoinformatic Characterization of NAPROC-13 [https://pmc.ncbi.nlm.nih.gov/articles/PMC11443490/]
- 64. Mass Spectrometry-Based Approaches in Natural Products ... [https://www.mdpi.com/journal/plants/special_issues/22EM1RIL90]
- 65. Identifying variants of molecules through database search ... [https://www.nature.com/articles/s43588-025-00923-5]
- 66. Rationally minimizing natural product libraries using mass ... [https://pmc.ncbi.nlm.nih.gov/articles/PMC11915828/]
- 67. A comparative study of computational modeling ... [https://www.nature.com/articles/s41598-025-16866-w]
- 68. New computational chemistry techniques accelerate the ... [https://news.mit.edu/2025/new-computational-chemistry-techniques-accelerate-prediction-molecules-materials-0114]
- 69. Recent breakthroughs in computational structural biology ... [https://www.sciencedirect.com/science/article/abs/pii/S0959440X23000829]
- 70. Challenges and Future in Biomarker Analysis for Clinical... Trends [https://blog.crownbio.com/challenges-and-future-trends-in-biomarker-analysis-for-clinical-research-whats-ahead-in-2025]
- 71. 10 Best Online Academic Research Tools and Resources [https://www.bestcolleges.com/blog/best-online-resources-academic-research/]
- 72. Open Access Initiatives [https://openaccess.gatesfoundation.org/open-access-initiatives/]
- 73. : Multiomics 2025 Trends [https://www.genengnews.com/topics/omics/2025-trends-multiomics/]
- 74. in Life Sciences: Key AI from 2024 and What to Watch for in... Trends [https://www.linkedin.com/pulse/ai-life-sciences-key-trends-from-2024-what-watch-2025-vikas-kumar-3zb0c]
- 75. 9 Best AI Tools for Research in 2025 (Free & Paid) [https://paperguide.ai/blog/ai-tools-for-research/]