Terpene Biosynthesis: A Comprehensive Guide to the MEP and MVA Pathways for Drug Discovery
This article provides a detailed examination of the two fundamental pathways for terpene biosynthesis—the Mevalonate (MVA) and Methylerythritol Phosphate (MEP) pathways—targeting researchers and drug development professionals.
Terpene Biosynthesis: A Comprehensive Guide to the MEP and MVA Pathways for Drug Discovery
Abstract
This article provides a detailed examination of the two fundamental pathways for terpene biosynthesis—the Mevalonate (MVA) and Methylerythritol Phosphate (MEP) pathways—targeting researchers and drug development professionals. We explore the foundational enzymology and compartmentalization of these routes, delve into modern methodological approaches for pathway engineering and analysis, address common challenges in yield optimization and pathway crosstalk, and present a rigorous comparative analysis of their metabolic fluxes, regulation, and therapeutic potential. The synthesis aims to equip scientists with a holistic understanding for leveraging these pathways in the production of high-value terpenoids for pharmaceuticals.
Blueprint of Isoprenoid Life: Demystifying the MVA and MEP Pathways
Terpenes, the largest class of natural products, are derived from the universal five-carbon building blocks isopentenyl diphosphate (IPP) and dimethylallyl diphosphate (DMAPP). Their biosynthesis proceeds via two evolutionarily distinct pathways: the mevalonate (MVA) pathway in the cytosol of eukaryotes and some bacteria, and the methylerythritol phosphate (MEP) pathway in plastids of plants, algae, and most bacteria. This dichotomy underpins a vast chemical landscape with profound implications for drug discovery, as terpenes exhibit a staggering array of bioactivities. This whitepaper provides a technical overview of terpene biosynthesis, its regulation, and the experimental paradigms driving contemporary research aimed at harnessing their clinical potential.
Biosynthetic Pathways: MVA vs. MEP
The foundational metabolic routes to IPP and DMAPP represent a key focus area for pathway engineering and antimicrobial targeting.
Table 1: Comparative Analysis of the MVA and MEP Pathways
| Feature | Mevalonate (MVA) Pathway | Methylerythritol Phosphate (MEP) Pathway |
|---|---|---|
| Cellular Location | Cytosol (Eukaryotes), some Bacteria | Plastids (Plants), Apicoplast (Apicomplexa), most Bacteria |
| Initial Substrates | 3 x Acetyl-CoA | Pyruvate + Glyceraldehyde-3-phosphate |
| Key Committed Step Enzyme | HMG-CoA Reductase (HMGR) | DXP Reductoisomerase (IspC) |
| Regulatory Point | HMGR (Transcriptional, Post-translational) | DXS (Transcriptional) |
| Essential Pathway in Humans? | Yes (Cholesterol biosynthesis) | No |
| Antimicrobial Target Potential | Low (absent in most pathogens) | High (essential in many pathogens) |
| Representative Inhibitors | Statins (e.g., Atorvastatin) | Fosmidomycin, FR900098 |
Core Experimental Methodologies in Terpene Research
Protocol: Metabolic Flux Analysis using Stable Isotope Labeling
Objective: To quantify the relative contribution of MVA and MEP pathways to terpene biosynthesis in plant systems.
- Labeling: Incubate plant cell suspensions or tissue explants in controlled media supplemented with (^{13}\text{C})-labeled precursors:
- (^{13}\text{C}2)-Acetate (MVA pathway tracer)
- (^{13}\text{C}5)-Glucose (MEP pathway tracer via G3P/pyruvate).
- Extraction: Harvest cells at defined time points (e.g., 2h, 6h, 24h). Homogenize in liquid N₂. Extract terpenes using organic solvent (e.g., hexane:ethyl acetate, 4:1 v/v).
- Analysis: Analyze extracts via GC-MS or LC-MS. Determine (^{13}\text{C}) incorporation patterns and isotopic enrichment using mass isotopomer distribution analysis (MIDA).
- Calculation: Use computational modeling (e.g., elementary metabolic unit analysis) to apportion flux through each pathway.
Protocol: Heterologous Expression and Characterization of Terpene Synthases (TPS)
Objective: To identify and characterize novel terpene synthases from genomic or transcriptomic data.
- Gene Cloning: Amplify candidate TPS gene (lacking plastid-targeting signal if MEP-derived). Clone into an expression vector (e.g., pET series for E. coli, pYES2 for yeast).
- Heterologous Expression: Transform into expression host (often E. coli BL21(DE3) co-expressing upstream MVA or MEP pathway genes). Induce with IPTG at low temperature (18-22°C) for 16-20 hours.
- Protein Purification: Lyse cells via sonication. Purify His-tagged protein using immobilized metal affinity chromatography (IMAC).
- In Vitro Enzyme Assay: Incubate purified TPS (1-10 µg) with substrate (e.g., GPP, FPP, GGPP) in assay buffer (25-50 mM HEPES or Tris, pH 7-8, 10 mM Mg²⁺/Mn²⁺) for 30-60 min at 30°C.
- Product Identification: Extract reaction volatiles with hexane or use headspace SPME. Analyze via GC-MS, comparing mass spectra and retention indices to authentic standards/libraries.
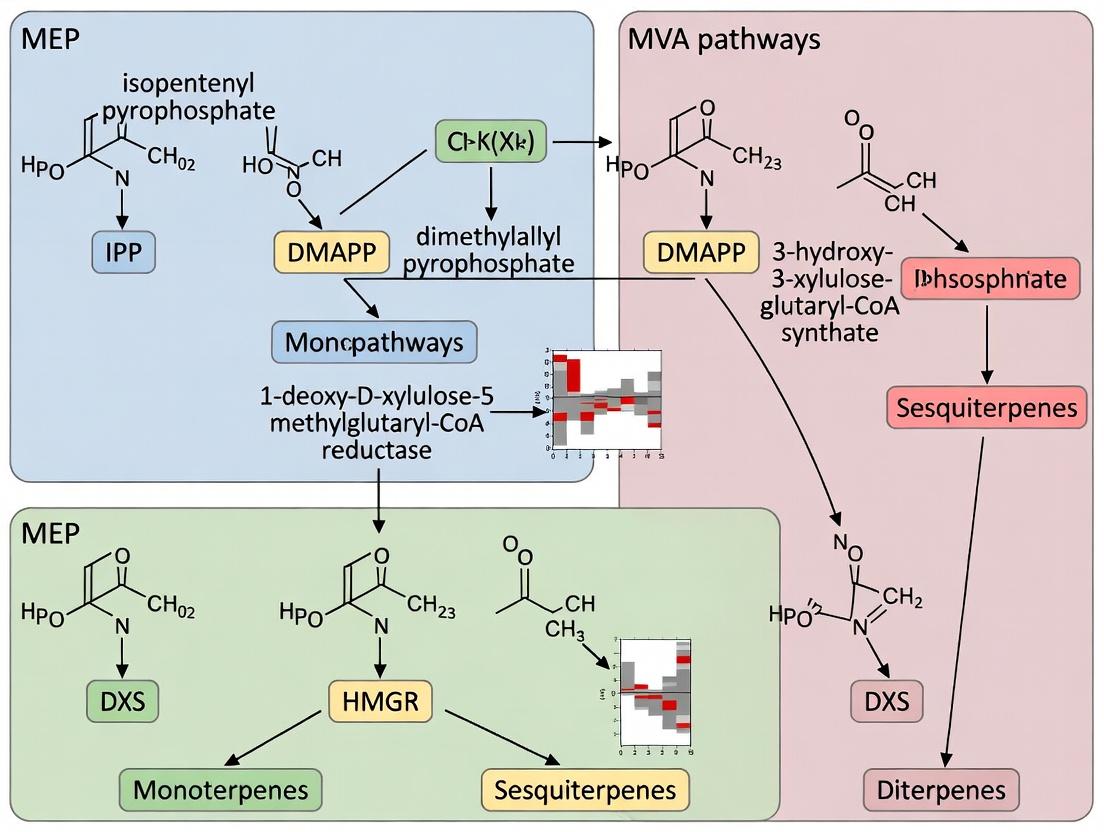
Pathway Visualization
Diagram 1: Cytosolic Mevalonate (MVA) Biosynthetic Pathway
Diagram 2: Plastidial MEP (DXP) Biosynthetic Pathway
The Scientist's Toolkit: Essential Research Reagents
Table 2: Key Reagents for Terpene Biosynthesis Research
| Reagent / Material | Function / Application | Key Consideration |
|---|---|---|
| Fosmidomycin | A specific, potent inhibitor of DXR (IspC) in the MEP pathway. Used for in vivo flux inhibition studies and as an antimalarial lead. | Cell permeability can vary; use with chelators (e.g., Fosmidomycin+Clomipramine for P. falciparum). |
| (^{13}\text{C})-Glucose ((^{13}\text{C}6) or (^{13}\text{C}1)) | Stable isotope tracer for tracking carbon flux through central metabolism into the MEP pathway. | Choice of labeling pattern ((^{U})-(^{13}\text{C}_6) vs. 1-(^{13}\text{C})) determines MS analysis strategy. |
| Recombinant Prenyltransferases (e.g., FPS, GGPPS) | Generate defined polyprenyl diphosphate substrates (GPP, FPP, GGPP) for in vitro terpene synthase assays. | Commercial sources limited; often purified in-house from cloned genes. |
| IPP/DMAPP Isoprenoid Kit (e.g., Radiolabeled (^{3}\text{H}) or (^{14}\text{C})) | High-sensitivity detection of in vitro terpene synthase or prenyltransferase activity. | Requires specialized handling and disposal for radioactivity. |
| SPME Fiber Assembly (e.g., PDMS/DVB) | For headspace sampling of volatile terpenes (mono/sesquiterpenes) from in vitro assays, cell cultures, or plant tissues. | Fiber coating selection critical; requires thermal desorption in GC inlet. |
| CRISPR/dCas9-based Transcriptional Activators | For targeted upregulation of endogenous MVA/MEP pathway genes or TPS genes in plant or microbial chassis. | sgRNA design must consider chromatin accessibility for effective activation. |
The biosynthesis of terpenes, the largest class of natural products, is governed by two evolutionarily distinct pathways in nature: the Mevalonate (MVA) pathway and the Methylerythritol Phosphate (MEP) pathway. Within the broader thesis of comparative terpene biosynthesis research, understanding the architecture and compartmentalization of the MVA pathway is fundamental. While the MEP pathway operates in plastids of plants and most bacteria, the canonical MVA pathway is primarily cytosolic in eukaryotes and is essential for producing sterols, prenylated proteins, dolichols, and a subset of plant defense terpenoids. This whitepaper provides an in-depth technical analysis of the MVA pathway's structure, enzymatic components, and subcellular organization, emphasizing its distinction from and interplay with the MEP pathway.
Pathway Architecture and Enzymatic Cascade
The MVA pathway converts acetyl-CoA to the two pivotal 5-carbon isoprenoid precursors, isopentenyl pyrophosphate (IPP) and its isomer dimethylallyl pyrophosphate (DMAPP). The enzymatic sequence is linear but involves multiple ATP-dependent steps.
Table 1: Key Enzymes of the MVA Pathway
| Enzyme (EC Number) | Reaction Catalyzed | Cofactors/Substrates | Primary Localization (Eukaryotes) |
|---|---|---|---|
| Acetyl-CoA acetyltransferase (ACAT, Thiolase) (2.3.1.9) | 2 Acetyl-CoA → Acetoacetyl-CoA | CoA | Cytosol |
| HMG-CoA synthase (HMGS) (2.3.3.10) | Acetoacetyl-CoA + Acetyl-CoA → HMG-CoA | CoA | Cytosol |
| HMG-CoA reductase (HMGR) (1.1.1.34) | HMG-CoA → Mevalonate | 2 NADPH | ER Membrane (Cytosolic face) |
| Mevalonate kinase (MVK) (2.7.1.36) | Mevalonate → Mevalonate-5-phosphate | ATP | Peroxisome (Yeast/Animals); Cytosol (Plants) |
| Phosphomevalonate kinase (PMK) (2.7.4.2) | Mevalonate-5-phosphate → Mevalonate-5-diphosphate | ATP | Peroxisome (Yeast/Animals); Cytosol (Plants) |
| Mevalonate diphosphate decarboxylase (MVD) (4.1.1.33) | Mevalonate-5-diphosphate → Isopentenyl-PP (IPP) | ATP | Peroxisome (Yeast/Animals); Cytosol (Plants) |
| Isopentenyl-PP isomerase (IDI) (5.3.3.2) | IPP Dimethylallyl-PP (DMAPP) | - | Cytosol/Peroxisome/Mitochondria |
Diagram 1: Enzymatic sequence of the MVA pathway.
Subcellular Localization and Cross-Talk
The MVA pathway's localization is compartmentalized and species-specific. In mammals and yeast, the early, membrane-bound step (HMGR) occurs at the ER, while the downstream ATP-consuming kinases (MVK, PMK, MVD) are peroxisomal. This necessitates transport of mevalonate into peroxisomes and export of IPP to the cytosol for downstream synthesis. In plants, the pathway is primarily cytosolic, with some evidence for peroxisomal and mitochondrial isoforms. Crucially, IPP/DMAPP produced in the cytosol by the MVA pathway can be exchanged with the plastidial MEP pathway, a key point of cross-talk in plant terpenoid synthesis.
Diagram 2: Subcellular compartmentalization of the MVA pathway.
Detailed Experimental Protocols
Protocol: Measuring HMGR Activity via Radiometric Assay
Objective: Quantify the rate of conversion of [¹⁴C]-HMG-CoA to [¹⁴C]-mevalonate by HMGR. Principle: The assay measures the acid-stable, non-saponifiable radioactive product (mevalonate) after hydrolysis of the substrate (HMG-CoA). Procedure:
- Homogenate Preparation: Isolate microsomal fraction from tissue/cells via differential centrifugation (100,000 x g pellet).
- Reaction Mix (100 µL total):
- 50 mM Potassium phosphate buffer, pH 7.4
- 10 mM DTT
- 5 mM Glucose-6-phosphate
- 1 U/mL Glucose-6-phosphate dehydrogenase (to regenerate NADPH)
- 2 mM NADPH
- 0.1 mM [3-¹⁴C]-HMG-CoA (~50,000 dpm/nmol)
- 50-100 µg microsomal protein.
- Incubation: Run at 37°C for 30 minutes. Include a boiled protein blank.
- Termination & Extraction: Stop with 20 µL of 6M HCl. Incubate at 37°C for 15 min to hydrolyze esters. Add 100 µL of 1M Tris base to neutralize.
- Separation: Apply entire mix to a small Dowex-1 (Cl⁻ form) anion exchange column. [¹⁴C]-Mevalonate (neutral) is eluted with 3 mL water directly into a scintillation vial. Unreacted [¹⁴C]-HMG-CoA (charged) is retained.
- Quantification: Add scintillation cocktail, count radioactivity. Activity = (dpmsample - dpmblank) / (specific activity of substrate * time * protein).
Protocol: Subcellular Localization via Differential Centrifugation & Marker Enzymes
Objective: Determine the organellar distribution of MVA pathway enzymes. Procedure:
- Tissue Homogenization: Homogenize fresh tissue in ice-cold isotonic buffer (e.g., 0.25M sucrose, 50 mM Tris-HCl pH 7.5, 1 mM EDTA) with a Potter-Elvehjem homogenizer.
- Sequential Centrifugation:
- Nuclei/Cell Debris: 600 x g, 10 min. Pellet discarded or analyzed for nuclei.
- Mitochondria/Lysosomes/Peroxisomes: 10,000 x g, 20 min. Resuspend pellet (P2) in buffer.
- Microsomes (ER): 100,000 x g, 60 min on the 10,000 x g supernatant. Pellet = P3 (microsomes).
- Cytosol: The final supernatant (S3).
- Marker Enzyme Assays: Measure activity in each fraction.
- Cytosol: Lactate dehydrogenase (LDH).
- Mitochondria: Cytochrome c oxidase (CCO).
- Peroxisomes: Catalase.
- ER: NADPH-cytochrome c reductase (CCR).
- Target Enzyme Assay: Assay for MVA enzymes (e.g., MVK, PMK) in all fractions using spectrophotometric or radiometric methods.
- Analysis: Co-localization of target enzyme activity with a specific organelle marker confirms localization.
The Scientist's Toolkit: Key Research Reagents
Table 2: Essential Reagents for MVA Pathway Research
| Reagent | Function/Application | Example/Catalog # (Typical Vendor) |
|---|---|---|
| Lovastatin (Mevinolin) | Competitive inhibitor of HMGR. Used to block the MVA pathway in vivo and in vitro, forcing reliance on alternate pathways (e.g., MEP). | Sigma-Aldrich, #M2147 |
| [3-¹⁴C]-HMG-CoA | Radiolabeled substrate for the definitive assay of HMGR enzyme activity. | American Radiolabeled Chemicals, #ARC 0292 |
| Mevalonolactone | Cell-permeable form of mevalonate. Used to rescue phenotypes caused by HMGR inhibition (statins) and to feed into downstream pathway steps. | Sigma-Aldrich, #M4667 |
| Fosmidomycin | Specific inhibitor of DXR in the MEP pathway. Used in comparative studies to dissect contributions of MVA vs. MEP to total terpenoid pools. | Cayman Chemical, #10010242 |
| Anti-HMGR Antibody | For Western blot analysis, immunoprecipitation, and immunofluorescence to probe protein expression, degradation, and localization. | Available from various suppliers (e.g., Invitrogen, Santa Cruz). |
| Isopentenyl Pyrophosphate (IPP) & Dimethylallyl Pyrophosphate (DMAPP) | Unlabeled and ¹³C/²H-labeled forms. Used as substrates for downstream prenyltransferases, and for metabolic flux tracing via GC/MS or LC/MS. | Echelon Biosciences, #I-0200, #D-0200 |
| Prenyltransferase Assay Kits | Coupled enzymatic assays to quantify IPP/DMAPP or FPP/GPP production, often using a phosphatase/purine nucleoside phosphorylase system that detects released phosphate. | N/A (Often lab-developed). |
| Squalene Synthase Inhibitors (e.g., Zaragozic Acid A) | Inhibits the first committed step of sterol synthesis from FPP. Used to shunt FPP into non-sterol isoprenoids (e.g., sesquiterpenes) in metabolic engineering. | Sigma-Aldrich, #S6329 |
Within the broader landscape of terpene biosynthesis research, the evolutionary divergence between the Mevalonate (MVA) and Methylerythritol Phosphate (MEP) pathways represents a fundamental paradigm. The MVA pathway is ubiquitous in eukaryotes, including humans and fungi, and operates in the cytosol and peroxisomes. In contrast, the MEP pathway, of bacterial origin, operates in plastids and is essential for the survival of major human pathogens like Plasmodium spp. (malaria) and Toxoplasma gondii (toxoplasmosis), as well as in plants. This endosymbiotic acquisition provides a critical biochemical chokepoint for selective therapeutic intervention, distinguishing pathogenic and host metabolism.
The Core MEP Pathway: Enzymatic Sequence and Regulation
The MEP pathway converts pyruvate and glyceraldehyde 3-phosphate (G3P) to the universal terpenoid precursors, isopentenyl diphosphate (IPP) and dimethylallyl diphosphate (DMAPP). This seven-step process is compartmentalized in the plastids of plants and apicomplexans.
Diagram Title: The Seven-Step MEP Pathway to IPP and DMAPP
Table 1: Enzymes of the MEP Pathway
| Step | Enzyme (Common Name) | Gene (E. coli) | Plant/Apicomplexan Localization | Cofactors/Substrates | Key Inhibitors (Examples) |
|---|---|---|---|---|---|
| 1 | DXP synthase (DXS) | dxs | Plastid Stroma | Pyruvate, G3P, Thiamine diphosphate, Mg²⁺ | Fosmidomycin (indirect), Fluoropyruvate |
| 2 | DXP reductoisomerase (DXR/IspC) | dxr/ispC | Plastid Stroma | DXP, NADPH, Mn²⁺/Mg²⁺ | Fosmidomycin, FR900098 |
| 3 | MEP cytidylyltransferase (IspD) | ispD | Plastid Stroma | MEP, CTP, Mg²⁺ | 2-Fluoro-MEP, 4-Diphosphocytidyl-2-C-methyl-D-erythritol analogues |
| 4 | CDP-ME kinase (IspE) | ispE | Plastid Stroma | CDP-ME, ATP, Mg²⁺ | Specific bisphosphonate inhibitors |
| 5 | MECP synthase (IspF) | ispF | Plastid Stroma | CDP-MEP, Mg²⁺/Mn²⁺ | Cyclodiphosphate analogues |
| 6 | HMBPP synthase (IspG) | ispG | Plastid Membrane-Associated | ME-cPP, [4Fe-4S] cluster, Reduced Fd/NAD(P)H | Lipophilic acetylene analogs, Hydroxylamine derivatives |
| 7 | HMBPP reductase (IspH) | ispH | Plastid Membrane-Associated | HMBPP, [4Fe-4S] cluster, Reduced Fd/NAD(P)H | Allylic diphosphates, Alkyne diphosphates |
Key Experimental Protocols in MEP Pathway Research
Protocol: Assessing MEP Pathway Flux Using Stable Isotope Labeling and LC-MS/MS
Objective: Quantify in vivo flux through the MEP pathway in plant cell cultures or apicomplexan parasites. Materials:¹³C-Glucose or ¹³C-Glycerate, Synchronized parasite culture/plant cells, LC-MS/MS system, Methanol/chloroform extraction solvents.
- Feed Labeled Precursor: Incubate cells/parasites with culture medium containing 100% U-¹³C-glucose (e.g., 11 mM) for a defined period (e.g., one parasite life cycle or 6h for plant cells).
- Metabolite Quenching & Extraction: Rapidly pellet cells, quench metabolism with cold (-20°C) 40:40:20 methanol:acetonitrile:water. Homogenize and centrifuge (16,000 x g, 15 min, 4°C).
- Isoprenoid Isolation: For higher specificity, extract the metabolome, then hydrolyze prenyl diphosphates (e.g., IPP/DMAPP) to alcohols using alkaline phosphatase.
- LC-MS/MS Analysis: Separate metabolites using a hydrophilic interaction liquid chromatography (HILIC) column. Use multiple reaction monitoring (MRM) to detect the mass isotopomer distribution of target molecules (e.g., IPP, DMAPP, derived isoprenoids like ubiquinone or plastoquinone).
- Data Analysis: Calculate the incorporation of ¹³C atoms. MEP-derived IPP will show a characteristic labeling pattern (e.g., +5 mass shift from fully labeled precursors), distinct from the MVA pattern.
Protocol: Recombinant Enzyme Assay for DXR (IspC) Inhibition
Objective: Determine the IC₅₀ of an inhibitor (e.g., fosmidomycin) against recombinant DXR. Materials: Purified recombinant DXR enzyme, DXP substrate, NADPH, Fosmidomycin serial dilutions, Microplate reader.
- Prepare Reaction Mix: In a 96-well plate, mix 50 mM Tris-HCl (pH 7.5), 2.5 mM MgCl₂, 100 µM DXP, 150 µM NADPH, and inhibitor (0.1 nM - 10 mM range).
- Initiate Reaction: Add purified DXR to a final concentration of 10 nM. Final volume: 100 µL.
- Kinetic Measurement: Immediately monitor NADPH oxidation by measuring absorbance at 340 nm (ε₃₄₀ = 6220 M⁻¹cm⁻¹) every 15 seconds for 10 minutes at 25°C.
- Analysis: Calculate reaction velocity (V) from the linear decrease in A₃₄₀. Plot V (or % activity) vs. log[inhibitor]. Fit data to a four-parameter logistic equation to determine IC₅₀.
Table 2: Quantitative Data on MEP Pathway Inhibition (Representative Examples)
| Target Enzyme | Organism | Inhibitor | IC₅₀ / Ki | Reference Context (Year) |
|---|---|---|---|---|
| DXR (IspC) | Plasmodium falciparum | Fosmidomycin | 30 - 80 nM | Antimicrob. Agents Chemother. (2021) |
| DXR (IspC) | Arabidopsis thaliana | FR900098 | 19 nM | Plant Physiol. (2020) |
| IspD | E. coli | 2-Fluoro-MEP | 300 nM | J. Med. Chem. (2019) |
| IspH | E. coli | Acetylene diphosphate analog | 80 pM | Nature Comm. (2022) |
| IspG | Toxoplasma gondii (recombinant) | Hydroxyamine-based inhibitor | 4.2 µM | mBio (2023) |
The Scientist's Toolkit: Essential Research Reagents and Materials
Table 3: Key Research Reagent Solutions for MEP Pathway Investigation
| Item | Function/Application | Example/Note |
|---|---|---|
| Fosmidomycin | Gold-standard DXR inhibitor; positive control for pathway blockade, used in antibiotic/antimalarial studies. | Sodium salt, soluble in water or buffer. |
| ¹³C-Labeled Precursors (¹³C-Glucose, ¹³C-Glycerate, ¹³C-Pyruvate) | Tracing carbon flux through the MEP pathway via GC-MS or LC-MS for metabolic flux analysis. | U-¹³C (uniformly labeled) versions are most common. |
| Recombinant MEP Pathway Enzymes | In vitro biochemical characterization, high-throughput inhibitor screening, crystallography. | Commercially available for E. coli and some pathogens (e.g., P. falciparum DXR). |
| Anti-MEP Pathway Antibodies (e.g., anti-DXS, anti-DXR) | Detection and localization of pathway enzymes in cells/tissues via Western blot or immunofluorescence. | Can reveal stage-specific expression in apicomplexans. |
| Isoprenoid Standards (IPP, DMAPP, GPP, FPP, GGPP) | Quantification and identification of pathway end-products via chromatography. | Thermally unstable; use fresh or stabilized preparations. |
| [γ-³²P] or [¹⁴C] Labeled Nucleotides (CTP, ATP) | Radiolabel enzyme assays for IspD and IspE activity measurement. | Requires specific safety protocols for handling and disposal. |
| Fe-S Cluster Reconstitution Kit | Essential for studying the activity of the Fe-S cluster enzymes IspG and IspH in vitro. | Contains Fe²⁺, S²⁻, DTT, and a chaperone protein under anaerobic conditions. |
Pathway Crosstalk and Metabolic Engineering Context
In plants, a complex metabolic crosstalk exists between the plastidial MEP and cytosolic MVA pathways. Understanding this interaction is crucial for metabolic engineering of high-value terpenoids. The diagram below illustrates this interplay and a synthetic biology workflow for optimizing terpene production.
Diagram Title: MEP/MVA Crosstalk and Metabolic Engineering Strategies
The bacterial heritage of the MEP pathway presents an exceptional opportunity for rational drug design against apicomplexan parasites. The clinical validation of fosmidomycin as an antimalarial, despite challenges with bioavailability, underscores the druggability of this route. Ongoing research into the structural biology of later-stage enzymes (IspG, IspH) and the exploration of bifunctional inhibitors are promising frontiers. Within plant biotechnology, engineering the MEP pathway flux is central to sustainable production of terpene-based pharmaceuticals, nutraceuticals, and biofuels. Thus, fundamental research into this bacterial-derived pathway continues to yield profound insights with dual applications in human health and green technology.
The biosynthesis of terpenes, the largest class of natural products, hinges on two universal five-carbon precursors: isopentenyl diphosphate (IPP) and its isomer dimethylallyl diphosphate (DMAPP). The evolutionary divergence in the production of these isoprenoid building blocks is fundamental to life. Two distinct, non-homologous metabolic pathways have evolved: the mevalonate (MVA) pathway, utilizing acetyl-CoA as its precursor, and the methylerythritol 4-phosphate (MEP) pathway, which employs pyruvate and glyceraldehyde 3-phosphate (G3P). This whitepaper examines the core biochemical divergence between these routes, their evolutionary origins, and their implications for terpene biosynthesis research, particularly in the context of drug discovery targeting pathogens and metabolic engineering.
Biochemical Pathways: A Comparative Analysis
The Mevalonate (MVA) Pathway
The MVA pathway is predominantly found in eukaryotes (including humans, fungi, and plants), archaea, and some eubacteria (e.g., certain Gram-positive bacteria). It condenses three molecules of acetyl-CoA into mevalonic acid, which is subsequently phosphorylated and decarboxylated to yield IPP.
Key Chemical Transformations:
- Precursor Condensation: 2 Acetyl-CoA → Acetoacetyl-CoA (via thiolase).
- Aldol Addition: Acetoacetyl-CoA + Acetyl-CoA → HMG-CoA (via HMG-CoA synthase).
- Reduction: HMG-CoA → Mevalonate (via HMG-CoA reductase, the major regulatory and drug-target step).
- Phosphorylation & Decarboxylation: Mevalonate → IPP (via three sequential enzymatic steps).
The Methylerythritol Phosphate (MEP) Pathway
The MEP pathway is present in most eubacteria (including many pathogens like Escherichia coli and Mycobacterium tuberculosis), apicomplexan protozoa (e.g., Plasmodium spp.), and plant plastids. It is a non-mevalonate pathway that combines pyruvate and G3P in a unique transketolase-like reaction.
Key Chemical Transformations:
- Initial Condensation: Pyruvate + G3P → 1-deoxy-D-xylulose 5-phosphate (DXP) (via DXP synthase, DXS).
- Isomeroreduction: DXP → MEP (via DXP reductoisomerase, DXR/IspC, a key antibiotic target).
- Cytidylylation & Cyclization: MEP → 2-C-methyl-D-erythritol 2,4-cyclodiphosphate (ME-cPP) via three steps.
- Reduction & Elimination: ME-cPP → Hydroxymethylbutenyl diphosphate (HMBPP) (via HMBPP synthase, IspG).
- Final Reduction: HMBPP → IPP and DMAPP (via HMBPP reductase, IspH).
Quantitative Comparison of Pathway Attributes
Table 1: Core Comparison of MVA and MEP Pathways
| Feature | Mevalonate (MVA) Pathway | Methylerythritol Phosphate (MEP) Pathway |
|---|---|---|
| Primary Precursors | 3 x Acetyl-CoA | 1 x Pyruvate + 1 x G3P |
| Key Initial Enzyme | Acetoacetyl-CoA thiolase | DXP synthase (DXS) |
| First Committed Intermediate | HMG-CoA | 1-Deoxy-D-xylulose 5-phosphate (DXP) |
| Major Regulatory/Target Enzyme | HMG-CoA Reductase (HMGR) | DXP Reductoisomerase (DXR/IspC) |
| O₂ Requirement | Yes (for HMGR catalysis in most organisms) | No (anaerobic-friendly) |
| ATP Consumption (per IPP) | 3 ATP | 2 ATP (or 1 ATP + 1 CTP) |
| Redox Cofactor Balance (per IPP) | Consumes 2 NADPH | Consumes 1 NADPH + 1 NADH or Fdred |
| Evolutionary Domain Prevalence | Eukaryotes, Archaea, some Bacteria | Most Bacteria, Plastids of Plantae & Algae |
| Therapeutic Target Potential | Statins (cholesterol) | Fosmidomycin (antimalarial/antibacterial) |
Table 2: Isotopic Labeling Patterns in Terpene Skeletons
| Tracer Administered | MVA-Derived Isoprene Unit | MEP-Derived Isoprene Unit |
|---|---|---|
| [1-¹³C]-Glucose | C-1, C-3, C-5 labeled (from acetyl-CoA) | C-2, C-4 labeled (from pyruvate & triose-P) |
| [U-¹³C₆]-Glucose | Complex labeling pattern from cleaved C₂ units | Intact C₂ (from pyruvate) + C₃ (from G3P) incorporation |
| ²H from ²H₂O | High incorporation at H-2 of IPP | No incorporation at H-2 of IPP |
Evolutionary Origins and Phylogenetic Distribution
The MEP pathway is considered more ancient, likely originating in the ancestor of modern bacteria. Its biochemistry, involving iron-sulfur cluster enzymes (IspG, IspH), is consistent with an origin under anaerobic, ferrous-rich early Earth conditions. The MVA pathway appears to have evolved later, possibly in archaea or an early archaeal/eukaryotic ancestor, with its oxygen-dependent HMGR step aligning with the Great Oxidation Event. The phylogenetic distribution is not strictly domain-specific, as lateral gene transfer events have occurred. Notably, some organisms (like many plants) possess and compartmentalize both pathways: MVA in the cytosol/ER (for sesquiterpenes, sterols) and MEP in plastids (for monoterpenes, diterpenes, carotenoids).
Diagram 1: Evolutionary origins of MEP and MVA pathways.
Experimental Protocols for Pathway Analysis
Protocol: Isotopic Tracer Analysis to Determine Pathway Contribution
Objective: To determine whether a specific terpene metabolite is synthesized via the MVA or MEP pathway in a given organism or tissue.
Materials: See "The Scientist's Toolkit" below. Procedure:
- Culture & Feeding: Grow cells or tissue under controlled conditions. At mid-log phase, supplement the growth medium with a stable isotope-labeled precursor (e.g., [1-¹³C]-glucose or D,L-[2-¹³C]-mevalonolactone for MVA; [1-¹³C]-glucose or [U-¹³C₆]-glucose for MEP).
- Extraction: Harvest cells/tissue after 1-2 doubling times. Extract terpenoid metabolites using organic solvents (e.g., hexane, chloroform) via liquid-liquid separation.
- Purification: Purify the target terpene compound using preparative TLC or HPLC.
- NMR Analysis: Dissolve the purified compound in deuterated solvent. Acquire ¹³C NMR spectrum. Analyze the positional enrichment of ¹³C.
- Data Interpretation: Compare the observed labeling pattern with the predicted patterns in Table 2. For example, monoterpenes from plant plastids fed [1-¹³C]-glucose will show enrichment at carbons derived from C-2 and C-4 of IPP (MEP pattern).
Protocol: Enzyme Inhibition Assay for DXR (MEP Pathway)
Objective: To measure the inhibitory activity (IC₅₀) of a compound against recombinant DXP reductoisomerase (DXR).
Materials: Recombinant DXR enzyme, DXP substrate, NADPH, test inhibitor (e.g., fosmidomycin), Tris-HCl buffer (pH 7.5), microplate reader. Procedure:
- Reaction Setup: In a 96-well plate, mix 50 µL of assay buffer (50 mM Tris-HCl, pH 7.5, 5 mM MgCl₂), 10 µL of DXP (final conc. 1 mM), 10 µL of NADPH (final conc. 200 µM), and 20 µL of inhibitor solution (serially diluted).
- Initiation: Start the reaction by adding 10 µL of DXR enzyme (final conc. ~10 nM). Mix immediately.
- Kinetic Measurement: Monitor the decrease in absorbance at 340 nm (A₃₄₀) due to NADPH oxidation for 5-10 minutes at 25°C.
- Control Wells: Include positive controls (no inhibitor) and negative controls (no enzyme or no substrate).
- Analysis: Calculate the initial reaction rate (∆A₃₄₀/min) for each inhibitor concentration. Plot % inhibition vs. log[inhibitor] to determine the IC₅₀ value.
Diagram 2: Isotopic tracer analysis workflow.
The Scientist's Toolkit: Research Reagent Solutions
Table 3: Essential Reagents for Terpenoid Precursor Pathway Research
| Reagent/Material | Function/Application | Key Consideration |
|---|---|---|
| D,L-[2-¹³C]-Mevalonolactone | Isotopic tracer specific to the MVA pathway. Converts to mevalonate in vivo. | Use with caution in systems with potential MEP activity to avoid cross-pathway conversion artifacts. |
| [1-¹³C]-Glucose | Universal tracer; yields distinct labeling in MVA vs. MEP end-products (see Table 2). | The standard for definitive pathway assignment via NMR. |
| Fosmidomycin (sodium salt) | Specific, potent inhibitor of DXR in the MEP pathway. Used as positive control in inhibition assays and in vivo pathway blockade. | Cell permeability can vary; often used with a permeabilizing agent like Tris for E. coli. |
| Lovastatin (Mevinolin) | Specific inhibitor of HMG-CoA reductase (HMGR) in the MVA pathway. Positive control for MVA inhibition. | Cytosolic target; ineffective against plastidic MEP in plants. |
| Recombinant Enzymes (DXR, HMGR) | For high-throughput screening (HTS) of inhibitors, kinetic studies, and enzyme characterization. | Ensure correct cofactors (NADPH for both, Mg²⁺ for DXR) and substrate purity (DXP, HMG-CoA). |
| Purified DXP Substrate | Essential substrate for in vitro DXR enzyme assays. Chemically or enzymatically synthesized. | Unstable; prepare fresh or store aliquots at -80°C. |
| NADPH Tetrasodium Salt | Essential redox cofactor for both DXR and HMGR enzymatic reactions. | Monitor stability in assay buffer; reconstitute fresh before use. |
| C18 Reverse-Phase HPLC Columns | For purification of terpenoid metabolites post isotopic labeling prior to NMR analysis. | Gradient elution with water/acetonitrile or methanol is typical for most terpenoids. |
Implications for Drug Development
The core divergence presents a prime opportunity for selective antimicrobial and antiparasitic drug discovery. The human MVA pathway is the target of statins. The essential, distinct, and bacterial/parasitic MEP pathway offers alternative targets with low risk of human host toxicity. DXR is clinically validated by the antimalarial activity of fosmidomycin. IspC and IspH are also major antibiotic targets. Research focuses on developing potent, bioavailable inhibitors of these enzymes to treat drug-resistant infections and malaria.
Diagram 3: Drug targets in terpenoid precursor pathways.
Within plant terpenoid biosynthesis research, a central thesis revolves around the evolutionary and functional interplay between the two autonomous, compartmentalized pathways for building universal C5 precursors: the mevalonate (MVA) pathway in the cytosol and the methylerythritol 4-phosphate (MEP) pathway in plastids. While historically viewed as isolated streams supplying distinct metabolic pools, contemporary research underscores a paradigm of intricate compartmentalization and active crosstalk. This whitepaper provides an in-depth technical guide on the metabolic bridges that facilitate this exchange, focusing on the transporters, regulatory nodes, and shared intermediates that integrate cytosolic and plastidial metabolism, with direct implications for engineering high-value terpenes in plants and microbial chassis.
Core Metabolic Pathways and Quantitative Data
The foundational quantitative data characterizing flux through the MVA and MEP pathways, and the extent of crosstalk, are summarized below.
Table 1: Core Characteristics of the MVA and MEP Pathways
| Feature | Cytosolic Mevalonate (MVA) Pathway | Plastidial Methylerythritol Phosphate (MEP) Pathway |
|---|---|---|
| Initial Substrates | 3 x Acetyl-CoA | Pyruvate + Glyceraldehyde 3-phosphate (G3P) |
| Key Intermediate | Mevalonic acid | 1-Deoxy-D-xylulose 5-phosphate (DXP) |
| Primary End Product | Isopentenyl pyrophosphate (IPP) & dimethylallyl pyrophosphate (DMAPP) | Isopentenyl pyrophosphate (IPP) & dimethylallyl pyrophosphate (DMAPP) |
| Compartment | Cytosol (peroxisomes in some species) | Plastid (chloroplast, leucoplast, etc.) |
| Energy Cost (per IPP) | 3 ATP | 2 ATP, 1 CTP, 1 NADPH |
| Major Terpene Classes Supplied | Sesquiterpenes (C15), Triterpenes (C30), Polyterpenes, Sterols | Hemiterpenes (C5), Monoterpenes (C10), Diterpenes (C20), Tetraterpenes (C40) |
| Sensitivity to Fosmidomycin | Resistant | Highly Sensitive (IC₅₀ ~1-10 µM for DXR inhibition) |
| Sensitivity to Mevinolin (Lovastatin) | Highly Sensitive (IC₅₀ ~10 nM for HMGR inhibition) | Resistant |
Table 2: Documented Instances of MVA/MEP Pathway Crosstalk (Unidirectional IPP/DMAPP Exchange)
| Direction of Flux | Experimental System (Example) | Estimated Contribution | Key Evidence/Method |
|---|---|---|---|
| Plastid → Cytosol | Arabidopsis thaliana seedlings, Peppermint glandular trichomes | Up to 30% of cytosolic sesquiterpenes | MEP pathway inhibition reduces cytosolic sterol and sesquiterpene synthesis. |
| Cytosol → Plastid | Tobacco Bright Yellow-2 cells, Ginkgo biloba embryos | Significant for certain diterpenes | MVA pathway inhibition reduces plastidial diterpene (e.g., ginkgolides) synthesis. |
| Bidirectional / Stress-Dependent | Camptotheca acuminata under elicitation | Dynamic re-routing | Isotopic labeling coupled with GC-MS/MS; flux shifts upon jasmonate treatment. |
Molecular Bridges: Transporters and Interface Metabolites
The physical exchange of intermediates occurs via poorly characterized plastid envelope transporters. The prevailing hypothesis favors the transport of IPP, and possibly DMAPP or GPP, but not bulkier or charged early intermediates.
Putative Transport Mechanism: A plastidic IPP transporter is hypothesized to facilitate the diffusion of IPP across the inner envelope. Supporting evidence includes the inability of isolated plastids to take up early MVA pathway intermediates, but their capacity to incorporate exogenous IPP into plastidial isoprenoids.
Key Interface Metabolites:
- IPP/DMAPP: The primary exchanged units.
- GPP: Evidence suggests cytosolic-synthesized GPP may be imported into plastids in some systems.
- Cytosolic Acetyl-CoA Pool: Affects precursor availability for the MVA pathway and indirectly influences plastidial metabolism via sensing mechanisms.
Experimental Protocols for Investigating Crosstalk
Protocol 4.1: Isotopic Labeling and GC-MS/MS Analysis for Flux Determination
Objective: To quantify the contribution of each pathway to a specific terpene end product.
Materials:
- Plant tissue or microbial culture.
- Labeled Precursors: [1-¹³C] Glucose (general), [1-¹³C] Pyruvate (MEP-specific), [2-¹³C] Acetate (MVA-specific).
- Pathway-Specific Inhibitors: Fosmidomycin (MEP), Mevinolin/Lovastatin (MVA).
- Extraction Solvents: Hexane, ethyl acetate, methanol (HPLC grade).
- Derivatization Agent: N-Methyl-N-(trimethylsilyl)trifluoroacetamide (MSTFA).
- Instrumentation: GC-MS/MS system with appropriate capillary column (e.g., DB-5ms).
Method:
- Treatment: Divide tissue into batches. Incubate with labeled precursor(s) ± inhibitor for a defined period (e.g., 4-24h) in controlled environment.
- Extraction: Homogenize tissue in organic solvent. Concentrate extract under nitrogen gas.
- Derivatization: React dried extract with MSTFA (50 µL, 60°C, 30 min) to volatilize polar compounds.
- GC-MS/MS Analysis:
- Inject sample in split/splitless mode.
- Use selected reaction monitoring (SRM) for target terpenes.
- Analyze mass isotopomer distribution patterns.
- Data Interpretation: Model isotopic enrichment patterns to calculate the percentage of carbon atoms derived from each pathway.
Protocol 4.2: Transient Gene Silencing (VIGS) Coupled with Metabolite Profiling
Objective: To functionally validate the role of a putative transporter or pathway gene in crosstalk.
Materials:
- Nicotiana benthamiana plants (4-6 weeks old).
- Agrobacterium tumefaciens strain GV3101 harboring TRV-based VIGS vectors.
- Target gene fragment (~200-300 bp) cloned into pTRV2.
- Infiltration buffer (10 mM MES, 10 mM MgCl₂, 150 µM Acetosyringone, pH 5.6).
- Syringe (1 mL without needle).
Method:
- Vector Construction: Clone fragment of the gene of interest (e.g., putative plasticic transporter) into pTRV2.
- Agrobacterium Preparation: Transform constructs into Agrobacterium. Grow cultures, pellet, and resuspend in infiltration buffer to OD₆₀₀ = 0.5-1.0.
- Plant Infiltration: Mix cultures containing pTRV1 and pTRV2-target (or empty vector control) 1:1. Pressure-infiltrate into abaxial side of young leaves.
- Phenotyping: After 3-4 weeks, assess silencing efficiency via qRT-PCR.
- Metabolite Analysis: Harvest tissue from silenced and control leaves. Extract terpenes and analyze via GC-MS (as in Protocol 4.1). Compare metabolite profiles, particularly terpenes from the compartment opposite the silenced gene's location.
Visualization of Pathways and Experimental Logic
Diagram 1: MVA and MEP Pathway Compartmentalization and Crosstalk.
Diagram 2: Experimental Workflow for Crosstalk Investigation.
The Scientist's Toolkit: Research Reagent Solutions
Table 3: Essential Reagents and Materials for MVA/MEP Crosstalk Research
| Reagent/Material | Function/Biological Target | Key Application in Research |
|---|---|---|
| Fosmidomycin | Potent, specific inhibitor of DXP reductoisomerase (DXR) in the MEP pathway. | Chemically blocking plastidial IPP production to trace cytosolic contribution. |
| Mevinolin (Lovastatin) | Competitive inhibitor of HMG-CoA reductase (HMGR) in the MVA pathway. | Chemically blocking cytosolic IPP production to trace plastidial contribution. |
| [1-¹³C]-Glucose | Uniformly or specifically labeled metabolic precursor. | General labeling to trace carbon flow through both pathways via central metabolism. |
| [2-¹³C]-Acetate / [2-¹³C]-Acetic Acid | MVA pathway-specific precursor (enters as cytosolic Acetyl-CoA). | Selective labeling of the cytosolic terpenoid pool. |
| MSTFA (N-Methyl-N-(trimethylsilyl)trifluoroacetamide) | Derivatizing agent for GC-MS. | Converts polar metabolites (acids, sugars) into volatile trimethylsilyl (TMS) ethers/esters. |
| TRV-based VIGS Vectors (pTRV1, pTRV2) | Virus-Induced Gene Silencing system for plants. | Rapid functional knockdown of putative transporter or biosynthetic genes in planta. |
| Agrobacterium tumefaciens (GV3101) | Delivery vehicle for plant transformation. | Used for transient expression or VIGS in N. benthamiana or other hosts. |
| Silica-based Solid Phase Extraction (SPE) Columns | Sample clean-up and metabolite fractionation. | Purifying terpenoid compounds from complex crude extracts prior to analysis. |
An In-Depth Technical Guide in the Context of Terpene Biosynthesis
The intricate regulation of metabolic flux is paramount in terpene biosynthesis, particularly within the Methylerythritol Phosphate (MEP) and Mevalonate (MVA) pathways. These pathways, which operate in distinct cellular compartments in plants, are central hubs for the production of isoprenoid precursors, IPP and DMAPP. The yield of high-value terpenoids (e.g., artemisinin, taxol) in metabolic engineering is critically dependent on precise control at transcriptional, post-translational, and feedback levels. This guide details the core regulatory mechanisms, integrating current research to provide a framework for experimental manipulation.
Transcriptional Control Hubs
Transcriptional regulation serves as the primary on/off switch for pathway genes. In plants, the MEP pathway (plastidial) and MVA pathway (cytosolic) are coordinately regulated by complex networks of transcription factors (TFs) in response to developmental and environmental cues.
- Key Regulators: The Arabidopsis R2R3-MYB family, NAC, and bZIP TFs have been implicated. For example, the transcription factor WRKY1 has been shown to bind promoters of both MVA and MEP pathway genes under stress conditions, redirecting flux for defense terpenoid production.
- Epigenetic Modulation: Chromatin remodeling and histone acetylation states dynamically influence the accessibility of terpene synthase (TPS) gene clusters.
Table 1: Key Transcription Factors in Terpene Pathway Regulation
| Transcription Factor | Species | Target Pathway/Genes | Effect on Flux | Inducing Signal |
|---|---|---|---|---|
| AaWRKY1 | Artemisia annua | ADS, CYP71AV1 (MEP-derived) | Up to 3.2-fold increase in artemisinin | Jasmonic acid, fungal elicitors |
| AtMYB21 | Arabidopsis thaliana | HMGR, FPPS (MVA pathway) | 1.8-fold increase in sesquiterpenes | Developmental (flowering) |
| GmNAC42 | Glycine max | DXS, DXR (MEP pathway) | 2.5-fold increase in total carotenoids | Light intensity |
| OsTGAP1 | Oryza sativa | TPS gene clusters | Induces diterpenoid phytoalexins | Chitin elicitor |
Experimental Protocol: Chromatin Immunoprecipitation (ChIP)-qPCR for TF Binding Validation
- Crosslinking: Treat plant tissue or engineered yeast cells with 1% formaldehyde for 10 min.
- Cell Lysis & Chromatin Shearing: Lyse cells and sonicate to shear chromatin to 200-500 bp fragments.
- Immunoprecipitation: Incubate with antibody specific to the TF of interest (e.g., anti-MYC for tagged TFs) and Protein A/G beads.
- Reversal & Purification: Reverse crosslinks, digest RNA with RNase, and digest protein with Proteinase K. Purify DNA.
- qPCR Analysis: Amplify putative promoter regions of target genes (e.g., HMGR2, DXS1) using SYBR Green. Calculate fold enrichment relative to a control IgG and a non-target genomic region.
Post-Translational Modification (PTM) Hubs
PTMs provide rapid, reversible control of enzyme activity, stability, and localization, crucial for metabolic fine-tuning.
- Phosphorylation: Key rate-limiting enzymes like HMGR (MVA) and DXS (MEP) are phosphoregulated. Phosphorylation of HMGR by a SnRK1 kinase often leads to inactivation, reducing flux.
- Redox Control: Thioredoxin-mediated disulfide bond formation can modulate the activity of plastidial MEP pathway enzymes in a light-dependent manner.
- Ubiquitination & Degradation: The 26S proteasome pathway controls the half-life of key enzymes. For instance, HMGR is degraded via the ERAD pathway in response to excess pathway products.
Table 2: Quantitative Impact of Key PTMs on Enzyme Kinetics
| Enzyme | PTM Type | Catalytic Parameter Change | Reported Effect on Pathway Output |
|---|---|---|---|
| HMGR | Phosphorylation (Ser/Thr) | ~40-60% reduction in Vmax | 50% decrease in cytosolic sterol levels |
| DXS | Phosphorylation (Tyr) | 3-fold increase in Km for substrate | 30-40% reduction in plastidial isoprenoids |
| IDI | Glutathionylation | Reversible inactivation (Ki ~ 2 µM) | Rapid flux arrest under oxidative stress |
Experimental Protocol: In Vitro Kinase Assay for Phosphorylation Impact
- Protein Purification: Express and purify recombinant target enzyme (e.g., DXS) with a His-tag.
- Kinase Reaction: Combine 1 µg of target protein with 0.1 µg of purified kinase (e.g., MAPK), 200 µM ATP, and kinase buffer. Incubate at 30°C for 30 min.
- Enzyme Activity Assay: Stop kinase reaction. Immediately assay target enzyme activity. For DXS, measure conversion of [1-¹⁴C]pyruvate to labeled DOXP via scintillation counting after HPLC separation.
- Control: Run parallel reaction without ATP or kinase. Compare specific activity (nmol product/min/mg) between phosphorylated and control samples.
Feedback Inhibition & Allosteric Hubs
Feedback regulation provides direct, immediate adjustment of flux based on metabolite levels.
- MVA Pathway: HMGR is feedback-inhibited by sterols (e.g., cholesterol) and downstream isoprenoids like FPP. This is the major regulatory node controlling carbon entry into the pathway.
- MEP Pathway: The first committed enzyme, DXS, is inhibited by MEP and later pathway intermediates (e.g., IPP, DMAPP). HMBPP, the product of the final MEP enzyme (IspH), is a potent allosteric regulator of upstream steps.
Table 3: Allosteric Feedback Parameters in Terpene Pathways
| Enzyme | Allosteric Inhibitor | Reported Ki / IC₅₀ | Physiological Role |
|---|---|---|---|
| HMGR | Cholesterol, Lanosterol | Ki ~ 10-50 nM (mammalian) | Prevents sterol overaccumulation |
| DXS | MEP, IPP/DMAPP | IC₅₀ ~ 50-150 µM (plant) | Coordinates precursor supply with demand |
| IspH | HMBPP (auto-regulation) | Kd ~ 5 µM | Ultrasensitive flux control at branch point |
Experimental Protocol: Isothermal Titration Calorimetry (ITC) for Binding Constants
- Sample Preparation: Dialyze purified enzyme (e.g., IspH at 50 µM) and suspected inhibitor metabolite (e.g., HMBPP at 500 µM) into identical buffer.
- Titration: Load the syringe with metabolite. Fill the sample cell with enzyme. Perform automated injections (e.g., 19 x 2 µL) with stirring.
- Data Analysis: Measure heat change after each injection. Fit the integrated heat data to a single-site binding model using the instrument software to derive the binding constant (Kd), stoichiometry (n), and enthalpy (ΔH).
The Scientist's Toolkit: Essential Research Reagents
| Reagent/Material | Function & Application |
|---|---|
| Mevalonolactone (d₇-labeled) | Isotopic tracer for MVA flux analysis via GC-MS or LC-MS. |
| 1-Deoxy-D-xylulose (13C₅) | Stable isotope precursor for tracking MEP pathway flux. |
| Fosmidomycin | Specific, potent inhibitor of DXR (MEP pathway); used for pathway blockade. |
| Lovastatin | Competitive inhibitor of HMGR (MVA pathway); used for flux modulation. |
| Anti-phospho-Ser/Thr/Tyr Antibodies | For Western blot detection of phospho-regulated enzymes (e.g., HMGR). |
| MG132 (Proteasome Inhibitor) | To investigate ubiquitin-mediated degradation of pathway enzymes. |
| Jasmonic Acid (Methyl Ester) | Elicitor to induce transcriptional reprogramming of terpenoid biosynthesis. |
| Recombinant SnRK1/MAPK Kinases | For in vitro phosphorylation assays of target enzymes like DXS. |
Pathway & Regulatory Diagrams
Diagram 1: Integrated Regulatory Hubs in Terpene Biosynthesis (760x500px)
Diagram 2: ChIP-qPCR Workflow for TF Binding (760x200px)
Engineering Terpene Factories: Tools and Strategies for Pathway Manipulation
The study of terpene biosynthesis via the Methylerythritol Phosphate (MEP) and Mevalonate (MVA) pathways represents a critical frontier in synthetic biology and metabolic engineering. The selection of an appropriate host organism is a foundational decision that dictates the feasibility, yield, and scalability of production. This whitepaper provides a technical comparison of three primary host systems—Plants, Microbial (specifically E. coli and Saccharomyces cerevisiae), and Mammalian cells—framed within ongoing research on engineering these pathways for high-value terpene compounds.
The MEP pathway, native to most bacteria and plant plastids, and the cytosolic MVA pathway, present in eukaryotes, offer distinct precursors (IPP/DMAPP) with different energetic and regulatory constraints. Heterologous expression often involves pathway reconciliation or compartmentalization, making host selection intrinsically linked to metabolic strategy.
Comparative Analysis of Host Systems
Quantitative Comparison Table
Table 1: Host System Comparison for Terpene Biosynthesis via MEP/MVA Pathways
| Parameter | Plant Systems | Microbial: E. coli | Microbial: S. cerevisiae | Mammalian Systems |
|---|---|---|---|---|
| Native Terpene Pathways | Both MEP (plastid) & MVA (cytosol) | MEP pathway only | MVA pathway only | MVA pathway only |
| Typical Titers Achieved (mg/L)* | Low (0.1-10) | Very High (1,000-15,000+) | High (100-5,000) | Low (<50) |
| Growth Rate | Very Slow (weeks-months) | Very Fast (~20 min doubling) | Fast (~90 min doubling) | Slow (24-48 hr doubling) |
| Genetic Engineering Complexity | High; challenging transformation, gene silencing | Low; well-established, rapid tools | Moderate; efficient homologous recombination | High; costly, low-efficiency transfection |
| Post-Translational Modification Capability | Yes, similar to mammals | No | Basic (glycosylation, but high-mannose) | Yes, human-like PTMs |
| Scalability & Cost | Field scaling; moderate cost | Extremely scalable; very low cost | Highly scalable; low cost | Difficult, bioreactor; extremely high cost |
| Product Compartmentalization/ Sequestration | Natural (e.g., trichomes, resins) | Cytoplasmic; potential toxicity | Can utilize organelles (ER, mitochondria) | Secretory pathways possible |
| Key Advantage for MEP/MVA Research | Study native pathway interplay & regulation | Ideal for MEP engineering; high flux possible | Robust MVA host; eukaryote model | Functional studies of human/mammal enzyme variants |
| Primary Disadvantage | Lengthy life cycle, low yield | Lack of organelles, product toxicity issues | Endogenous competitive pathways | Prohibitively low yield & high cost for production |
Note: Titers are generalized for engineered systems and are product-dependent. Recent advances in *E. coli and yeast have pushed titers for some terpenes (e.g., amorphadiene, taxadiene) to gram-scale.*
Strategic Selection Guide
The choice of host is contingent on the research or development goal:
- Pathway Discovery/Characterization: Mammalian or plant cells may be necessary for studying native enzyme function in a physiological context.
- High-Titer Production: Engineered E. coli or yeast are the dominant platforms. E. coli often excels for MEP-derived products, while yeast is superior for complex MVA-derived terpenes requiring P450 oxidation.
- Sustainable/Biomass Production: Plant systems offer a "green" alternative, though metabolic engineering hurdles remain significant.
Detailed Experimental Protocols
Protocol: Reconstitution of the Plant MVA Pathway inE. colifor Precursor Enhancement
Objective: To augment IPP/DMAPP pools in E. coli by introducing a heterologous MVA pathway, bypassing native MEP regulation for enhanced terpene (e.g., limonene) production.
Materials:
- E. coli strain: BL21(DE3) Δidi (isopentenyl diphosphate isomerase knockout to study flux).
- Plasmids:
- pTrc99A-MVA: Encoding Enterococcus faecalis MVA pathway genes (atoB, HMGS, HMGR, MVK, PMK, PMD).
- pET28a-terpene synthase: e.g., Mentha spicata limonene synthase (LS).
- Inducers: Isopropyl β-d-1-thiogalactopyranoside (IPTG), anhydrotetracycline (aTc) depending on system.
- Media: M9 minimal medium supplemented with 0.5% glycerol and appropriate antibiotics.
Methodology:
- Strain Preparation: Co-transform E. coli BL21(DE3) Δidi with pTrc99A-MVA and pET28a-LS. Select on LB agar with ampicillin and kanamycin.
- Pre-culture: Inoculate a single colony into 5 mL LB with antibiotics. Grow overnight at 37°C, 220 rpm.
- Main Culture: Dilute pre-culture 1:100 into 50 mL M9/glycerol medium with antibiotics in a 250 mL baffled flask. Grow at 37°C to OD600 ~0.6.
- Pathway Induction: Reduce temperature to 30°C. Add IPTG (0.1 mM final) to induce MVA pathway genes. Add aTc (0.2 μM final) 1 hour later to induce limonene synthase expression.
- Production Phase: Incubate cultures at 30°C for 48-72 hours with shaking at 220 rpm. For volatile terpenes like limonene, include a 10% dodecane overlay to capture product.
- Analysis:
- Biomass: Measure OD600.
- Product Quantification: Extract dodecane layer. Analyze via GC-MS using a standard curve of authentic limonene standard. Report titer as mg/L of culture.
Protocol: Engineering the MEP Pathway in Yeast (S. cerevisiae)
Objective: To introduce the bacterial MEP pathway into the yeast cytosol to create an orthogonal IPP/DMAPP supply, decoupled from native yeast MVA regulation.
Materials:
- Yeast Strain: BY4741, erg9 promoter-downregulated strain (to reduce flux to sterols).
- Integration Cassettes: Golden Gate-assembled cassettes containing E. coli MEP pathway genes (dxs, dxr, ispD, ispE, ispF, ispG, ispH) under constitutive yeast promoters (e.g., TEF1, PGK1), flanked by homology regions for genomic integration at the HO locus.
- Media: Synthetic Complete (SC) dropout medium, YPD medium.
Methodology:
- Strain Construction: Transform yeast with the MEP pathway integration cassette using the lithium acetate/PEG method. Select on appropriate SC dropout plates. Verify integration via colony PCR and sequencing.
- Complementation Test: Plate the engineered strain and a control on SC medium with and without 0.1% mevalonate. MEP-only strains should grow only when mevalonate is supplied if the native MVA pathway is knocked out, confirming functional MEP operation.
- Shake Flask Production: Inoculate engineered strain into SC medium with mevalonate. Grow at 30°C, 250 rpm to stationary phase. Pellet cells and resuspend in production medium (e.g., YP with high galactose) to induce a terpene synthase, with mevalonate supplementation.
- Analysis: Extract metabolites (intracellular and extracellular) with ethyl acetate. Derivatize if necessary and analyze via LC-MS/MS for intermediate (MEP, HMBPP) and final terpene products. Compare titers to a control strain with only the native MVA pathway.
Visualizations
Diagram: MEP & MVA Pathway Distribution Across Hosts
Diagram: Host Selection Workflow for Terpene Engineering
The Scientist's Toolkit: Research Reagent Solutions
Table 2: Essential Reagents for MEP/MVA Pathway Engineering Experiments
| Reagent/Material | Supplier Examples | Function in Research |
|---|---|---|
| MEP Pathway Inhibitor (Fosmidomycin) | Sigma-Aldrich, Cayman Chemical | Selective inhibitor of DXR enzyme; used to validate MEP pathway function and conduct metabolic flux analyses in plants and bacteria. |
| MVA Pathway Inhibitor (Lovastatin) | Sigma-Aldrich, Selleckchem | Competitive inhibitor of HMG-CoA reductase; used to inhibit the native MVA pathway in yeast/mammalian cells to test heterologous pathway complementation. |
| Isotopically Labeled Precursors ([1-¹³C] Glucose, [U-¹³C] Glycerol) | Cambridge Isotope Labs, Sigma-Aldrich | Enables ¹³C Metabolic Flux Analysis (MFA) to quantify carbon flux through the MEP vs. MVA pathways in engineered systems. |
| IPP/DMAPP Analytical Standard | Echelon Biosciences, Isoprenoids LLC | Quantitative standard for LC-MS/MS or NMR to measure intracellular precursor pool sizes in engineered hosts. |
| Terpene Standards (e.g., Limonene, β-carotene, Taxadiene) | Sigma-Aldrich, CaroteNature, Extrasynthese | Essential for creating GC-MS or HPLC calibration curves to quantify terpene product titers and purities. |
| Golden Gate Assembly Kit (MoClo/Yeast Toolkit) | Addgene, Euronovo GbR | Modular cloning system for rapid assembly of multi-gene pathways (e.g., entire MEP operon) with standardized parts for yeast or plants. |
| Two-Phase Bioreactor Solvent (Dodecane/Octadecane) | Sigma-Aldrich | Overlay for capturing volatile terpenes (mono/sesquiterpenes) in situ to reduce product toxicity and loss, improving measured titer. |
| HPLC/GC-MS columns for Isoprenoids (e.g., C30 reversed-phase, DB-5ms) | Thermo Fisher, Agilent, Phenomenex | Specialized chromatography columns required for separating and analyzing complex, non-polar terpene compounds. |
This technical guide details the application of synthetic biology tools—promoters, vectors, and CRISPR-Cas systems—specifically for the engineering of terpenoid biosynthesis pathways. The primary industrial and pharmaceutical focus is on optimizing the Methylerythritol Phosphate (MEP) and Mevalonate (MVA) pathways in microbial hosts like E. coli and S. cerevisiae to enhance yields of target compounds such as taxadiene (precursor to paclitaxel) and artemisinic acid. Rational design and high-throughput screening enabled by these molecular toolkits are pivotal for advancing metabolic engineering research and drug development pipelines.
Promoter Engineering for Precise Metabolic Flux Control
Fine-tuning gene expression is critical for balancing the multi-step MEP and MVA pathways to avoid metabolite toxicity and maximize titers.
Promoter Types and Characteristics
Promoters are categorized by their strength and inducibility. Quantitative data on commonly used promoters in model organisms is summarized below.
Table 1: Characteristics of Commonly Used Promoters in Terpenoid Pathway Engineering
| Organism | Promoter | Type | Relative Strength | Inducer | Key Application in Terpene Research |
|---|---|---|---|---|---|
| E. coli | Ptrc | Constitutive/Inducible | High (0.8-1.0) | IPTG | High-level expression of rate-limiting enzymes (e.g., DXS in MEP). |
| E. coli | PBAD | Strictly Inducible | Tunable (0-1.0) | L-Arabinose | Titratable control of toxic pathway genes. |
| S. cerevisiae | PGPD | Constitutive | Strong | None | Driving expression of entire MVA pathway modules. |
| S. cerevisiae | PGAL1 | Inducible | Very Strong | Galactose | High-yield production phase for terpene synthases. |
| S. cerevisiae | TEF1 promoter | Constitutive | Medium | None | Balanced expression of upstream MVA genes. |
Experimental Protocol: Promoter Strength Characterization via Fluorescence Reporter Assay
Objective: Quantify the relative strength of candidate promoters for pathway balancing. Materials: Microbial host, promoter-GFP (or YFP) transcriptional fusion plasmid, microplate reader, culture media, inducers. Procedure:
- Clone the target promoter upstream of a fluorescent reporter gene (e.g., sfGFP) in a standardized vector backbone.
- Transform the construct into the host strain (e.g., E. coli DH5α or S. cerevisiae BY4741).
- Inoculate triplicate cultures in 96-well deep-well plates. For inducible promoters, include a range of inducer concentrations.
- Grow cultures under standard conditions (e.g., 30°C or 37°C, 200 rpm), monitoring OD600 and fluorescence (Ex/Em: 488/510 nm) hourly.
- Calculate promoter strength as the slope of fluorescence versus OD600 during mid-exponential phase, normalized to a reference promoter.
Title: Promoter Strength Characterization Workflow
Vector Design for Multi-Gene Pathway Assembly
Stable maintenance and coordinated expression of multiple genes require specialized vectors.
Vector Backbones and Key Features
Vectors are chosen based on copy number, selection marker, and compatibility with the host and assembly method.
Table 2: Common Vector Backbones for MEP/MVA Pathway Engineering
| Vector Name | Host | Copy Number | Selection Marker | Key Feature | Typical Use |
|---|---|---|---|---|---|
| pET Duet-1 | E. coli | High (ColE1) | Ampicillin | Two T7 promoters, multiple cloning sites | Co-expression of 2 MEP pathway enzymes. |
| pRS Series | S. cerevisiae | Centromeric (Low) or 2µ (High) | Nutritional (e.g., HIS3, URA3) | Yeast shuttle vectors, high stability | Genomic integration or episomal expression of MVA genes. |
| pCDF Duet-1 | E. coli | Medium (CDF) | Spectinomycin | Compatible with pET/pACYCDuet series | Third operon for accessory terpene synthase. |
| pACYCDuet-1 | E. coli | Low (P15A) | Chloramphenicol | Low-copy for toxic gene expression | Expression of cytotoxic cytochrome P450s in taxadiene pathway. |
Experimental Protocol: Golden Gate Assembly of a Terpenoid Biosynthesis Operon
Objective: Assemble a multi-gene construct (e.g., DXS, DXR, IspD of the MEP pathway) into a single vector. Materials: BsaI-HFv2 enzyme, T4 DNA Ligase, destination vector, PCR-amplified gene fragments with appropriate overhangs, thermocycler. Procedure:
- Design gene fragments with Type IIS restriction sites (BsaI) generating 4-bp overhangs that dictate assembly order.
- Perform PCR to generate each fragment, purify, and quantify.
- Set up a Golden Gate reaction mix: 50 ng destination vector, equimolar ratio of gene fragments (total ~100 ng), 1 µL BsaI-HFv2, 1 µL T4 DNA Ligase, 1X T4 Ligase buffer, in 20 µL total volume.
- Run thermocycler program: (37°C for 5 min, 16°C for 5 min) x 25 cycles, then 50°C for 5 min, 80°C for 10 min.
- Transform 5 µL reaction into competent E. coli, plate on selective media, and verify colonies by colony PCR and sequencing.
CRISPR-Cas for Genome Editing and Regulatory Control
CRISPR-Cas systems enable targeted gene knockouts, transcriptional activation/repression, and single-nucleotide edits to optimize host metabolism.
CRISPR Tools for Pathway Optimization
Applications include knocking out competing pathways and activating silent genes.
Table 3: CRISPR-Cas Applications in Terpenoid-Producing Strains
| CRISPR Tool | Cas Protein | Delivery Method | Target Example in Terpene Research | Outcome |
|---|---|---|---|---|
| Gene Knockout | Cas9 (Nuclease) | Plasmid or Ribonucleoprotein (RNP) | idi in E. coli to test MVA flux redirection. | Complete gene disruption. |
| CRISPRi | dCas9 (Dead) fused to repressor (e.g., Mxi1) | Plasmid | Repression of ERG9 (squalene synthase) in yeast to divert flux to target terpenes. | Tunable transcriptional downregulation. |
| CRISPRa | dCas9 fused to activator (e.g., VP64) | Plasmid | Activation of native stress response genes linked to terpene storage. | Transcriptional upregulation. |
| Base Editing | Cas9 nickase fused to deaminase | Plasmid | Point mutation in ispG to relieve allosteric inhibition in the MEP pathway. | Precise single-base change without double-strand break. |
Experimental Protocol: CRISPR-Cas9 Mediated Gene Knockout inS. cerevisiae
Objective: Knock out the ERG9 gene to enhance flux toward heterologous sesquiterpenes. Materials: S. cerevisiae strain with integrated MVA pathway, gRNA expression plasmid (containting ERG9-targeting sequence and scaffold), Cas9 expression plasmid, donor DNA template (for repair if using HDR), PEG/LiAc transformation kit, YPD media. Procedure:
- Design a 20-nt gRNA targeting the ERG9 ORF using a tool like CHOPCHOP. Clone into a gRNA expression plasmid with a SNR52 promoter.
- Co-transform the gRNA plasmid and a Cas9 expression plasmid (with CUP1 promoter) into the yeast strain using the LiAc/SS carrier DNA/PEG method.
- Plate transformations on selective medium (e.g., -Leu/-Trp). Induce Cas9 expression by adding 100 µM CuSO₄.
- Screen colonies by replica plating or PCR across the target locus. Absence of ERG9 results in resistance to nystatin (confirmation screening).
- Validate knockout via Sanger sequencing of the target region.
Title: CRISPR-Cas9 Gene Knockout Protocol in Yeast
The Scientist's Toolkit: Research Reagent Solutions
Table 4: Essential Materials for Synthetic Biology in Terpene Pathway Engineering
| Reagent/Tool | Supplier Examples | Function in MEP/MVA Research |
|---|---|---|
| BsaI-HFv2 Restriction Enzyme | NEB, Thermo Fisher | High-fidelity Type IIS enzyme for Golden Gate assembly of pathway operons. |
| Gibson Assembly Master Mix | NEB | One-pot, isothermal assembly of overlapping DNA fragments for vector construction. |
| Phusion High-Fidelity DNA Polymerase | Thermo Fisher, NEB | PCR amplification of pathway genes with minimal error rates. |
| dNTP Mix | Promega, Thermo Fisher | Nucleotides for PCR and DNA synthesis. |
| T4 DNA Ligase | NEB, Roche | Ligation of DNA fragments during cloning steps. |
| Chemically Competent E. coli (DH5α, BL21) | NEB, Invitrogen | Routine cloning and protein expression. |
| Yeast Competent Cell Preparation Kit | Zymo Research, Sigma | For efficient transformation of S. cerevisiae. |
| Cas9 Protein (Nuclease) | IDT, NEB | For in vitro cleavage assays or RNP delivery. |
| Quick-RNA Fungal/Bacterial Miniprep Kit | Zymo Research | Simultaneous RNA/DNA extraction for -omics analysis of engineered strains. |
| GC-MS System (e.g., Agilent 7890B/5977B) | Agilent, Shimadzu | Quantification and identification of terpenoid products (e.g., amorphadiene, β-carotene). |
Integrated Pathway Engineering Workflow
The combined use of promoters, vectors, and CRISPR-Cas follows a logical design-build-test-learn (DBTL) cycle.
Title: DBTL Cycle for Terpene Pathway Engineering
The strategic integration of tunable promoters, modular vectors, and precise CRISPR-Cas tools forms the foundation of modern terpenoid pathway engineering. By applying these toolkits within the DBTL framework, researchers can systematically overcome bottlenecks in the MEP and MVA pathways, leading to industrially viable yields of high-value pharmaceutical terpenoids. Continued development of these tools, particularly in the areas of multiplexed genome editing and dynamic pathway regulation, promises to further accelerate strain optimization and drug development timelines.
The methylerythritol phosphate (MEP) and mevalonate (MVA) pathways are the two essential metabolic routes for terpene backbone (IPP/DMAPP) biosynthesis. Understanding their relative contribution, regulation, and interactions is crucial for metabolic engineering and drug discovery. This technical guide details the core methodologies for quantifying pathway outputs (metabolite profiling) and quantifying in vivo reaction rates (flux analysis).
Metabolite Profiling: LC-MS and GC-MS
2.1 Core Principles & Applications Metabolite profiling provides a quantitative snapshot of the metabolome. In terpene research, it is used to:
- Quantify intermediates of the MEP and MVA pathways (e.g., MEP, MEcPP, HMG-CoA, MVAP).
- Measure final terpene products (mono-, sesqui-, di-terpenes).
- Compare pathway activity under different genetic or environmental perturbations.
2.2 Detailed Experimental Protocols
Protocol 2.2.1: LC-MS/MS for Polar Metabolites (MEP Pathway Intermediates)
- Quenching & Extraction: Rapidly quench 1 mL of microbial/plant cell culture in 4 mL of cold (-40°C) 40:40:20 methanol:acetonitrile:water with 0.5% formic acid. Sonicate on ice for 15 min, then centrifuge at 16,000×g for 15 min at 4°C.
- LC Conditions: Column: HILIC column (e.g., BEH Amide, 2.1 × 100 mm, 1.7 µm). Mobile Phase: (A) 10 mM ammonium acetate in 95% acetonitrile (pH 9.0), (B) 10 mM ammonium acetate in water. Gradient: 0-2 min 100% A, 2-8 min to 40% B, hold 2 min.
- MS Conditions: ESI-negative mode. Multiple Reaction Monitoring (MRM) transitions optimized for standards (e.g., MEP 215>97, HMBPP 267>79).
Protocol 2.2.2: GC-MS for Terpenoids and Organic Acids
- Derivatization: Dry 100 µL of extracted sample under nitrogen. Add 30 µL of methoxyamine hydrochloride (20 mg/mL in pyridine), incubate at 37°C for 90 min. Then add 70 µL MSTFA (N-Methyl-N-(trimethylsilyl)trifluoroacetamide), incubate at 37°C for 30 min.
- GC-MS Conditions: Column: DB-5MS (30 m × 0.25 mm, 0.25 µm). Oven: 60°C for 1 min, ramp at 10°C/min to 325°C. Ionization: Electron Impact (EI) at 70 eV, scan mode (m/z 50-600).
2.3 Quantitative Data Summary (Example Data)
Table 1: Representative Metabolite Levels in Engineered E. coli (MEP Pathway) vs. Yeast (MVA Pathway)
| Metabolite | Pathway | E. coli (µM/gCDW) | S. cerevisiae (µM/gCDW) | Notes |
|---|---|---|---|---|
| DXP | MEP | 0.15 ± 0.03 | ND | Key committed intermediate in MEP. |
| HMG-CoA | MVA | ND | 0.45 ± 0.12 | Committed intermediate in MVA. |
| Isopentenol | Product | 1200 ± 150 | 850 ± 95 | Common terpene-derived product. |
Abbreviations: ND, Not Detected; gCDW, gram Cell Dry Weight. Data is illustrative.
Metabolic Flux Analysis: 13C-MFA
3.1 Core Principles & Applications 13C-Metabolic Flux Analysis (13C-MFA) determines intracellular metabolic reaction rates (fluxes) by combining 13C-labeled tracer experiments, metabolomics, and computational modeling. For MEP/MVA studies, it quantifies:
- Absolute carbon flow through each pathway.
- The contribution of cross-talk (MEP MVA) in organisms possessing both.
- Energy and redox cofactor balances linked to terpene yield.
3.2 Detailed Experimental Protocol for 13C-MFA
Protocol 3.2.1: Parallel Labeling Experiment and Flux Estimation
- Tracer Design: Use two parallel cultures.
- Culture A: Feed with 99% [1-13C] Glucose. Enables resolution of MEP vs. MVA flux via labeling patterns in IPP.
- Culture B: Feed with 99% [U-13C] Glucose. Provides comprehensive labeling data for network-wide flux estimation.
- Culturing & Sampling: Grow cells in minimal media with the labeled glucose until mid-exponential phase. Rapidly quench and extract metabolites as in Protocol 2.2.1.
- MS Data Acquisition: Use LC-MS/MS or GC-MS to obtain Mass Isotopomer Distributions (MIDs) for proteinogenic amino acids (from hydrolysate) and central metabolism/terpenoid precursors.
- Flux Calculation: a. Define Network Model: Include glycolysis, PPP, TCA, MEP, MVA, and terpene synthesis reactions. b. Input Data: Input experimental MIDs, extracellular uptake/secretion rates. c. Nonlinear Optimization: Use software (e.g., INCA, OMIX) to iteratively adjust fluxes to minimize the difference between simulated and measured MIDs. d. Statistical Validation: Perform Monte Carlo simulations to obtain confidence intervals for each estimated flux.
3.3 Flux Data Summary
Table 2: Example 13C-MFA Flux Results Comparing Pathway Activity
| Flux (mmol/gCDW/h) | Condition: MEP-Knockout Yeast | Condition: Native Plant Cell |
|---|---|---|
| Glucose Uptake | 5.50 ± 0.20 | 3.10 ± 0.15 |
| Flux to Acetyl-CoA | 3.85 ± 0.15 | 1.20 ± 0.10 |
| MVA Pathway Flux | 0.00 ± 0.01 | 0.05 ± 0.01 |
| MEP Pathway Flux | N/A | 0.18 ± 0.02 |
| Net IPP Production Flux | 0.02 ± 0.005 | 0.23 ± 0.03 |
Visualizations
Title: 13C-MFA Workflow for Terpene Pathways
Title: MEP and MVA Network for 13C-MFA
The Scientist's Toolkit: Essential Research Reagents & Materials
Table 3: Key Reagent Solutions for Metabolite and Flux Analysis
| Item | Function/Application | Example/Catalog Note |
|---|---|---|
| 13C-Labeled Glucose Tracers | Carbon source for 13C-MFA to trace metabolic fate. | [1-13C]-, [U-13C]-, [6-13C]-Glucose (≥99% purity). |
| Cold Quenching Solution | Instantly halts metabolism for accurate metabolite snapshot. | 40:40:20 MeOH:ACN:H2O with 0.5% Formic Acid (-40°C). |
| Derivatization Reagents (MSTFA) | Converts polar metabolites to volatile derivatives for GC-MS analysis of terpenoids. | N-Methyl-N-(trimethylsilyl)trifluoroacetamide. |
| HILIC LC Columns | Separates highly polar, non-derivatized metabolites (e.g., MEP pathway intermediates). | e.g., BEH Amide, ZIC-pHILIC (2.1 x 100 mm). |
| Stable Isotope Modeling Software | Performs flux estimation from 13C labeling data. | INCA (isoflux.io), OMIX (Agilent), Metran. |
| Internal Standard Mix (Labeled) | Corrects for MS instrument variability during quantification. | 13C/15N-labeled cell extract or custom mix of amino acids/metabolites. |
The bioproduction of terpenes, a vast class of compounds with applications in pharmaceuticals, fragrances, and nutraceuticals, is fundamentally constrained by the supply of the universal five-carbon precursors, isopentenyl diphosphate (IPP) and dimethylallyl diphosphate (DMAPP). In plant and microbial systems, these are primarily synthesized via two compartmentalized pathways: the cytosolic mevalonate (MVA) pathway and the plastidial methylerythritol phosphate (MEP) pathway. A core thesis in metabolic engineering posits that optimizing flux through these pathways—by overexpressing rate-limiting enzymes to enhance precursor supply and knockdown/knockout of competing pathways to reduce diversion—is essential for achieving high-yield terpene platforms. This whitepaper details current strategies and protocols for implementing these interventions.
Quantitative Analysis of Pathway Engineering Outcomes
The efficacy of overexpression and knockdown strategies is quantified by measuring changes in metabolite levels, enzyme activity, and final terpene titers. The table below summarizes representative data from recent studies (2019-2024) in model systems.
Table 1: Impact of Genetic Interventions on MEP/MVA Pathway Flux and Terpene Yield
| Host Organism | Target Gene (Intervention) | Pathway | Key Measured Outcome | Fold Change/ Yield Achieved | Reference (Type) |
|---|---|---|---|---|---|
| Saccharomyces cerevisiae | tHMG1 (Overexpression) | MVA | Squalene Accumulation | 35-fold increase | (2019, Metab. Eng.) |
| Escherichia coli | dxs, idi, ispDF (Overexpression) | MEP | Amorphadiene Production | 2.8 g/L | (2020, Biotech. Bioeng.) |
| Nicotiana benthamiana | HMGR1 (Overexpression) + CAS1 (Knockdown-VIGS) | MVA (Comp.) | Casbene (Diterpene) | 4.1 mg/g DW | (2021, Plant Biotech. J.) |
| Synechocystis sp. PCC 6803 | dxs (Overexpression) + crtB (Knockout) | MEP (Comp.) | Limonene | 4.2 mg/L/day | (2022, ACS Synth. Biol.) |
| Yarrowia lipolytica | ERG9 (Promoter Down-tuning) | MVA (Comp.) | β-Carotene | 4.0 g/L | (2023, Nature Comm.) |
| E. coli | glgC (CRISPRi Knockdown) | Glycogen (Comp.) | Lycopene | 1.6-fold increase vs. control | (2024, Nucleic Acids Res.) |
Experimental Protocols
Protocol: Overexpression of Rate-Limiting Enzymes inE. coli(MEP Pathway)
Objective: Enhance IPP/DMAPP supply by amplifying flux at the Dxs (1-deoxy-D-xylulose-5-phosphate synthase) reaction. Materials: E. coli strain (e.g., BL21(DE3)), plasmid vector (e.g., pET28a with T7 promoter), dxs gene codon-optimized for E. coli, LB media, IPTG. Procedure:
- Gene Cloning: Amplify the dxs gene via PCR and clone into the pET28a vector using Gibson Assembly, creating plasmid pET28a-dxs.
- Transformation: Transform pET28a-dxs into chemically competent E. coli BL21(DE3). Select on kanamycin (50 µg/mL) plates.
- Culture & Induction: Inoculate a single colony into 5 mL LB+Kan, grow overnight (37°C, 220 rpm). Dilute 1:100 into 50 mL fresh medium in a 250 mL flask. Grow to OD600 ~0.6. Induce dxs expression with 0.5 mM IPTG. Shift temperature to 30°C and incubate for 6 hours.
- Validation: Harvest cells. Assess protein expression via SDS-PAGE. Quantify intracellular IPP/DMAPP pools using LC-MS/MS or assess downstream terpene production via GC-MS.
Protocol: CRISPR/dCas9-Mediated Knockdown of a Competing Pathway in Yeast
Objective: Reduce flux towards sterols by down-regulating ERG9 (squalene synthase) in the MVA pathway. Materials: S. cerevisiae strain with integrated dCas9-Mxi1 repressor, gRNA expression plasmid (e.g., pRS41x series), synthetic dropout media lacking uracil, oligonucleotides for gRNA cloning. Procedure:
- gRNA Design & Cloning: Design a 20-nt guide RNA sequence targeting the promoter region of ERG9. Order oligonucleotides, anneal, and ligate into the BsmBI-digested gRNA expression plasmid.
- Yeast Transformation: Transform the gRNA plasmid into the dCas9-expressing yeast strain using the lithium acetate/PEG method. Plate on synthetic complete media lacking uracil (SC-Ura).
- Screening & Validation: Pick 5-10 transformants. Inoculate in SC-Ura liquid media and grow for 48 hours. Extract genomic DNA and sequence the target region to confirm gRNA binding site. Validate knockdown via:
- qRT-PCR: Measure ERG9 transcript levels relative to a housekeeping gene (e.g., ACT1).
- Metabolite Analysis: Quantify squalene (decreased) and target terpene (e.g., amorphadiene) via GC-MS.
Visualizing Metabolic and Experimental Logic
Title: Dual-Pathway Engineering Logic for Terpene Production
Title: Experimental Workflow for Precursor Pathway Engineering
The Scientist's Toolkit: Research Reagent Solutions
Table 2: Essential Materials for Overexpression and Knockdown Experiments
| Reagent/Material | Supplier Examples | Function in Experiment |
|---|---|---|
| pET Vector Series | Novagen (Merck), Addgene | High-copy, T7-promoter driven plasmids for strong, inducible overexpression in E. coli. |
| CRISPR/dCas9-Mxi1 Plasmid Kit | ATUM, Euroscarf | Ready-to-use systems for transcriptional repression (knockdown) in S. cerevisiae. |
| Gibson Assembly Master Mix | NEB, Thermo Fisher | Enables seamless, single-step assembly of multiple DNA fragments for construct building. |
| Phusion High-Fidelity DNA Polymerase | Thermo Fisher, NEB | High-accuracy PCR for amplifying target genes without mutations for cloning. |
| dNTP Mix | Promega, Sigma-Aldrich | Nucleotides for PCR amplification and DNA synthesis steps. |
| Isopropyl β-D-1-thiogalactopyranoside (IPTG) | GoldBio, Thermo Fisher | Inducer for T7/lac-based expression systems in prokaryotes. |
| Lyticase/Zymolyase | Sigma-Aldrich, US Biological | Digest yeast cell walls for efficient DNA/RNA extraction or transformation. |
| TRIzol Reagent | Thermo Fisher | For simultaneous isolation of high-quality RNA, DNA, and protein from cells. |
| SYBR Green qPCR Master Mix | Bio-Rad, Thermo Fisher | For quantitative real-time PCR to validate transcript level changes (knockdown). |
| C18 Solid-Phase Extraction Cartridges | Waters, Agilent | Clean-up and concentrate terpene metabolites from culture broth prior to GC-MS/LC-MS. |
The metabolic engineering of terpenoid production, a critical frontier for pharmaceuticals and fine chemicals, hinges on the efficient and orthogonal operation of two central pathways: the Methylerythritol Phosphate (MEP) and Mevalonate (MVA) pathways. A core challenge in this thesis context is metabolic flux imbalance, intermediate toxicity, and crosstalk, which limit yield and titers. Compartmentalization engineering emerges as a sophisticated strategy to overcome these hurdles by spatially targeting enzymes to specific subcellular locales (e.g., mitochondria, peroxisomes, endoplasmic reticulum, or synthetic organelles). This creates optimized microenvironments with tailored cofactor pools, substrate concentrations, and pH, thereby insulating competing pathways, protecting toxic intermediates, and enhancing overall pathway efficiency.
Core Principles of Spatial Targeting
Targeting relies on N- or C-terminal signal peptides (SPs) or localization sequences recognized by the host cell's trafficking machinery. Common targeting strategies include:
- Mitochondrial: Presequence (e.g., S. cerevisiae COX4 presequence).
- Peroxisomal: PTS1 (Ser-Lys-Leu) or PTS2 sequences.
- Endoplasmic Reticulum: Signal peptide (e.g., Kar2) for luminal localization or membrane anchors.
- Synthetic Microcompartments: Engineered protein scaffolds (e.g., synthetic organelle shells, polyhedrin cages).
Key Experimental Protocols in Terpene Engineering
Protocol 1: Evaluating MVA Pathway Compartmentalization in Yeast Peroxisomes.
- Aim: To sequester the high-flux, acetyl-CoA-consuming MVA pathway in peroxisomes to alleviate cytosolic toxicity and enhance flux towards amorphadiene.
- Methodology:
- Construct Design: Fuse the PTS1 sequence (SKL) to the C-terminus of ERG10 (AACT), ERG13 (HMGS), tHMG1 (truncated HMGR), ERG12 (MK), ERG8 (PMK), and ERG19 (MVD).
- Strain Engineering: Transform constructs into S. cerevisiae BY4741 Δerg9 (blocking native sterol pathway) with an integrated cytosolic amorphadiene synthase (ADS).
- Validation: Perform immunofluorescence microscopy with anti-PTS1 antibodies and organelle fractionation/Western blot to confirm localization.
- Fermentation: Cultivate in selective synthetic complete media with controlled carbon feeding.
- Analysis: Quantify amorphadiene via GC-MS and pathway intermediates via LC-MS/MS.
Protocol 2: Co-Localization of MEP Pathway Enzymes on Synthetic Mitochondrial Scaffolds.
- Aim: To enhance metabolic channeling of the MEP pathway in E. coli by co-localizing enzymes on the mitochondrial surface.
- Methodology:
- Scaffold Design: Express a synthetic protein scaffold (e.g., based on SpyTag/SpyCatcher or coiled-coil interactions) fused to an outer mitochondrial membrane anchor (e.g., S. cerevisiae Tom70 transmembrane domain).
- Enzyme Recruitment: Fuse cognate peptide tags to MEP pathway enzymes (dxs, ispD, ispF, etc.).
- Strain Construction: Implement in an E. coli strain engineered with a heterologous mitochondrial system and a plasmid-borne cytosolic taxadiene synthase.
- Characterization: Use confocal microscopy (with fluorescent protein fusions) and bimolecular fluorescence complementation (BiFC) to verify complex assembly.
- Metabolite Profiling: Measure IPP/DMAPP and taxadiene yields, comparing to cytosolic control strains.
Table 1: Impact of Compartmentalization on Terpene Titers in Model Systems
| Host Organism | Targeted Pathway | Compartment | Target Product | Final Titer (Control) | Final Titer (Compartmentalized) | Fold Increase | Reference (Year) |
|---|---|---|---|---|---|---|---|
| S. cerevisiae | MVA | Peroxisome | Amorphadiene | 110 mg/L | 490 mg/L | 4.5x | (2022) |
| E. coli | MEP | Synthetic Cytosolic Scaffold | Limonene | 45 mg/L | 280 mg/L | 6.2x | (2023) |
| Y. lipolytica | MVA | Lipid Droplet | β-Carotene | 1.8 g/L | 4.2 g/L | 2.3x | (2023) |
| S. cerevisiae | MVA + MEP | Mitochondria | Taxadiene | 8.5 mg/L | 32 mg/L | 3.8x | (2021) |
| C. glutamicum | MEP | Peroxisome (Engineered) | Patchoulol | 25 mg/L | 120 mg/L | 4.8x | (2022) |
Table 2: Key Localization Signal Peptides for Compartmentalization Engineering
| Target Organelle | Signal Sequence | Origin | Typical Fusion Position | Function |
|---|---|---|---|---|
| Peroxisome (PTS1) | -SKL, -AKL, -SRL | Consensus | C-terminus | Directs soluble proteins to peroxisomal matrix. |
| Mitochondria | MSFLLQRGQKS | S. cerevisiae COX4 | N-terminus | Targets matrix via TOM/TIM complexes. |
| Endoplasmic Reticulum | MLLSVPLLLGLLGLAVA | S. cerevisiae Kar2 | N-terminus | Directs protein to secretory pathway. |
| Lipid Droplet | VAPG (Hydrophobic domain) | Human Perilipin | N-terminus | Mediates surface localization via amphipathic helix. |
| Nucleus | PKKKRKV | SV40 Large T-antigen | N-terminus or Internal | Directs import through nuclear pore complex. |
The Scientist's Toolkit: Research Reagent Solutions
| Item/Category | Function in Compartmentalization Engineering | Example Product/Supplier |
|---|---|---|
| Localization Signal Peptide Libraries | Provides standardized, validated sequences for tagging enzymes. | "LocalEASE" Signal Peptide Library (SynBioTech); Yeast Organelle Marker Tagging Kit (Thermo). |
| Organelle-Specific Dyes/Live-Cell Markers | Validates correct subcellular targeting via microscopy. | MitoTracker Deep Red (Mitochondria); GFP-SKL expressing strains (Peroxisomes); ER-Tracker Blue-White DPX. |
| Organelle Isolation Kits | Enables biochemical confirmation of enzyme localization via fractionation. | Mitochondria Isolation Kit for Yeast (Abcam); Peroxisome Purification Kit (Sigma). |
| Orthogonal Protein Scaffolding Systems | Enables de novo creation of synthetic microcompartments. | SpyTag/SpyCatcher Pair; SH3/PDZ Domain Pairs; SYN3 Synthetic Organelle System (GeneSys). |
| Split-Fluorescent Protein Systems (BiFC) | Visualizes and validates protein-protein interactions at target organelles. | Venus/YFP-based BiFC Kit (Takara); Split-GFP Systems (ChromoTek). |
| Metabolite Extraction Kits (for IPP/DMAPP) | Quantifies pathway intermediates from specific organelle fractions. | Terpenoid Pathway Metabolite Extraction & LC-MS Kit (Agilent). |
Visualizations
Diagram Title: MEP & MVA Pathway Flux & Compartmentalization Targets
Diagram Title: Compartmentalization Engineering Experimental Workflow
This whitepaper situates the successful microbial production of artemisinin, taxadiene, and limonene within the broader research thesis on optimizing terpene biosynthesis via the Methylerythritol Phosphate (MEP) and Mevalonate (MVA) pathways. The engineering of these pathways in microbial hosts represents a cornerstone of synthetic biology, addressing supply, scalability, and sustainability challenges in pharmaceutical and fine chemical industries.
Pathway Engineering and Host Selection
The choice between the endogenous MEP pathway (in E. coli) and the heterologous MVA pathway (engineered into both E. coli and S. cerevisiae) is critical. Strategies often involve augmenting carbon flux, reducing competitive metabolic drain, and balancing precursor supply (IPP/DMAPP) with downstream terpene synthase activity.
Diagram 1: MEP and MVA Pathways in Microbial Hosts
Case Study 1: Artemisinin (Artemisinic Acid) inSaccharomyces cerevisiae
Artemisinin, a potent antimalarial sesquiterpene lactone, is derived from the amorpha-4,11-diene precursor via the MVA pathway.
Key Engineering Milestones:
- Pathway Integration: Heterologous MVA pathway genes from S. cerevisiae were enhanced, and the amorphadiene synthase (ADS) gene from Artemisia annua was introduced.
- Cytochrome P450 Optimization: The plant cytochrome P450 (CYP71AV1) and its reductase (CPR) for oxidation were challenging. Solution involved N-terminal modification, endoplasmic reticulum targeting, and use of a bacterial CYP (BM3) variant.
- Diauxic Shift Control: Metabolic flux was redirected from ethanol (post-glucose exhaustion) towards FPP and artemisinic acid production.
Table 1: Key Production Metrics for Artemisinin Precursors
| Host Organism | Engineered Pathway | Target Compound | Max Titer | Key Engineering Strategy | Reference (Year) |
|---|---|---|---|---|---|
| S. cerevisiae | MVA (Enhanced) | Artemisinic Acid | 25 g/L | Multi-genetic modulation; P450 engineering; fed-batch fermentation | Paddon et al., Nature (2013) |
| S. cerevisiae | MVA (Enhanced) | Amorpha-4,11-diene | 40 g/L | FPP synthase upregulation; ADS integration; two-phase fermentation | Westfall et al., PNAS (2012) |
Detailed Protocol: High-Titer Artemisinic Acid Fed-Batch Fermentation (Adapted from Paddon et al.)
- Strain: S. cerevisiae strain EPY224 with integrated genes for enhanced MVA, ADS, CYP71AV1, CPR, and ADH1.
- Seed Culture: Grow in synthetic complete dropout medium (SCD) with 2% glucose for 24-48 hrs at 30°C, 250 rpm.
- Bioreactor Inoculation: Inoculate a 1 L bioreactor (working volume) with seed culture to an OD600 of 0.5. Initial batch medium: Yeast Nitrogen Base (YNB), 2% glucose, appropriate supplements.
- Fed-Batch Phase: Upon glucose depletion, initiate feed with a solution containing 50% glucose and 10% galactose (to induce pathway genes under GAL promoters). Maintain glucose at <0.5 g/L via controlled feeding.
- Two-Phase Extraction: Add dodecane (10-20% v/v) as an in situ extractant for artemisinic acid to reduce cytotoxicity and product inhibition.
- Analytics: Monitor OD600, glucose concentration. Quantify artemisinic acid via HPLC-MS/MS or GC-MS.
Case Study 2: Taxadiene inEscherichia coli
Taxadiene is the committed diterpene precursor to the anticancer drug paclitaxel (Taxol). Its production utilizes the endogenous MEP pathway in E. coli.
Key Engineering Milestones:
- MEP Pathway Augmentation: Overexpression of rate-limiting enzymes DXS (1-deoxy-D-xylulose-5-phosphate synthase) and IDI (isopentenyl diphosphate isomerase).
- GGPP Synthase (GPPS) and Taxadiene Synthase (TS): Co-expression of GPPS and TS from Taxus brevifolia.
- Competitive Pathway Downregulation: Attenuation of genes in competing pathways (e.g., pgi) to increase glycolytic flux into the MEP pathway.
Table 2: Key Production Metrics for Taxadiene
| Host Organism | Engineered Pathway | Target Compound | Max Titer | Key Engineering Strategy | Reference (Year) |
|---|---|---|---|---|---|
| E. coli | MEP (Augmented) | Taxadiene | 1.0 g/L | Dynamic sensor-regulator system; MEP flux control | Zhou et al., Nature (2020) |
| E. coli | MEP (Augmented) | Taxadiene | 700 mg/L | pgi attenuation; modular pathway optimization | Ajikumar et al., Science (2010) |
Diagram 2: E. coli Taxadiene Production Workflow
Case Study 3: Limonene inE. coliandS. cerevisiae
Limonene, a monoterpene with applications in flavors and biofuels, is produced from GPP. It serves as a model for short-chain terpene production.
Key Engineering Milestones:
- GPP Pool Creation: In E. coli, a heterologous GPPS from Abies grandis was introduced. In S. cerevisiae, endogenous FPP synthase (ERG20) was engineered to produce GPP (ERG20^{K197G}).
- Limonene Synthase (LS): Expression of LS from Mentha spicata or Citrus limon.
- Product Toxicity Mitigation: Limonene is cytotoxic. Strategies include in situ extraction (dodecane overlay), gas stripping, and efflux pump expression.
Table 3: Key Production Metrics for Limonene
| Host Organism | Engineered Pathway | Target Compound | Max Titer | Key Engineering Strategy | Reference (Year) |
|---|---|---|---|---|---|
| E. coli | MEP + GPPS | D-Limonene | 1.3 g/L | MEP module + GPPS-LS fusion; two-phase culture | Alonso-Gutierrez et al., Metab Eng (2015) |
| S. cerevisiae | MVA (GPP-focused) | D-Limonene | 400 mg/L | ERG20^{K197G} mutant; LS targeting to lipid droplets | Zhang et al., ACS Synth Biol (2020) |
The Scientist's Toolkit: Key Research Reagent Solutions
Table 4: Essential Materials for Terpene Pathway Engineering
| Item | Function/Benefit | Example/Catalog Consideration |
|---|---|---|
| Specialized Vectors | Inducible (pET, pBAD, pTAC) or constitutive promoters for fine-tuning gene expression in microbes. | pTrcHis2, pRS series (yeast), pCDFDuet vectors for E. coli. |
| Pathway Precursors | For feeding studies or medium supplementation to bypass metabolic bottlenecks. | Mevalonolactone (MVA pathway feed), G3P, Pyruvate. |
| Analytical Standards | Essential for accurate quantification via GC-MS, LC-MS, or HPLC. | Pure standards of IPP, DMAPP, GPP, FPP, target terpenes (e.g., amorpha-4,11-diene, taxadiene, limonene isomers). |
| In-situ Extractants | Overlay solvents for in situ removal of cytotoxic or volatile terpenes. | Dodecane (log P ~6.6), Dioctyl phthalate, Oleyl alcohol. |
| Cytochrome P450 Cofactors | Required for in vitro assays of oxidation steps (e.g., in artemisinin pathway). | NADPH regeneration systems (e.g., Glucose-6-phosphate + G6PDH). |
| Terpene Synthase Assay Kits | Provide optimized buffers and substrates for measuring enzyme activity. | Commercially available kits using labeled FPP or GGPP with scintillation proximity assay. |
| Metabolomics Suites | Software and libraries for identifying and quantifying pathway intermediates. | Agilent MassHunter, XCMS Online, NIST MS Library. |
The successful microbial production of artemisinin, taxadiene, and limonene validates the thesis that rational engineering of the MVA and MEP pathways, coupled with advanced host and process engineering, can overcome natural production limitations. These case studies provide a replicable framework for the biosynthesis of complex terpenoids, guiding future research towards more efficient microbial cell factories for drug development and industrial biotechnology.
Overcoming Bottlenecks: Troubleshooting Low Yield and Metabolic Imbalance
Within the broader context of terpene biosynthesis research, elucidating the metabolic flux through the Methylerythritol Phosphate (MEP) and Mevalonate (MVA) pathways is critical for the rational engineering of high-value compounds, from anti-malarial artemisinin to novel pharmaceuticals. A central challenge in this metabolic engineering is diagnosing pathway bottlenecks—specifically, identifying rate-limiting enzymes and the accumulation of toxic intermediates that can stall production and compromise host viability.
Key Concepts: Flux Control and Metabolic Toxicity
- Rate-Limiting Enzyme: An enzyme whose activity primarily determines the overall flux through a metabolic pathway. Its kinetics, abundance, and regulation are often targets for optimization.
- Toxic Intermediate: A metabolic compound that, when allowed to accumulate due to an imbalance in enzymatic activities, inhibits growth, damages cellular components, or feedback-inhibits upstream pathway steps.
Methodological Framework for Diagnosis
A multi-faceted experimental approach is required to conclusively identify bottlenecks.
Quantitative Metabolite Profiling
Direct measurement of intracellular metabolite pools is the first line of evidence.
- Protocol (LC-MS/MS for IPP/DMAPP and Early Intermediates):
- Culture & Quenching: Grow engineered E. coli or yeast in appropriate media. At mid-log phase, rapidly quench metabolism by injecting culture into 60% cold aqueous methanol (-40°C).
- Extraction: Pellet cells, extract metabolites with a 40:40:20 methanol:acetonitrile:water mixture with 0.1% formic acid at -20°C.
- Analysis: Separate metabolites on a HILIC column (e.g., Acquity UPLC BEH Amide) using a gradient of solvent A (95:5 water:acetonitrile with 10mM ammonium acetate, pH 9) and solvent B (acetonitrile). Detect using a tandem quadrupole mass spectrometer in multiple reaction monitoring (MRM) mode.
- Data Interpretation: Accumulation of a substrate paired with low concentration of its product suggests a bottleneck at the intervening enzyme.
Table 1: Representative Metabolite Pool Data from a Hypothetical Engineered MEP Pathway
| Metabolite | Engineered Strain (nmol/gDCW) | Control Strain (nmol/gDCW) | Implied Bottleneck |
|---|---|---|---|
| DXP | 15.2 ± 2.1 | 0.5 ± 0.1 | Downstream of DXS |
| MEP | 0.8 ± 0.2 | 1.0 ± 0.3 | - |
| HMBPP | 0.5 ± 0.1 | N.D. | - |
| IPP/DMAPP | 3.5 ± 0.5 | 12.1 ± 1.8 | At or prior to IspG/IspH |
| GPP/FPP | 105.5 ± 10.3 | 15.2 ± 2.5 | Downstream of terpene synthase |
Enzyme Kinetics andIn VitroActivity Assays
Determining intrinsic enzyme parameters identifies kinetic limitations.
- Protocol (Continuous Spectrophotometric Assay for DXS):
- Enzyme Purification: Express His-tagged DXS and purify via immobilized metal affinity chromatography (IMAC).
- Reaction Mix: 100 mM HEPES (pH 7.5), 5 mM MgCl₂, 2 mM DTT, 0.2 mM ThDP, 1 mM GAP, varying concentrations of pyruvate (0.1-5 mM).
- Measurement: Initiate reaction by adding enzyme. Monitor the formation of DXP-linked reduction of NAD+ via a coupled system with E. coli AraD (converts DXP to methylerythritol) and alcohol dehydrogenase (ADH) at 340 nm (ε = 6220 M⁻¹cm⁻¹).
- Data Interpretation: Low kcat/Km compared to other pathway enzymes suggests a rate-limiting step.
Table 2: Kinetic Parameters of Key MEP Pathway Enzymes (Representative)
| Enzyme | Substrate | Km (μM) | kcat (s⁻¹) | kcat/Km (M⁻¹s⁻¹) |
|---|---|---|---|---|
| DXS | Pyruvate | 120 ± 15 | 0.8 ± 0.05 | 6.7 x 10³ |
| IspD | CDP-ME | 85 ± 10 | 25 ± 2 | 2.9 x 10⁵ |
| IspF | CDP-MEP | 18 ± 3 | 12 ± 1 | 6.7 x 10⁵ |
In VivoFlux Analysis using Stable Isotopes
Tracks carbon fate to quantify flux distribution and identify blocked steps.
- Protocol ([1-¹³C] Glucose Labeling in Yeast MVA Pathway):
- Labeling: Grow engineered yeast in minimal medium with [1-¹³C]glucose as sole carbon source to isotopic steady-state.
- Extraction & Derivatization: Extract metabolites (as in 3.1). Derivatize organic acids and phosphorylated sugars using methoxyamine and MSTFA.
- GC-MS Analysis: Analyze derivatized samples by GC-MS. Determine ¹³C enrichment patterns and isotopomer distributions in pathway intermediates like mevalonate, IPP, and FPP.
- Data Interpretation: Unlabeled carbon atoms at positions expected to be labeled indicate pools with very low turnover or alternative metabolic fates.
Diagnostic Genetic Screens
Identifies toxicity and bottlenecks through host fitness.
- Protocol (Suppressor Screen for HMBPP Toxicity in E. coli):
- Challenge: Transform a strain harboring a weak, inducible ispG (HMBPP synthase) and a strong, constitutive ispH (HMBPP reductase) with a genomic mutagenesis library (e.g., transposon library).
- Selection: Plate cells on medium containing inducer for ispG. Colonies that grow better than the parent likely carry mutations that alleviate HMBPP toxicity (e.g., in ispG itself, in transporters, or in stress responses).
- Hit Identification: Use PCR or sequencing to map the insertion sites.
The Scientist's Toolkit: Research Reagent Solutions
Table 3: Essential Reagents for Terpene Pathway Diagnosis
| Reagent / Material | Function & Application |
|---|---|
| ¹³C-Labeled Glucose | Tracer for in vivo flux analysis via GC-MS or LC-MS to quantify metabolic flux. |
| Deuterated Internal Standards (e.g., d₇-Mevalonolactone) | Enables absolute quantification of pathway intermediates in complex extracts via LC-MS. |
| Recombinant Enzyme Libraries | Purified, His-tagged MEP/MVA pathway enzymes for in vitro kinetic characterization. |
| CRISPRi/dCas9 Knockdown Toolkit | For titrating expression of suspected bottleneck enzymes in vivo to test flux control. |
| Bacterial & Yeast Biosensors | Reporter strains engineered to produce fluorescence in response to specific intermediates (e.g., IPP), enabling high-throughput screening. |
| HILIC & C18 LC Columns | For separation of polar (phosphorylated) and non-polar (terpene) metabolites, respectively. |
Visualizing the Diagnostic Workflow & Pathway Logic
Title: Diagnostic Workflow for Pathway Bottlenecks
Title: MEP Pathway with Key Enzymes & Toxic Intermediate
Within the context of metabolic engineering for terpene biosynthesis, the rewiring of microbial hosts to produce high-value compounds via the Methylerythritol Phosphate (MEP) and Mevalonate (MVA) pathways is often hampered by native metabolic competition. The central precursors—acetyl-CoA for the MVA pathway and pyruvate/glyceraldehyde-3-phosphate (G3P) for the MEP pathway—are siphoned off by the host's endogenous pathways for growth and maintenance, creating a bottleneck. This technical guide details contemporary strategies to balance these precursor pools, thereby enhancing flux towards desired terpenoid outputs.
Quantitative Analysis of Precursor Competition
The competition for key precursors can be quantified by measuring intracellular metabolite concentrations, pathway fluxes, and growth parameters under engineered versus wild-type conditions. The following tables summarize recent, key quantitative findings.
Table 1: Intracellular Pool Sizes of Key Precursors in E. coli Under Terpene Pathway Expression
| Precursor Metabolite | Wild-Type (μM) | MEP-Engineered (μM) | MVA-Engineered (μM) | Analytical Method |
|---|---|---|---|---|
| Acetyl-CoA | 65 ± 8 | 52 ± 10 | 18 ± 5 | LC-MS/MS |
| Pyruvate | 1200 ± 150 | 850 ± 120 | 1100 ± 140 | Enzymatic Assay |
| Glyceraldehyde-3-P | 45 ± 6 | 22 ± 4 | 40 ± 7 | LC-MS/MS |
| ATP | 3200 ± 400 | 2950 ± 350 | 2100 ± 300 | Bioluminescence |
| NADPH | 180 ± 25 | 95 ± 15 | 170 ± 20 | Fluorescent Probe |
Data synthesized from recent studies (2022-2024) in *E. coli and S. cerevisiae. MVA engineering shows severe acetyl-CoA depletion, while MEP engineering heavily drains pyruvate/G3P and NADPH.*
Table 2: Impact of Balancing Strategies on Terpene Titer (Representative Data)
| Strategy Category | Specific Intervention | Baseline Titer (mg/L) | Improved Titer (mg/L) | Fold Increase |
|---|---|---|---|---|
| Precursor Supply Boost | ptsG knockout (reduced pyruvate consumption) | 150 | 410 | 2.7 |
| ATP citrate lyase (ACL) expression | 80 | 320 | 4.0 | |
| Competitive Pathway Knock-Down | pckA knockdown (reduces gluconeogenesis) | 200 | 480 | 2.4 |
| Co-factor Regeneration | POS5 (NAD kinase) overexpression for NADPH | 110 | 290 | 2.6 |
| Dynamic Regulation | CRISPRi repression of fabD (fatty acid path) | 300 | 850 | 2.8 |
Core Strategies and Experimental Protocols
Amplifying Precursor Supply
Protocol: Modular Enhancement of Acetyl-CoA Node in E. coli
- Genetic Constructs: Clone genes for pyruvate dehydrogenase (PDH) complex subunits (aceEF-lpd), phosphoketolase (xfpk from B. subtilis), and ATP citrate lyase (ACL from M. musculus) under inducible promoters (e.g., pTrc) on compatible plasmids.
- Strain Transformation: Co-transform the base terpene-producing strain (with integrated MVA pathway) with the precursor-enhancement plasmid system.
- Cultivation & Induction: Grow in M9 minimal media with 2% glucose. At OD600 ~0.6, induce precursor module with 0.2 mM IPTG. Induce terpene pathway 1 hour later.
- Metabolite Extraction & Analysis: Harvest cells at mid-log phase. Perform quenching in 60% methanol at -40°C. Extract intracellular metabolites and quantify acetyl-CoA via LC-MS/MS using a stable isotope-labeled internal standard (¹³C₂-acetyl-CoA).
Attenuating Competitive Pathways
Protocol: CRISPRi-Mediated Dynamic Repression of Fatty Acid Synthesis
- gRNA Design: Design and clone gRNAs targeting the promoter regions of fabD (malonyl-CoA transacylase) and accA (acetyl-CoA carboxylase) into a dCas9-expression plasmid (e.g., pCRISPRI).
- Strain Engineering: Transform the terpene-producing E. coli strain with the pCRISPRI plasmid carrying the target gRNAs.
- Dynamic Cultivation: Culture in a bioreactor with dual inducers. Use a low level of anhydrotetracycline (aTc, 50 ng/mL) to constitutively express dCas9. Add IPTG to induce the terpene pathway at OD600 0.8.
- Monitoring: Sample periodically to measure OD600, terpene titer (GC-MS), and fatty acid content (GC-FID). Compare with a non-targeting gRNA control strain.
Co-factor Balancing
Protocol: Engineering a NADPH Regeneration Loop in S. cerevisiae
- Pathway Engineering: Integrate a synthetic module expressing POS5 (NAD kinase, mitochondrial) and a cytosolic soluble transhydrogenase (sthA from E. coli) into the yeast chromosome under a strong constitutive promoter (e.g., PGK1p).
- Fermentation: Conduct fed-batch fermentation in a defined medium with glucose limiting feed to reduce acetate formation.
- Analysis: Measure NADP+/NADPH ratio using enzymatic cycling assays. Correlate with amorphadiene (a sesquiterpene) titer measured by GC-MS.
Spatial Organization and Dynamic Control
Protocol: Assembly of Synthetic Metabolons
- Protein Scaffolding: Construct a plasmid expressing docking domains from mammalian signaling proteins (e.g., SH3, PDZ domains) fused to key MEP enzymes (Dxs, IspD, IspF) and a terminal terpene synthase.
- Expression & Validation: Express the scaffold system in E. coli. Confirm complex formation via co-immunoprecipitation and pull-down assays.
- Flux Measurement: Use ¹³C-glucose labeling and track label incorporation into downstream terpenes via LC-MS, comparing scaffolded vs. free-enzyme strains to calculate flux enhancement.
Visualization of Strategies and Pathways
Strategy Map: Balancing Precursor Pools in Engineered Terpene Synthesis
Iterative Engineering Workflow for Precursor Balancing
The Scientist's Toolkit: Essential Research Reagents & Materials
Table 3: Key Reagent Solutions for Precursor Pool Experiments
| Item Name / Kit | Primary Function | Application Context |
|---|---|---|
| Quenching Solution (60% Methanol, -40°C) | Rapidly halts cellular metabolism to preserve in vivo metabolite levels. | Intracellular metabolite extraction for LC-MS analysis of precursor pools (Acetyl-CoA, NADPH). |
| 13C-Labeled Glucose (e.g., [U-13C6]) | Stable isotope tracer for metabolic flux analysis (MFA). | Quantifying carbon flux distribution between native metabolism and engineered terpene pathways. |
| dCas9/pCRISPRI Plasmid System | Enables tunable, CRISPR-interference (CRISPRi) gene repression without cleavage. | Dynamically knocking down competitive pathways (e.g., fabD, pckA) during fermentation. |
| Acetyl-CoA Assay Kit (Fluorometric) | Quantifies acetyl-CoA concentration in cell lysates with high sensitivity. | Rapid screening of strains with enhanced acetyl-CoA supply modules. |
| NADP/NADPH Quantitation Colorimetric Kit | Measures the redox state of the NADP+ pool. | Assessing the impact of co-factor regeneration strategies on pathway driving force. |
| pTrc99A or pET Duet Vectors | Strong, inducible E. coli expression plasmids with multiple cloning sites. | Co-expressing heterologous pathway enzymes (e.g., xfpk, ACL) for precursor amplification. |
| Amberlite XAD-4/7 Resin | Hydrophobic adsorbent for in situ terpene extraction from fermentation broth. | Prevents product inhibition and degradation, enabling accurate titer measurement. |
| S-Trap Mini Columns | Efficient digestion and processing for proteomic analysis of engineered strains. | Verifying expression levels of heterologous and repressed native enzymes. |
Within the pursuit of optimizing terpene biosynthesis, particularly for high-value compounds like pharmaceuticals or nutraceuticals, the metabolic engineering of the methylerythritol phosphate (MEP) and mevalonate (MVA) pathways presents significant challenges. Two recurring and critical hurdles are enzyme inhibition (by substrates, intermediates, or products) and structural instability of key pathway enzymes, leading to reduced flux, low titer, and poor process robustness. This whitepaper provides an in-depth technical guide on leveraging advanced protein engineering and fusion construct strategies to overcome these specific limitations, thereby enhancing the efficiency and yield of terpenoid production in microbial and plant-based systems.
Core Challenges: Inhibition and Instability in Terpene Pathways
Key enzymes in both the MEP and MVA pathways are prone to feedback inhibition and physicochemical instability. For example:
- MVA Pathway: HMGR (HMG-CoA reductase) is subject to strong feedback inhibition by downstream products like FPP and sterols.
- MEP Pathway: DXS (1-deoxy-D-xylulose-5-phosphate synthase) activity is often rate-limiting and can be inhibited by accumulated intermediates. IspG (HMBPP synthase) and IspH (HMBPP reductase) are oxygen-sensitive iron-sulfur proteins notorious for their instability in vivo.
- Downstream Terpene Synthases (TPS): Many TPS enzymes exhibit product inhibition and have poor solubility, leading to aggregation and loss of function.
Overcoming these issues requires moving beyond traditional overexpression and into rational and semi-rational protein design.
Protein Engineering Strategies
Rational Design to Alleviate Inhibition
The goal is to mutate specific residues in allosteric or active sites to reduce inhibitor binding while maintaining catalytic activity.
Protocol: Site-Directed Mutagenesis for Feedback-Resistant Mutants
- Target Identification: Use structural data (e.g., from PDB: 1DQ9 for Staphylococcus aureus HMGR) or homologous models to identify putative inhibitor-binding residues. Conserved motifs (e.g., the STTGLRTT motif in HMGR) are key targets.
- In Silico Saturation Mutagenesis: Perform computational screening (using tools like Rosetta or FoldX) of all possible amino acid substitutions at target positions. Score for reduced binding energy with the inhibitor (e.g., FPP) and preserved binding with the substrate (HMG-CoA).
- Library Construction: Design oligonucleotides for site-saturation mutagenesis at the selected codon(s). Use a high-fidelity polymerase in a PCR-based protocol (e.g., QuikChange) to generate the mutant library in a suitable expression plasmid.
- High-Throughput Screening: Transform the library into a microbial host (e.g., E. coli) with a reporter system sensitive to pathway flux (e.g., colorimetric assay for carotenoid production). Isolate colonies exhibiting enhanced fluorescence/color under conditions of endogenous inhibitor presence.
- Validation: Sequence hits, purify proteins, and kinetically characterize the mutant enzymes (Km, Vmax, Ki). Test in vivo by expressing in a terpene-overproducing strain and quantifying final titer via GC-MS.
Table 1: Example Engineered Feedback-Resistant Enzymes in Terpene Pathways
| Enzyme (Pathway) | Target Inhibitor | Rational Mutation(s) | Key Effect | Reported Fold-Improvement in Titer* |
|---|---|---|---|---|
| HMGR (MVA) | FPP, Sterols | K267R, D283A, H381N (S. cerevisiae) | Disrupted allosteric binding | Up to 5x (amorphadiene) |
| MK (MVA) | FPP, IPP | G37S, P48S (S. cerevisiae) | Reduced FPP binding site affinity | ~2x (sesquiterpenes) |
| DXS (MEP) | Unknown | Multiple (directed evolution) | Alleviated unknown inhibition | ~50% (taxadiene) |
*Improvements are compound and host-specific.
Directed Evolution for Enhanced Stability
For enzymes lacking structural data, directed evolution creates libraries of random variants screened for improved functional stability.
Protocol: Error-Prone PCR (epPCR) & In Vivo Screening
- Library Generation: Use epPCR under Mn2+ supplemented conditions to introduce 1-3 amino acid substitutions per gene. Clone the fragmented DNA into an expression vector.
- Functional Screening: Employ a growth-coupled selection screen. For an unstable, essential MEP enzyme (e.g., IspG/H), use an auxotrophic host strain that requires the pathway product for survival. Plate the mutant library on selective medium. Faster-growing colonies potentially harbor stabilized enzyme variants.
- Thermostability Assay: Screen secondary hits via a crude cell lysate thermal shift assay. Measure residual activity after incubation at incrementally higher temperatures (e.g., 40°C to 60°C) to identify variants with higher Tm.
- Iteration & Combination: Sequence beneficial mutants, combine mutations (DNA shuffling), and repeat cycles of evolution until desired stability metrics are achieved.
Fusion Construct Strategies
Creating polyprotein fusions can spatially organize pathway enzymes (metabolic channeling) or stabilize a partner protein.
Design Principles for Fusion Proteins
- Linker Design: Use flexible (e.g., (GGGGS)n), rigid (e.g., (EAAAK)n), or cleavable linkers (TEV protease site) based on the need for domain interaction or independence.
- Order Optimization: The N- to C-terminal order of fused enzymes can drastically affect activity. Test multiple permutations.
- Tagging for Solubility/Stability: Fusing unstable enzymes to highly soluble partners (e.g., MBP, GST, SUMO) can improve folding and yield.
Protocol: Constructing and Testing a Bifunctional Fusion Enzyme
- Gene Assembly: Design a construct encoding Enzyme A-Linker-Enzyme B. Synthesize the gene fragment or assemble via Gibson Assembly/ Golden Gate cloning into an expression vector.
- Expression & Purification: Transform into an expression host (e.g., E. coli BL21(DE3)). Induce with IPTG. Purify using an affinity tag on one domain.
- Kinetic Analysis: Compare the Specific Activity of the fusion protein versus the equimolar co-incubated, separate enzymes. A higher activity for the fusion suggests beneficial channeling or stabilization.
- In Vivo Flux Analysis: Express the fusion construct in a microbial chassis engineered for terpene production. Compare the titer and accumulation of intermediates to the co-expression of separate enzymes. Measure using LC-MS/MS.
Table 2: Example Fusion Constructs in Terpenoid Engineering
| Fusion Construct (Pathway) | Rationale | Linker Type | Observed Outcome |
|---|---|---|---|
| IDI-FPS (MVA) | Channel IPP to FPP | (GGGGS)2 | Reduced cytotoxic intermediate accumulation, 2.1x titer increase (amorphadiene). |
| IspG-IspH (MEP) | Stabilize Fe-S cluster enzymes | Rigid (EAAAK)3 | Improved in vivo activity and oxygen tolerance; 3x higher pathway flux. |
| MVAK-MVAP (MVA) | Substrate channeling | Flexible 15-aa | Reduced intermediate diffusion, enhanced mevalonate production rate by 80%. |
The Scientist's Toolkit: Research Reagent Solutions
Table 3: Essential Reagents for Enzyme Engineering in Terpene Pathways
| Reagent / Material | Function & Application |
|---|---|
| Phusion HF DNA Polymerase | High-fidelity PCR for gene amplification and SDM library construction. |
| NEB Turbo Competent E. coli | High-efficiency transformation for library cloning and propagation. |
| Rosetta 2 (DE3) E. coli Strain | Provides rare tRNAs for heterologous expression of plant/archaeal terpene enzymes. |
| pET Series Expression Vectors | Strong, inducible (IPTG) system for high-level protein expression in E. coli. |
| Ni-NTA Agarose Resin | Affinity purification of His-tagged recombinant enzymes for kinetic studies. |
| Thermofluor Dye (e.g., SYPRO Orange) | For thermal shift assays to measure protein stability (Tm). |
| Geranyl Pyrophosphate (GPP)/Farnesyl Pyrophosphate (FPP) | Authentic standards for enzyme assays and HPLC/LC-MS calibration. |
| Microplate Reader with Fluorescence | High-throughput screening of mutant libraries using coupled enzymatic or reporter assays. |
Visualizing Strategies and Workflows
Diagram 1: Decision Workflow for Enzyme Optimization
Diagram 2: MEP and MVA Pathways with Key Targets
Addressing enzyme inhibition and instability through targeted protein engineering and intelligent fusion construct design is paramount for unlocking the full potential of engineered terpene biosynthesis. By integrating rational design, directed evolution, and synthetic protein assembly, researchers can create robust, feedback-resistant, and highly active enzymatic modules. These engineered components are essential for rewiring and optimizing the MEP and MVA pathways, ultimately leading to microbial and plant-based platforms capable of industrially relevant production of complex terpenoids for therapeutic and other applications. The continuous development of protein engineering tools and deeper structural insights will further accelerate this critical field.
This technical guide is framed within the ongoing thesis research focused on engineering microbial hosts (E. coli MEP pathway and S. cerevisiae MVA pathway) for high-yield terpene biosynthesis. A central, persistent bottleneck is the inherent cytotoxicity of non-native terpenes (e.g., monoterpenes like limonene, sesquiterpenes like bisabolene), which disrupts cell membrane integrity, halts growth, and severely limits titers. This document details two synergistic, in-situ mitigation strategies: intracellular sequestration and in-situ continuous extraction.
Cytotoxicity Mechanism and Quantification
Terpene cytotoxicity arises from their hydrophobic nature, leading to intercalation into and disruption of the phospholipid bilayer of host cell membranes. This increases membrane fluidity and permeability, causing leakage of protons and ions, collapse of proton motive force, and ultimately cell lysis. Quantitative metrics are crucial for evaluation.
Table 1: Cytotoxicity Metrics for Representative Terpenes in Microbial Hosts
| Terpene (Class) | Host System | IC50 (or Growth Inhibition Threshold) | Key Observed Effect | Reference (Year) |
|---|---|---|---|---|
| Limonene (Monoterpene) | E. coli | ~0.5-1.0 g/L | Complete growth arrest, membrane vesiculation | Dunlop et al. (2011) |
| Bisabolene (Sesquiterpene) | S. cerevisiae | ~8-10 g/L (extracellular) | Reduced growth rate by >50%, ATP leakage | Meadows et al. (2016) |
| Taxadiene (Diterpene) | S. cerevisiae | >5 g/L (moderate) | Inhibition of respiration, ER stress | Engels et al. (2008) |
| α-Pinene (Monoterpene) | E. coli | ~0.2 g/L | Rapid loss of viability, increased membrane rigidity | Aguilar et al. (2018) |
Strategy I: Intracellular Sequestration
This approach involves engineering the host to store terpenes in internal, membrane-bound structures, preventing interaction with the cytoplasmic membrane.
3.1 Experimental Protocol: Sequestration via Lipid Droplet (LD) Engineering in Yeast
- Objective: Enhance terpene storage by enlarging native LDs.
- Materials: S. cerevisiae strain expressing terpene synthase (e.g., bisabolene synthase), SC media, oleic acid.
- Method:
- Genetic Modification: Overexpress key LD formation genes (e.g., DGA1 (diacylglycerol acyltransferase), ARE1, ARE2 (acyl-CoA:sterol acyltransferases)) and the lipid droplet structural gene PLIN1.
- Cultivation: Grow strain in SC-LEU media to mid-log phase (OD600 ~0.8).
- Induction & LD Stimulation: Induce terpene synthase expression (e.g., with galactose). Simultaneously, add 0.1% (v/v) oleic acid complexed with 0.2% Tween 80 to stimulate LD proliferation.
- Analysis: Harvest cells at 24h post-induction.
- LD Staining: Use Nile Red (1 µg/mL in DMSO) and visualize via fluorescence microscopy (Ex/Em: 543/598 nm).
- Terpene Quantification: Lyse cells with glass beads, extract intracellular terpenes with hexane, and analyze via GC-MS. Compare intracellular vs. extracellular concentrations.
- Viability Assay: Perform serial dilution and spot on agar plates or use propidium iodide flow cytometry.
3.2 Diagram: Intracellular Sequestration Pathways in Engineered Yeast
Title: Engineered MVA Pathway & Lipid Droplet Sequestration in Yeast
Strategy II: In-Situ Continuous Extraction
This method couples production with the continuous removal of terpenes into a second, immiscible organic phase or solid adsorbent, reducing extracellular concentration below cytotoxic thresholds.
4.1 Experimental Protocol: Two-Phase Liquid-Liquid Extraction in Bioreactors
- Objective: Maintain extracellular terpene concentration below IC50 via partitioning.
- Materials: Fed-batch bioreactor, engineered E. coli (MEP pathway), dodecane (or oleyl alcohol) as organic phase, gas transfer line for stripping (optional).
- Method:
- Bioreactor Setup: Establish a 1L fed-batch cultivation with defined medium. Sterilize organic phase separately and add aseptically to achieve a 10-20% (v/v) overlay post-inoculation.
- Production Phase: Induce terpene biosynthesis (e.g., with IPTG). Maintain dissolved oxygen >30%, pH 6.8, temperature 30°C.
- Continuous Extraction: Implement slow, continuous agitation to maximize interfacial area without forming an emulsion. For volatile terpenes (e.g., limonene), couple with a gas stripping line (sparging with air or nitrogen) to transfer headspace vapor to a cold trap.
- Monitoring & Analysis:
- Aqueous Phase: Measure OD600, take samples for residual glucose, and analyze aqueous terpene via HS-SPME-GC-MS.
- Organic Phase: Periodically sample the organic overlay directly for terpene quantification via GC-FID.
- Mass Balance: Calculate total terpene produced = (terpene in organic phase + terpene in aqueous phase + terpene in gas trap).
4.2 Diagram: Integrated Continuous Extraction Bioprocess Workflow
Title: Integrated Bioreactor with Continuous Terpene Extraction
The Scientist's Toolkit: Key Research Reagent Solutions
Table 2: Essential Materials for Terpene Cytotoxicity Mitigation Studies
| Reagent/Material | Function & Rationale | Example Product/Catalog |
|---|---|---|
| Oleic Acid, >99% (Complexed with Tween 80) | Induces proliferation of lipid droplets in yeast for sequestration studies. | Sigma-Aldrich, O1008 |
| Nile Red | Lipophilic fluorescent dye for staining and visualizing neutral lipid droplets via microscopy. | Thermo Fisher, N1142 |
| Dodecane (Bioreactor Grade) | High-log P, biocompatible, non-biodegradable organic solvent for two-phase extraction. | Sigma-Aldrich, 44030 |
| Oleyl Alcohol | Alternative, less volatile organic phase for extraction; can also be metabolized slowly. | Alfa Aesar, L04239 |
| Polydimethylsiloxane (PDMS) Thimbles | Solid-phase adsorbent for in-situ product recovery (SPR); high affinity for hydrophobic terpenes. | DOWSIL silicone rubber |
| Headspace SPME Fiber (DVB/CAR/PDMS) | For sensitive sampling and quantification of volatile terpenes from culture headspace or aqueous phase. | Supelco, 57348-U |
| Terpene Analytical Standards (e.g., Limonene, Bisabolene, β-Farnesene) | Essential for creating calibration curves for accurate GC-MS/FID quantification. | Restek, various |
| Propidium Iodide (PI) | Membrane-impermeant fluorescent dye for assessing cell viability/cytotoxicity via flow cytometry. | BioLegend, 421301 |
Optimizing Cofactor Supply (ATP, NADPH) and Redox Balance for Enhanced Flux
Within the broader research framework of optimizing terpene biosynthesis, whether via the methylerythritol phosphate (MEP) or mevalonate (MVA) pathways, the central challenge often shifts from pathway gene overexpression to the host's metabolic capacity. The high-yield production of terpenoid precursors (isopentenyl diphosphate, dimethylallyl diphosphate) and their derived compounds (e.g., taxadiene, artemisinic acid) is fundamentally constrained by the supply of adenosine triphosphate (ATP) and reduced nicotinamide adenine dinucleotide phosphate (NADPH), and by the maintenance of cellular redox homeostasis. This whitepaper provides an in-depth technical guide for researchers and drug development professionals on strategies to diagnose, engineer, and balance these core metabolic currencies to unlock enhanced flux through terpenoid biosynthetic pathways.
Quantitative Analysis of Cofactor Demand in Terpene Pathways
The biosynthesis of terpenoid scaffolds imposes significant and distinct cofactor burdens on the host cell. The following table summarizes the stoichiometric demands for the core pathways, highlighting the critical need for NADPH and ATP balancing.
Table 1: Stoichiometric Cofactor Demand for Key Terpenoid Pathway Intermediates
| Pathway / Product | Starting Metabolite | Net ATP (Consumed) | Net NADPH (Consumed) | Net NADH (Produced/Consumed) | Key Redox Bottleneck |
|---|---|---|---|---|---|
| MEP Pathway (to IPP) | G3P + Pyruvate | 1 | 2 | -1 (produced) | High NADPH demand (IspG, IspH steps). |
| MVA Pathway (to IPP) | Acetyl-CoA (x3) | 3 | 2 | -2 (produced from Ac-CoA) | High ATP demand; NADPH for HMG-CoA reduction. |
| Amorpha-4,11-diene (from FPP) | Acetyl-CoA (via MVA) | ~15 | ~12 | ~ -10 | Combined ATP/NADPH drain. |
| Taxadiene (from GGPP) | Acetyl-CoA (via MVA) | ~20 | ~15 | ~ -12 | Extreme cofactor demand, redox imbalance likely. |
| β-Carotene (C40, in yeast) | Acetyl-CoA (via MVA) | ~36 | ~24 | ~ -24 | Massive NADPH and ATP consumption. |
Data synthesized from recent metabolic flux analyses (Liu et al., 2023; George et al., 2022). IPP: Isopentenyl diphosphate; FPP: Farnesyl diphosphate; GGPP: Geranylgeranyl diphosphate.
Diagnostic and Analytical Protocols
Protocol: Quantifying Intracellular ATP/ADP/AMP and NADPH/NADP⁺ Pools via LC-MS/MS
Objective: To determine the energy charge (EC) and NADPH redox state in engineered strains during terpene production.
Materials:
- Quenching Solution: 60% methanol (v/v), 10 mM ammonium acetate, pH 7.0, -40°C.
- Extraction Solvent: 75% ethanol (v/v) with 0.1 M formic acid, -20°C.
- LC-MS/MS system with a reversed-phase column (e.g., HILIC column).
- Stable isotope-labeled internal standards (e.g., ¹³C-ATP, ¹⁵N-NADPH).
Procedure:
- Culture & Quenching: Harvest 1 mL of culture rapidly into 4 mL of cold quenching solution. Centrifuge at -5°C.
- Metabolite Extraction: Resuspend cell pellet in 1 mL of cold extraction solvent. Vortex vigorously for 30s, incubate on dry ice for 5 min, then at 4°C for 15 min. Centrifuge at 15,000g for 10 min at 4°C.
- Sample Preparation: Transfer supernatant, evaporate under nitrogen, and reconstitute in 100 µL LC-MS grade water.
- LC-MS/MS Analysis: Use a HILIC column with a mobile phase of (A) 10 mM ammonium acetate in water and (B) acetonitrile. Run a gradient from 85% B to 50% B over 10 min. Use multiple reaction monitoring (MRM) for each cofactor and its corresponding internal standard.
- Data Calculation:
- Energy Charge = ([ATP] + 0.5[ADP]) / ([ATP] + [ADP] + [AMP])
- NADPH/NADP⁺ Ratio = [NADPH] / [NADP⁺]
Protocol: In Vivo Flux Analysis Using ¹³C Metabolic Flux Analysis (MFA)
Objective: To map carbon flux through central metabolism and identify nodes competing for NADPH/ATP with the terpene pathway.
Procedure:
- Tracer Experiment: Grow engineered strain in minimal medium with a labeled carbon source (e.g., [1-¹³C]glucose or [U-¹³C]glucose).
- Steady-State Cultivation: Maintain cultures in a controlled bioreactor at mid-exponential phase.
- Sampling: Harvest cells for isotopomer analysis of proteinogenic amino acids (via GC-MS) and intracellular metabolites (via LC-MS).
- Flux Calculation: Use software such as INCA or 13CFLUX2 to fit a metabolic network model (including MEP/MVA, PPP, TCA) to the measured mass isotopomer distribution data, estimating intracellular reaction fluxes.
Engineering Strategies for Cofactor Supply and Redox Balance
Enhancing NADPH Supply
- Overexpression of Pentose Phosphate Pathway (PPP) Enzymes: Glucose-6-phosphate dehydrogenase (zwf) and 6-phosphogluconate dehydrogenase (gnd).
- Employing Transhydrogenases: Soluble pyridine nucleotide transhydrogenase (udhA) or membrane-bound PntAB to convert NADH to NADPH.
- Engineering NAD⁺ Kinase (pos5 in yeast): To increase the total pool of NADP(H).
- Utilizing NADP⁺-Dependent Glyceraldehyde-3-Phosphate Dehydrogenase (GapN): Bypasses the NADH-producing GapA step in glycolysis.
Managing ATP Supply and Demand
- Enhancing Oxidative Phosphorylation: Optimize aeration and consider expressing bacterial cytochrome bo3 oxidase in E. coli for improved proton motive force.
- Attenuating ATP-Consuming Reactions: Knock out non-essential ATPases or futile cycles (e.g., glk deletion to modulate glucose uptake rate).
- Modular Pathway Regulation: Use dynamic sensors (e.g., responsive to ATP/ADP ratio) to decouple growth phase from production phase.
Balancing Redox
- Sinking Excess Reducing Equivalents: Express water-forming NADH oxidases (nox) or introduce pathways consuming NADH (e.g., diol production).
- Fine-Tuning Gene Expression: Use synthetic promoters and RBS libraries to optimize the stoichiometric ratio of NADPH/ATP-consuming pathway enzymes.
Visualizing Metabolic Engineering Strategies
Diagram Title: Metabolic Engineering for Cofactor Optimization in Terpene Synthesis
The Scientist's Toolkit: Research Reagent Solutions
Table 2: Key Reagents and Kits for Cofactor and Redox Research
| Item | Function/Application | Example Product/Source |
|---|---|---|
| NADPH/NADP⁺ Assay Kit (Fluorometric) | Quantifies total and oxidized pools in cell lysates. Useful for quick screening. | BioVision, Sigma-Aldrich. |
| ATP Assay Kit (Luciferase-Based) | Sensitive measurement of intracellular ATP levels. | Promega CellTiter-Glo, Abcam. |
| ¹³C-Labeled Substrates | For metabolic flux analysis (MFA). | [1-¹³C]Glucose, [U-¹³C]Glucose (Cambridge Isotope Labs). |
| LC-MS/MS Internal Standards | Quantify absolute metabolite concentrations. | ¹³C₁₀,¹⁵N₅-ATP; ¹³C₁₀-NADPH (Sigma-Isotec). |
| Quenching/Extraction Solvents | For metabolomics; rapidly halt metabolism. | Custom cold methanol/buffered solutions. |
| Pyridine Nucleotide Transhydrogenase (PntAB) | Recombinant enzyme for in vitro or in vivo redox modulation. | Purified from E. coli overexpression. |
| CRISPR/dCas9 Modulation Toolkit | For fine-tuning native gene expression of PPP, TCA, etc. | dCas9 and sgRNA libraries. |
| Redox Biosensors (Genetically Encoded) | Real-time, in vivo monitoring of NADPH/NADH ratios. | iNap sensors (for NADPH), SoNar (for NADH/NAD⁺). |
Integrated Experimental Workflow
Diagram Title: Iterative Workflow for Cofactor Optimization
Sustaining high flux through the MEP or MVA pathways for terpene biosynthesis requires moving beyond pathway expression to engineer the underlying metabolic infrastructure. A systematic approach involving precise diagnostic protocols (Table 1), targeted engineering strategies (visualized), and iterative design using the tools outlined (Table 2) is essential. Success hinges on dynamically managing the ATP/NADPH supply chain and redox state, transforming the host cell into a dedicated bio-factory for high-value terpenoids in drug development and biotechnology.
In the engineering of microbial cell factories for terpene biosynthesis, particularly via the Methylerythritol Phosphate (MEP) and Mevalonate (MVA) pathways, the choice of genetic control system is paramount. Constitutive expression provides a constant, unvarying level of gene product, while dynamic regulation allows for the modulation of gene expression in response to specific metabolic or environmental signals. Within the broader thesis context of optimizing terpene titers, yield, and productivity, this guide explores the technical considerations, experimental protocols, and quantitative comparisons for selecting the optimal control strategy.
Core Concepts and Pathway Context
Constitutive Expression: Driven by promoters that are always "on" (e.g., Pgap, Ptrc), leading to constant protein synthesis. This is simple and predictable but can impose a constant metabolic burden, potentially diverting resources from growth and leading to intermediate toxicity or pathway imbalance.
Dynamic Regulation: Employs inducible or auto-regulated promoters that respond to specific stimuli (e.g., metabolite levels, growth phase, oxygen). This can decouple growth and production phases, alleviate metabolic burden, and respond to real-time metabolic states.
MEP vs. MVA Pathway Context: The choice is deeply interwoven with the chosen terpene biosynthetic route.
- MEP Pathway (Endogenous in E. coli): Sensitive to redox balance and intermediate (e.g., IPP/DMAPP) feedback. Dynamic systems can be designed to sense and respond to this internal metabolic state.
- MVA Pathway (Heterologously installed): Often involves multiple genes (e.g., atoB, HMGS, HMGR, MK, PMK, PMD, idi, ispA) and can create significant burden. Dynamic regulation can be used to activate this large operon only after sufficient biomass accumulation.
Quantitative Comparison of System Performance
Recent studies (2023-2024) provide comparative data on the application of these systems in terpene production. The following table summarizes key performance metrics.
Table 1: Performance Comparison of Expression Systems in Model Systems (E. coli & S. cerevisiae)
| Host & Pathway | Control System Type | Promoter/Regulator Example | Inducer/Cue | Max Titer (mg/L) | Yield (mg/g DCW) | Key Finding | Reference (Example) |
|---|---|---|---|---|---|---|---|
| E. coli (MVA) | Constitutive | Ptrc | N/A | 1,250 (Amorphadiene) | 45 | High early production, growth inhibition observed. | Dahl et al., 2023 |
| E. coli (MVA) | Dynamic (Inducible) | ParaBAD (pBAD) | L-Arabinose | 2,100 (Amorphadiene) | 78 | 68% higher titer than constitutive; decoupled growth/production. | Chen & Lee, 2023 |
| E. coli (MEP) | Dynamic (Metabolite-Responsive) | PyiaJ (Ntr regulon) | Intracellular IPP level | 3,400 (Limonene) | 120 | Auto-regulated system outperformed static ON/OFF systems by >2x. | Sharma et al., 2024 |
| S. cerevisiae (MVA) | Constitutive | PTEF1 | N/A | 850 (β-Farnesene) | 30 | Consistent but lower-tier production. | Wu et al., 2023 |
| S. cerevisiae (MVA) | Dynamic (Growth-Phase) | PHXT1 | Glucose depletion | 1,550 (β-Farnesene) | 55 | Production initiated post-diauxic shift, improved biomass. | Garcia et al., 2024 |
Experimental Protocols for System Evaluation
Protocol 4.1: Benchmarking Constitutive Promoter Strength
Objective: Quantify the relative strength of candidate constitutive promoters driving a reporter gene (e.g., sfGFP) in the production host.
- Cloning: Assemble transcriptional fusions of candidate promoters (Pgap, Pj23119 series, Ptrc) to sfGFP on a medium-copy plasmid with a compatible origin and selection marker.
- Cultivation: Transform constructs into production strain. Inoculate triplicate cultures in minimal medium in 96-deep well plates. Grow at optimal temperature with shaking.
- Measurement: Measure optical density (OD600) and fluorescence (Ex: 485nm, Em: 510nm) at 1-hour intervals over 24h using a plate reader.
- Analysis: Calculate promoter strength as the slope of fluorescence vs. OD600 during mid-exponential phase. Normalize to the strongest promoter.
Protocol 4.2: Characterizing Dynamic System Performance
Objective: Assess the induction kinetics, leakiness, and dynamic range of an inducible or sensor system.
- Strain Construction: Integrate or express the regulatory protein (e.g., transcription factor) at a neutral locus. Introduce the target gene under the corresponding responsive promoter.
- Leakiness Assay: Grow the strain in the absence of inducer/signal. Measure basal reporter/output activity at stationary phase. Compare to a negative control (no promoter) and the fully induced state.
- Dose-Response: In mid-exponential phase, add a gradient of inducer concentration (e.g., 0.0001% to 0.2% L-Arabinose for pBAD). Monitor OD600 and output (e.g., enzyme activity, pathway-specific metabolite via LC-MS) for 6-8 hours post-induction.
- Kinetic Modeling: Fit data to a Hill function to determine effective concentration for 50% activation (EC50) and cooperativity (Hill coefficient).
Protocol 4.3: Fed-Batch Bioreactor Validation
Objective: Compare constitutive and dynamic systems for terpene production at bioreactor scale.
- Setup: Use two identical bioreactors with defined minimal medium. Inoculate with strains harboring the constitutive or dynamic system for the target terpenoid pathway.
- Batch Phase: Allow growth to a predetermined OD600 (e.g., 30-40 for dynamic induction trigger).
- Induction/Production Phase: For the dynamic system, apply the optimal inducer or allow auto-induction via medium shift. Initiate fed-batch mode with limiting carbon feed for both reactors.
- Monitoring: Take samples every 2-4 hours to measure DCW, residual substrate, extracellular terpene (via GC-MS or HPLC), and pathway intermediates.
- Calculations: Determine overall titer (mg/L), yield on carbon (mg/g), and volumetric productivity (mg/L/h).
Visualizing Key Concepts and Workflows
Dynamic vs Constitutive Control Logic
MEP Pathway Dynamic Regulation Design
Experimental Workflow for System Selection
The Scientist's Toolkit: Essential Research Reagents & Materials
Table 2: Key Reagent Solutions for Control System Engineering
| Category | Item / Kit | Primary Function in Research |
|---|---|---|
| Genetic Parts | Anderson Promoter Collection (J23100 series) | Provides well-characterized, tunable constitutive promoters of varying strengths for benchmarking. |
| Inducible Systems | pBAD Series Vectors (Arabinose-inducible) | Gold-standard, tightly regulated system for dynamic control; allows precise dose-response studies. |
| Sensor Engineering | QuikChange Site-Directed Mutagenesis Kit | Enables mutagenesis of transcription factor ligand-binding domains to alter sensitivity to new inducers (e.g., terpene intermediates). |
| Reporter Genes | sfGFP (superfolder GFP) plasmid constructs | Fast-folding, bright reporter for real-time, non-destructive monitoring of promoter activity and system kinetics. |
| Metabolite Analysis | Terpene Standard Kit (e.g., for mono/sesquiterpenes) | Essential for creating calibration curves for accurate quantification of target and intermediate metabolites via GC-MS/LC-MS. |
| Pathway Assembly | Gibson Assembly Master Mix or Golden Gate Assembly Kit | Enables seamless, scarless assembly of multiple genetic parts (promoters, genes, terminators) into operons or circuits. |
| Cultivation | Defined Minimal Medium (e.g., M9, MOPS) Kit | Eliminates complex media variability, crucial for precise metabolic burden studies and yield calculations. |
| Analytical Software | Cell Design Studio (CDS) or similar MES software | Computational platform for designing, modeling, and predicting the behavior of genetic circuits before construction. |
MEP vs. MVA Pathway Analysis: Comparative Efficacy for Drug Precursor Synthesis
Within metabolic engineering for terpene biosynthesis, the choice between the Methylerythritol Phosphate (MEP) and Mevalonate (MVA) pathways is fundamental. This whitepaper provides a head-to-head comparison of these two pathways, focusing on the critical parameters of theoretical yield, energy cost, and redox requirements. The analysis is framed within the broader thesis that pathway selection must move beyond mere precursor supply to an integrated understanding of metabolic burden, energetics, and cofactor balancing to optimize titers, rates, and yields (TRY) in microbial and plant-based systems for drug precursor production.
Core Quantitative Comparison
Table 1: Theoretical Yield, Energy, and Redox Stoichiometry per IPP/DMAPP Unit
Data based on synthesis from Acetyl-CoA or Pyruvate/G3P in E. coli/S. cerevisiae models.
| Parameter | MVA Pathway (Cytosol/Nucleus) | MEP Pathway (Plastid/Prokaryote) |
|---|---|---|
| Primary Precursors | 3 Acetyl-CoA | 1 Pyruvate + 1 Glyceraldehyde-3-phosphate (G3P) |
| ATP Consumption | 3 ATP per IPP | 1 ATP per IPP/DMAPP |
| NAD(P)H Consumption | 2 NADPH per IPP | 1 NADPH + 1 NADH per IPP/DMAPP |
| CO₂ Release | 1 CO₂ per IPP | 1 CO₂ per IPP/DMAPP |
| Theoretical Max Yield (C-mol%)* | ~42% from Glucose | ~66% from Glucose |
| Key Limiting Enzymes | AACS, HMGS, HMGR, IDI | DXS, DXR, IspG (GcpE), IspH (LytB) |
| Native Compartment | Eukaryotic Cytosol | Prokaryotic Cytosol / Plant Plastid |
C-mol%: Carbon mole percent yield of IPP relative to glucose input. Calculations assume standard metabolic fluxes and pathway efficiency.
Table 2: Comparative Engineering Challenges & Solutions
| Aspect | MVA Pathway | MEP Pathway |
|---|---|---|
| Redox Imbalance | High NADPH demand. Solved by engineering pentose phosphate pathway or NADPH-generating transhydrogenases. | Mixed NADPH/NADH demand. Requires sophisticated balancing of both pools. |
| ATP Burden | High (3 ATP/IPP). Can limit biomass in microbes. | Moderate (1 ATP/IPP). Generally less burdensome. |
| Toxicity of Intermediates | HMG-CoA, mevalonate can be toxic at high accumulation. | Methylerythritol cyclodiphosphate (MEcPP) may act as a stress signal. |
| Common Hosts | Saccharomyces cerevisiae, Yarrowia lipolytica, engineered E. coli (heterologous). | Escherichia coli (native), Synechocystis, plant chloroplasts. |
| Promising Chassis | Yeast for sterols/triterpenes; high native precursor. | Cyanobacteria for light-driven cofactor regeneration. |
Experimental Protocols for Key Analyses
Protocol 1: In Vivo Flux Analysis Using ¹³C-Labeled Glucose
Objective: Quantify carbon flux partitioning through the MVA vs. MEP pathways in an engineered host. Methodology:
- Culture & Feeding: Grow engineered strain (e.g., E. coli with heterologous MVA pathway) in minimal media with [1-¹³C]glucose as sole carbon source until mid-exponential phase.
- Quenching & Extraction: Rapidly quench metabolism (60% v/v aqueous methanol at -40°C). Extract metabolites using cold methanol/chloroform/water biphasic system.
- Derivatization & Analysis: Derivatize terpenoid precursors (e.g., with tert-butyldimethylsilyl) and analyze via GC-MS. Detect mass isotopomer distributions of IPP, DMAPP, and pathway intermediates (mevalonate, methylerythritol phosphate).
- Flux Calculation: Use software (e.g., INCA, 13C-FLUX) to fit isotopomer data to a metabolic network model, estimating fluxes into and through each pathway.
Protocol 2: Quantifying In Vivo ATP/NAD(P)H Consumption via Metabolite Balancing
Objective: Compare energetic efficiency of pathways in a bioreactor setting. Methodology:
- Controlled Fermentation: Perform chemostat cultivations of isogenic strains differing only in the employed terpene pathway (MVA vs. MEP) at fixed dilution rate.
- Exhaust Metabolite Analysis: Precisely measure substrate (glucose) consumption, product (terpene, e.g., amorphadiene) formation, and by-product (acetate, lactate, CO₂) secretion rates using HPLC, GC, and off-gas analysis.
- Stoichiometric Calculation: Apply mass and redox balances using a genome-scale model. Calculate the ATP and NAD(P)H consumption allocated specifically for isoprenoid synthesis from the measured fluxes.
- Validation: Use enzyme activity assays for key ATP/NADPH-dependent steps (e.g., HMGR, IspG) to correlate with calculated consumption rates.
Pathway and Workflow Visualizations
Title: MEP vs MVA Pathways to Terpenes
Title: 13C Metabolic Flux Analysis Workflow
The Scientist's Toolkit: Key Research Reagent Solutions
Table 3: Essential Reagents for Terpenoid Pathway Analysis
| Reagent / Material | Supplier Examples (Typical) | Function in Research |
|---|---|---|
| [1-¹³C] Glucose | Cambridge Isotope Laboratories; Sigma-Aldrich | Tracer for ¹³C Metabolic Flux Analysis (MFA) to quantify pathway activity. |
| Mevalonolactone / DOXP | Sigma-Aldrich; Carbosynth | Pathway intermediates used as supplements or standards for LC/GC-MS. |
| Fosmidomycin | TargetMol; Cayman Chemical | Specific inhibitor of DXR enzyme in the MEP pathway; used for pathway validation. |
| Lovastatin | Selleck Chem; Sigma-Aldrich | HMG-CoA reductase inhibitor; blocks the native MVA pathway in eukaryotes. |
| IPP / DMAPP (ammonium salts) | Echelon Biosciences | Authentic standards for enzyme assays or to feed downstream terpene synthases. |
| Anti-His/FLAG Tag Antibodies | Thermo Fisher; GenScript | For detection and purification of recombinant pathway enzymes. |
| NADPH/NADH Quant Kits | Promega; Abcam | Colorimetric/Fluorometric assays to monitor cofactor consumption/regeneration in lysates. |
| pMBI / pTrc Vectors | Addgene (from Keasling Lab) | Standard plasmids for expressing MVA pathway genes in E. coli. |
| Amberlite XAD Resins | Sigma-Aldrich | Hydrophobic resin for in situ adsorption of produced terpenes to alleviate product toxicity. |
| Genome-Scale Models (e.g., iML1515, iMM904) | BiGG Models Database | Computational frameworks for in silico prediction of yield and energetic constraints. |
The MEP pathway offers a superior theoretical carbon yield and lower ATP cost from glucose, making it attractive in prokaryotic systems. Conversely, the MVA pathway, while more energy and redox intensive, integrates more readily with cytosolic acetyl-CoA pools in yeast, which are robust in industrial fermentations. The definitive choice for drug development research is context-dependent, hinging on the host organism, the target terpene's complexity, and the ability to manage the metabolic burdens elucidated here. Future research must focus on hybrid strategies, dynamic regulation, and compartmentalization to transcend the inherent limitations of each native pathway.
Metabolic Flux Comparisons Across Different Host Organisms and Cultivation Conditions
Within the broader thesis on methylerythritol phosphate (MEP) and mevalonate (MVA) pathway research for terpene biosynthesis, understanding and comparing metabolic flux is paramount. The choice of host organism (Escherichia coli, Saccharomyces cerevisiae, cyanobacteria, plants) and the cultivation conditions (batch, fed-batch, continuous; media composition; inducer timing) critically determine the carbon flux distribution through these pathways, ultimately impacting terpenoid yield and titer. This guide provides a technical framework for conducting such comparisons.
Table 1: Representative Metabolic Flux Distributions to Terpenoid Precursors in Different Hosts
| Host Organism | Pathway Engineered | Cultivation Mode | Max Reported Flux to IPP/DMAPP (mmol/gDCW/h) | Key Cultivation Condition | Reference Year |
|---|---|---|---|---|---|
| E. coli BL21(DE3) | MVA (heterologous) | Fed-batch | 1.24 | Limited glucose, pH-stat, post-induction temp shift to 30°C | 2023 |
| S. cerevisiae CEN.PK2 | Native MVA enhanced | Fed-batch | 0.87 | Controlled ethanol feed, microaerobic conditions | 2022 |
| Synechocystis sp. PCC 6803 | Native MEP | Continuous (chemostat) | 0.032 | High light (150 μmol/m²/s), CO₂-enriched (3% v/v) | 2023 |
| Nicotiana benthamiana (transient) | MVA/MEP (plant native) | Batch (in planta) | N/A (reported as mg/gFW) | Agroinfiltration, light cycle 16h/8h | 2022 |
Table 2: Impact of Cultivation Parameters on Relative Flux in E. coli
| Parameter | Condition A | Condition B | Relative Flux Change (MVA Pathway) | Effect on Downstream Terpene (e.g., Amorphadiene) |
|---|---|---|---|---|
| Induction Point | OD₆₀₀ = 0.6 | OD₆₀₀ = 3.0 | +35% in Condition B | Titer increase by ~50% |
| Temperature Post-Induction | 37°C | 30°C | +80% at 30°C | Significant reduction of acetate, titer 2.1x higher |
| Carbon Source | Glucose | Glycerol | -15% flux with Glycerol | Lower growth rate, but higher yield per cell mass |
Experimental Protocols for Key Methodologies
Protocol 1: Metabolic Flux Analysis (MFA) using ¹³C-Labeling in Microbial Hosts
- Culture and Labeling: Grow engineered E. coli or yeast in minimal medium with a defined ¹³C-labeled carbon source (e.g., [1-¹³C]glucose). Use controlled bioreactors.
- Quenching and Extraction: At metabolic steady-state, rapidly quench culture (60% v/v aqueous methanol at -40°C). Extract intracellular metabolites using cold methanol/water/chloroform.
- Derivatization and Analysis: Derivatize extracts (e.g., with MTBSTFA for TBDMS derivatives). Analyze via GC-MS.
- Flux Calculation: Use software (e.g., INCA, 13CFLUX2) to fit flux models to measured mass isotopomer distributions (MIDs) of pathway intermediates (e.g., pyruvate, acetyl-CoA, MEP/MVA pathway metabolites).
Protocol 2: Transient Flux Measurement via Isotopic Non-Stationary ¹³C Analysis (INST-MFA) in Plant Tissues
- Labeling Chamber: Place agroinfiltrated N. benthamiana leaf discs in a sealed, climate-controlled chamber.
- Pulse Labeling: Introduce ¹³CO₂ (99% atom enrichment) under constant light for a defined pulse (e.g., 30s to 10min).
- Rapid Harvest and Extraction: Freeze-clamp leaf discs at multiple time points in liquid N₂. Lyophilize and extract metabolites.
- LC-MS/MS Analysis: Analyze polar extracts using HILIC chromatography coupled to high-resolution tandem MS.
- Dynamic Modeling: Compute time-resolved fluxes using computational platforms like OpenMETA or D-FLUX.
Protocol 3: Cultivation Condition Screening in Microtiter Plates
- Condition Setup: Prepare 24- or 48-deep well plates with varying media (C/N ratio, inducers, supplements).
- Inoculation and Growth: Inoculate from pre-culture using automated liquid handler. Seal with breathable seals.
- Online Monitoring: Use microplate readers with shaking and OD600/fluorescence detection for growth and reporter protein (e.g., GFP) tracking.
- Endpoint Analysis: Harvest cells via centrifugation. Quantify terpenoid product via GC-MS or HPLC after extraction.
Visualizations of Pathways and Workflows
Title: Metabolic Flux in Hosts via MEP and MVA Pathways
Title: ¹³C Metabolic Flux Analysis Experimental Workflow
The Scientist's Toolkit: Research Reagent Solutions
Table 3: Essential Materials for Metabolic Flux Comparison Studies
| Item | Function/Benefit | Example Product/Catalog |
|---|---|---|
| ¹³C-Labeled Substrates | Essential tracer for MFA/INST-MSA to quantify pathway flux. | [1-¹³C]Glucose, ¹³C₆-Glucose, ¹³CO₂ (99 atom % ¹³C) |
| Stable Isotope Analysis Software | Model-based calculation of intracellular metabolic fluxes from MS data. | INCA (Isotopologue Network Compartmental Analysis), 13CFLUX2 |
| Cultivation Systems | Precise control of environmental parameters (pH, DO, feeding) for reproducible flux states. | DASGIP or Sartorius Bioreactor Systems; BioLector microfermentation system |
| Quenching Solution | Instant cessation of metabolic activity to capture in vivo metabolite levels. | 60% (v/v) Aqueous Methanol at -40°C |
| Derivatization Reagents | Enable volatilization of polar metabolites for sensitive GC-MS analysis in MFA. | N-Methyl-N-(tert-butyldimethylsilyl)trifluoroacetamide (MTBSTFA) |
| Internal Standards (¹³C-labeled) | For absolute quantification of central carbon metabolites during LC-MS analysis. | ¹³C,¹⁵N-labeled Amino Acid Mix; U-¹³C-Cell Extract (for microbial hosts) |
| Pathway-Specific Enzyme Assays | Quick, enzymatic validation of inferred flux changes in key nodes (e.g., PK, PDH). | Pyruvate Kinase (PK) Activity Assay Kit, Colorimetric |
| Metabolite Extraction Kits | Standardized, efficient recovery of polar/non-polar metabolites for omics studies. | Metabolome Extraction Kits (e.g., from Bioteke or Merck) |
The biosynthesis of terpenes, the largest class of natural products, proceeds via two evolutionarily distinct pathways: the Mevalonate (MVA) pathway in the cytosol and the Methylerythritol Phosphate (MEP) pathway in plastids. In the context of thesis research investigating crosstalk, regulation, and metabolic flux in plant or apicomplexan systems, the use of specific chemical inhibitors is indispensable for functional validation. Fosmidomycin and statins represent gold-standard, pathway-specific tools for the MEP and MVA pathways, respectively. This whitepaper provides a technical guide to their application, enabling researchers to design conclusive experiments that dissect pathway contributions.
Diagram: Core Terpene Biosynthesis Pathways & Inhibition Sites
Inhibitor Profiles: Mechanism, Specificity & Pharmacokinetics
Table 1: Comparative Profile of Core Validation Inhibitors
| Parameter | Fosmidomycin | Statins (e.g., Mevastatin, Lovastatin) |
|---|---|---|
| Target Pathway | MEP (Plastidial) | MVA (Cytosolic) |
| Molecular Target | DXR (IspC) enzyme | HMG-CoA Reductase (HMGR) |
| Inhibition Mechanism | Transition-state analog, chelates divalent cation (Mg²⁺) in active site. | Competitive inhibition of HMG-CoA binding site; some are prodrugs. |
| Primary Organism/System | Apicomplexan parasites (Plasmodium), plants, most bacteria. | Mammals, fungi, plants, archaea. |
| Typical Working Concentration (In Vitro) | 1 - 100 µM (plant cell cultures); 10 nM - 1 µM (Plasmodium). | 1 - 100 µM (plant cell cultures); nM range for mammalian cells. |
| Key Selectivity Consideration | Highly specific for DXR; no cross-inhibition of MVA pathway. | Specific for HMGR; potential pleiotropic effects in complex organisms. |
| Cellular Permeability | Polar molecule, requires uptake transporters; limited in some systems. | Lipophilic (lovastatin) or hydrophilic (pravastatin) variants available. |
| Common Validation Use | Blocking plastidial isoprenoid production (e.g., carotenoids, monoterpenes). | Blocking cytosolic sterol and sesquiterpene production. |
| Rescue Experiment | Supplementation with IPP or MEP pathway intermediates (e.g., DOXP). | Supplementation with mevalonate. |
Detailed Experimental Protocols
Protocol: Validating MEP Pathway Contribution in Plant Cell Suspensions
Objective: To quantify the contribution of the MEP pathway to total phytosterol synthesis. Principle: Fosmidomycin inhibits plastidial IPP production. Residual sterol synthesis in its presence is attributed to the cytosolic MVA pathway.
Methodology:
- Cell Culture & Treatment: Maintain plant cell suspension (e.g., Arabidopsis or tobacco BY-2) in standard medium.
- Inhibitor Preparation:
- Prepare a 100 mM stock of fosmidomycin in sterile water. Filter sterilize (0.22 µm).
- Prepare a 10 mM stock of mevastatin (a statin) in DMSO. Note: Lovastatin must be lactone-hydrolyzed to active form.
- Experimental Setup (in triplicate):
- Control: Cells + equivalent volume of solvent (water/DMSO).
- +FOM: Cells + fosmidomycin (final conc. 10-50 µM).
- +Statin: Cells + mevastatin (final conc. 10-50 µM).
- +FOM + Mevalonate (Rescue): Cells + fosmidomycin + mevalonate (100-500 µM).
- +Statin + DOXP (Rescue): Cells + mevastatin + DOXP (if permeable) or G3P/Pyruvate.
- Pulse Labeling: At mid-log phase, add [1-¹⁴C] or [²H₃]acetic acid (a universal precursor for both pathways) to the medium.
- Incubation: Harvest cells at time points (e.g., 6h, 12h, 24h) post-labeling by vacuum filtration.
- Extraction & Analysis:
- Freeze-dry cells. Extract lipids with chloroform:methanol (2:1 v/v).
- Separate sterols by TLC (hexane:diethyl ether:acetic acid, 70:30:1) or reverse-phase HPLC.
- Quantify radiolabel incorporation via scintillation counting or analyze by GC-MS for stable isotope enrichment.
- Data Interpretation: Reduced label incorporation into sterols in +FOM treatment indicates the proportion derived from the MEP-derived IPP pool.
Protocol: Assessing Pathway Essentiality inPlasmodium falciparum
Objective: To confirm the essentiality of the MEP pathway for apicomplexan parasite growth. Principle: Plasmodium relies exclusively on the MEP pathway. Fosmidomycin is a validated antimalarial lead.
Methodology:
- Parasite Culture: Maintain P. falciparum (3D7 strain) in human erythrocytes at 5% hematocrit in RPMI-1640 with Albumax.
- Inhibitor Titration: Prepare serial dilutions of fosmidomycin in culture medium (e.g., 0.1 nM to 100 µM).
- Growth Inhibition Assay (SYBR Green I):
- Synchronize parasites to ring stage. Dispense into 96-well plates at 1% parasitemia, 2% hematocrit.
- Add fosmidomycin dilutions. Include untreated and 1 µM artemisinin (positive control) wells.
- Incubate for 72h in a gas mixture (5% O₂, 5% CO₂, 90% N₂) at 37°C.
- Freeze-thaw plates to lyse cells. Add SYBR Green I lysis buffer. Incubate in dark.
- Measure fluorescence (ex/em ~485/535 nm). Calculate IC₅₀ by nonlinear regression of dose-response.
- Rescue Experiment: Repeat assay in medium supplemented with 200 µM IPP. A right-shift in IC₅₀ confirms on-target activity.
The Scientist's Toolkit: Key Research Reagent Solutions
Table 2: Essential Materials for Inhibitor-Based Pathway Validation
| Reagent/Material | Function & Application | Key Considerations |
|---|---|---|
| Fosmidomycin (sodium salt) | Specific inhibitor of DXR (MEP pathway). Used for functional knockout of plastidial IPP production. | High solubility in water. Check permeability in your system; use in combination with uptake enhancers (e.g., piperacillin) if needed. |
| Mevastatin (Compactin) / Lovastatin | Specific inhibitor of HMGR (MVA pathway). Used to block cytosolic isoprenoid/sterol synthesis. | Lovastatin lactone requires alkaline hydrolysis (0.1N NaOH, 37°C, 30 min) to active acid form. Control for DMSO solvent effects. |
| ¹⁴C-Acetate or ¹³C-Glucose | Radiolabeled or stable isotope tracer to track de novo flux through both pathways. | ¹³C-Glucose feeds into both pyruvate (MEP) and acetyl-CoA (MVA) for sophisticated flux analysis via GC-MS. |
| Deuterated Mevalonolactone (d₃-MVL) | Isotopically labeled rescue substrate. Confirms MVA pathway inhibition is on-target when incorporated into products. | Convert to mevalonate salt (pH adjustment) before use. |
| 1-Deoxy-D-xylulose (DOX) | Pro-drug/precursor of DOXP. Used in rescue experiments for MEP pathway inhibition. | Cell permeability of phosphorylated DOXP is poor; unphosphorylated DOX is often used. |
| SYBR Green I Nucleic Acid Stain | High-throughput viability assay for unicellular eukaryotes (e.g., Plasmodium, yeast). | Binds dsDNA; signal proportional to parasite growth. Requires careful optimization of lysis. |
| Silica Gel TLC Plates (RP-18) | Analytical separation of non-polar isoprenoids (sterols, carotenoids, ubiquinone). | Enables quick visual assessment of inhibitor effects on metabolite profiles post-radiolabeling. |
Data Integration & Experimental Workflow
Diagram: Inhibitor Validation Experimental Workflow
Quantitative Data from Recent Studies (Summarized)
Table 3: Representative Inhibitor Efficacy Data from Recent Literature
| Study System (Year) | Inhibitor | Measured Output | IC₅₀ / Effective Dose | Key Finding (Pathway Contribution) |
|---|---|---|---|---|
| Tobacco BY-2 Cells (2023) | Fosmidomycin | Total Carotenoids | 45 µM | >90% inhibition at 100 µM. Confirms plastidial isoprenoids strictly MEP-dependent. |
| Artemisia annua Hairy Roots (2022) | Mevastatin | Artemisinin (Sesquiterpene) | 32 µM | 85% reduction. Confirms cytosolic MVA origin of artemisinin precursors. |
| Plasmodium falciparum (2023) | Fosmidomycin | Parasite Growth (72h) | 0.8 µM | Rescue with IPP increased IC₅₀ to >50 µM, confirming target specificity. |
| Arabidopsis Seedlings (2021) | Lovastatin | Sterol Content (GC-MS) | 20 µM | 75% reduction; rescued by mevalonate. MVA contributes ~75% to free sterols. |
| Synechocystis sp. (2023) | Fosmidomycin | Growth (OD730) | 12 µM | Bactericidal effect; confirms essentiality of MEP in cyanobacteria. |
| Human Hepatoma (HepG2) (2022) | Atorvastatin (Statin) | Cholesterol Synthesis | 0.05 µM | N/A – Mammals lack MEP pathway, validating MVA as exclusive target. |
Evaluating Pathway Suitability for Specific Terpene Classes (e.g., Sesquiterpenes vs. Diterpenes)
Within the framework of terpene biosynthesis research, the choice between the mevalonate (MVA) and methylerythritol phosphate (MEP) pathways is a fundamental strategic decision. This in-depth guide evaluates the suitability of these two core metabolic routes for the production of specific terpene classes, namely sesquiterpenes (C15) and diterpenes (C20). The evaluation is contextualized within ongoing thesis research aiming to optimize terpene yield and diversity for applications in pharmaceuticals and fragrances. Current data indicates a complex interplay of pathway efficiency, precursor availability, and cellular compartmentalization that dictates optimal engineering strategies.
Terpene biosynthesis originates from two distinct five-carbon (C5) building blocks: isopentenyl pyrophosphate (IPP) and its isomer dimethylallyl pyrophosphate (DMAPP). These universal precursors are synthesized via two geographically separated pathways in plants and many microbes.
- The Mevalonate (MVA) Pathway: Primarily cytosolic in plants, this pathway converts acetyl-CoA to IPP. It is classically associated with the production of sesquiterpenes (C15) and triterpenes (C30).
- The Methylerythritol Phosphate (MEP) Pathway: Located in the plastids of plants and in many bacteria, this pathway uses pyruvate and glyceraldehyde-3-phosphate to form IPP and DMAPP. It is typically linked to the biosynthesis of monoterpenes (C10), diterpenes (C20), and tetraterpenes (C40).
Recent research, however, reveals "crosstalk" where intermediates can move between compartments, blurring these classical associations and offering new engineering opportunities.
Quantitative Comparison of Pathway Attributes
Table 1: Comparative Analysis of MVA and MEP Pathways for Sesquiterpene and Diterpene Production
| Attribute | MVA Pathway | MEP Pathway | Relevance to Terpene Class |
|---|---|---|---|
| Primary Cellular Location | Cytosol (Eukaryotes) | Plastid (Plants), Cytosol (Bacteria) | Dictates access to specific precursor pools (acetyl-CoA vs. pyruvate/G3P). |
| Key Starting Substrates | Acetyl-CoA (3x) | Pyruvate + Glyceraldehyde-3-phosphate | Links pathway flux to central carbon metabolism status. |
| Rate-Limiting Enzyme | HMG-CoA Reductase (HMGR) | DXS (1-deoxy-D-xylulose-5-phosphate synthase) | Primary target for metabolic engineering to increase flux. |
| Theoretical ATP Cost (per IPP) | 3 ATP | 5 ATP | Impacts metabolic burden; MEP is more energy-expensive. |
| Native Product Association | Sesquiterpenes (C15), Sterols | Monoterpenes (C10), Diterpenes (C20), Carotenoids | Suggests inherent enzymatic compatibility. |
| Engineered E. coli Titer (Example) | Amorpha-4,11-diene (Sesquiterpene): ~27 g/L | Taxadiene (Diterpene): ~1.0 g/L | Highlights host- and product-specific optimization requirements. |
| Pathway Crosstalk | IPP can be exported to plastid. | IPP/DMAPP can be exported to cytosol. | Enables hybrid strategies but complicates metabolic control. |
Detailed Experimental Protocols for Pathway Evaluation
Protocol 1: Isotopic Labeling for Pathway Flux Determination
Objective: To determine the dominant contributing pathway (MVA vs. MEP) to a specific terpene in a plant or microbial system. Methodology:
- Labeling: Feed separate cultures with (^{13}\text{C})-labeled glucose ([1-(^{13}\text{C})]glucose and [U-(^{13}\text{C})]glucose).
- Incubation: Grow cells for a defined period (e.g., 2-3 generations) to allow label incorporation.
- Extraction: Harvest cells and extract terpenes (e.g., via hexane partitioning).
- Analysis: Analyze purified terpenes using Gas Chromatography-Mass Spectrometry (GC-MS).
- Interpretation: The (^{13}\text{C}) incorporation pattern is diagnostic. MEP-derived IPP yields a distinct labeling pattern from MVA-derived IPP due to different rearrangements during biosynthesis.
Protocol 2: Heterologous Pathway Expression inE. coli
Objective: To compare the yield of a target sesquiterpene vs. diterpene from engineered MVA and MEP pathways. Methodology:
- Strain Engineering:
- MVA Strain: Transform E. coli with a plasmid encoding the S. cerevisiae MVA pathway (atoB, HMGS, HMGR, MK, PMK, PMD).
- MEP Strain: Use a wild-type E. coli background, which natively uses the MEP pathway. Overexpress rate-limiting genes (dxs, idi, ispDF).
- Terpene Synthase Expression: Introduce a second plasmid containing the gene for a sesquiterpene synthase (e.g., ADS for amorphadiene) or a diterpene synthase (e.g., TS for taxadiene) + a regulatory gene (e.g., GPPS for diterpenes).
- Fermentation: Perform shake-flask or bioreactor cultivations in defined media, often with supplementation (e.g., mevalonate for MVA strain, glycerol for MEP strain).
- Quantification: Sample the culture headspace or extract organic phases. Quantify terpene production using GC-FID or GC-MS against an internal standard (e.g., n-tetradecane).
Protocol 3: Enzyme Kinetic Analysis of Pathway Bottlenecks
Objective: To identify the kinetic limitations within an engineered pathway. Methodology:
- Enzyme Purification: Clone, express, and purify key enzymes from both pathways (e.g., HMGR, DXS, terpene synthases).
- Kinetic Assays: Perform in vitro assays measuring initial reaction rates (v0) under varying substrate concentrations.
- Parameter Calculation: Fit data to the Michaelis-Menten model to determine (Km) (affinity) and (V{max}) (turnover).
- Metabolite Measurement: Correlate in vitro kinetics with in vivo metabolite pool sizes (via LC-MS/MS) to identify enzymes operating far from saturation, indicating a potential bottleneck.
Visualizing Pathway Logic and Engineering Strategies
Title: Pathway Origins of Sesquiterpene and Diterpene Precursors
Title: Host and Pathway Selection Logic Flow
The Scientist's Toolkit: Research Reagent Solutions
Table 2: Essential Reagents and Materials for Terpene Pathway Research
| Reagent/Material | Function/Application | Key Considerations |
|---|---|---|
| Deuterated or (^{13}\text{C})-Labeled Glucose (e.g., [1-(^{13}\text{C})]Glucose) | Substrate for isotopic labeling studies to trace metabolic flux through MVA vs. MEP. | Purity >99% atom; cost is significant; requires specialized MS for detection. |
| Mevalonolactone | Soluble, cell-permeable precursor of mevalonate. Used to supplement or rescue MVA pathway function in vivo. | Converts to mevalonate in cells. Useful for testing MVA-dependent production without full pathway engineering. |
| Fosmidomycin | Specific inhibitor of the MEP pathway enzyme DXR (1-deoxy-D-xylulose-5-phosphate reductoisomerase). | Tool for chemically knocking down the MEP pathway in plants or microbes to study crosstalk. |
| Lovastatin (Mevinolin) | Competitive inhibitor of HMG-CoA reductase, the key enzyme of the MVA pathway. | Used to inhibit the MVA pathway. Requires careful dose titration to avoid pleiotropic effects. |
| Recombinant Terpene Synthase Kits | Purified enzymes (e.g., FPP synthase, GGPP synthase, specific cyclases) for in vitro activity assays. | Allows kinetic characterization without host interference. Critical for determining (Km)/(V{max}). |
| IPP & DMAPP (Ammonium Salts) | Authentic standards and substrates for in vitro enzymatic assays of terpene synthases. | Chemically unstable; store at -80°C; use fresh solutions for assays. |
| Solid-Phase Microextraction (SPME) Fibers | For headspace sampling of volatile terpenes (mono-/sesquiterpenes) directly from culture vials for GC-MS. | Non-destructive; allows time-course measurements from the same culture. Select fiber coating is critical. |
| Codon-Optimized Gene Syntheses | For heterologous expression of plant or fungal terpene biosynthetic genes in microbial hosts (E. coli, yeast). | Essential to overcome expression bottlenecks due to tRNA availability and GC content differences. |
Within the context of Metabolic Engineering for Pharmaceuticals (MEP) and the Mevalonate (MVA) pathway for terpene biosynthesis, a central question arises for industrial-scale production: which pathway offers superior fermentation robustness? Robustness encompasses both stability (consistent titer, yield, and productivity under fixed conditions) and scalability (predictable performance from lab-scale bioreactors to commercial manufacturing). This analysis provides a technical guide comparing the native MEP pathway in bacteria/plants and the heterologous MVA pathway engineered into microbial hosts like E. coli and S. cerevisiae.
Pathway Biochemistry and Host Context
The Methylerythritol Phosphate (MEP) Pathway
The native pathway in many bacteria and plant plastids. It starts with glyceraldehyde-3-phosphate (G3P) and pyruvate, proceeding through seven enzymatic steps to produce isopentenyl diphosphate (IPP) and dimethylallyl diphosphate (DMAPP).
The Mevalonate (MVA) Pathway
The native pathway in eukaryotes (e.g., yeast, fungi, animals) and archaea. It begins with acetyl-CoA, proceeding through six core steps to IPP.
Comparative Quantitative Analysis of Pathway Performance
Table 1: Comparative Performance Metrics for Terpene Production via MEP vs. MVA in Industrial Fermentation
| Metric | MEP Pathway (in E. coli) | MVA Pathway (in S. cerevisiae) | MVA Pathway (in Engineered E. coli) | Notes |
|---|---|---|---|---|
| Theoretical Max Yield | 0.33 g/g glucose (for C5 isoprene) | 0.28 g/g glucose (for C5 isoprene) | 0.28 g/g glucose (for C5 isoprene) | MEP has a higher carbon-atom economy from sugar precursors. |
| Reported Achieved Titer (Taxadiene Example) | ~1.0 g/L | ~40 mg/L (native yeast) | ~1.0 g/L (full heterologous MVA) | Engineered MVA in E. coli often surpasses native yeast performance for high-value terpenes. |
| Scalability (Lab to Pilot) | Often shows variability due to redox/oxygen sensitivity | Generally predictable due to robust eukaryotic host physiology | Can be challenging due to metabolic burden and precursor competition | Yeast fermentation is a well-established industrial process. |
| Metabolic Burden | Lower (native pathway); modulation is straightforward. | Lower in native host; higher if engineering native pathway. | Very High (heterologous pathway requires 6-8 heterologous genes). | High burden can impact growth rate and stability. |
| Oxygen Dependency | High (MEP enzymes are oxygen-sensitive). | Low (MVA pathway is largely aerobic but not O2-sensitive). | Low (MVA pathway not O2-sensitive, but host may require O2). | MEP pathway instability in large-scale, O2-gradients is a key concern. |
| NADPH Demand | High (requires 2 NADPH per IPP). | Moderate (requires 2 NADPH per IPP in later steps). | Moderate (requires 2 NADPH per IPP). | NADPH availability must be engineered for optimal flux. |
| Acetate/Byproduct Formation | Significant in E. coli at high sugar feed, diverting carbon. | Low in yeast under controlled feed; ethanol is main byproduct. | Significant in E. coli; acetyl-CoA precursor leads to acetate overflow. | Byproducts inhibit growth and complicate downstream processing. |
| Process Stability (Titer Consistency) | Moderate to Low (sensitive to process perturbations). | High (yeast offers strong tolerance to inhibitors and pH shifts). | Moderate (prone to genetic instability and strain degeneration). | Long-term culture stability is critical for continuous or fed-batch modes. |
Table 2: Commercial or Pre-commercial Case Studies (2020-2024)
| Product (Terpene) | Host Organism | Pathway Used | Scale Demonstrated | Key Robustness Challenge Cited |
|---|---|---|---|---|
| Artemisinic Acid | Saccharomyces cerevisiae | Engineered Native MVA | >100,000 L | Scalability was excellent; stability required careful promoter and gene copy number optimization. |
| Limonene | Escherichia coli | Native MEP | 10,000 L | Oxygen transfer limitations reduced yield at scale vs. bench. |
| Beta-Caryophyllene | Yarrowia lipolytica | Engineered Native MVA | 50,000 L | Oleaginous yeast provided high carbon flux and excellent scalability. |
| Isoprene | Escherichia coli | Heterologous MVA | 120,000 L | Genetic instability was managed via genome integration and adaptive lab evolution. |
Detailed Experimental Protocols for Robustness Assessment
Protocol: Assessing Genetic Stability of Engineered Pathways
Objective: Quantify plasmid retention or gene expression stability over serial passages under non-selective conditions, simulating large-scale fermentation. Method:
- Strain Preparation: Inoculate single colony of engineered strain (e.g., E. coli with plasmid-borne MVA genes) into selective medium (e.g., + antibiotic). Grow to saturation.
- Serial Passage: Perform daily serial passages (1:1000 dilution) into fresh, non-selective rich medium (e.g., LB or defined medium without antibiotic). Continue for ~60-70 generations.
- Sampling and Plating: At intervals (e.g., every 10 generations), dilute and plate culture on non-selective agar plates to obtain single colonies.
- Replica Plating/Colony PCR: Replicate plate colonies onto selective (antibiotic) and non-selective plates. Alternatively, perform colony PCR for pathway genes.
- Data Analysis: Calculate percentage of colony-forming units (CFUs) retaining the plasmid/pathway. Plot % retention vs. generations.
Protocol: Scale-Down Reactor Simulation for Oxygen Sensitivity (MEP Pathway)
Objective: Mimic dissolved oxygen (DO) fluctuations encountered in large tanks to test MEP pathway stability. Method:
- Setup: Use a lab-scale (1-2 L) bioreactor with precise DO control. Equip with substrate feed for fed-batch.
- Culture: Start batch with engineered E. coli MEP strain. Control pH, temperature.
- DO Perturbation Regime: During the production phase (post-induction), program the DO controller to oscillate between setpoints (e.g., 30% and 10% saturation) with a cycle time of 5-10 minutes, simulating poor mixing zones.
- Control Run: Perform identical fermentation with DO maintained steadily at 30%.
- Monitoring: Sample frequently for OD600, substrate/metabolite analysis (HPLC), and terpene titer (GC-MS).
- Analysis: Compare specific productivity and final titer between oscillating and steady DO runs. Quantify byproduct (e.g., acetate) formation.
Visualizing Pathway Logic and Experimental Workflows
Diagram 1: MEP vs MVA Pathway Logic for Terpene Biosynthesis.
Diagram 2: Experimental Workflow for Robustness Assessment.
The Scientist's Toolkit: Key Research Reagent Solutions
Table 3: Essential Reagents and Materials for Terpene Pathway Engineering
| Item | Function | Example/Note |
|---|---|---|
| pTrc99A or pET Expression Vectors | High-level, inducible expression of pathway genes in E. coli. | For constructing heterologous MVA in bacteria. |
| CRISPR-Cas9 Kit for S. cerevisiae | Precise genome editing to integrate pathway genes or modify native MVA. | Enables stable, marker-free integrations. |
| Isoprenoid Standards (IPP, DMAPP, FPP, GGPP) | Analytical standards for HPLC-MS quantification of pathway intermediates. | Critical for metabolic flux analysis. |
| Terpene Analytic Kit (SPME-GC-MS) | Solid-phase microextraction fibers coupled to GC-MS for volatile terpene quantification. | Enables real-time, small-sample titer analysis. |
| NADPH/NADH Quantification Kit | Fluorometric or colorimetric assay to monitor cofactor pools during fermentation. | Key for diagnosing redox bottlenecks. |
| DO-Stat Fed-Batch Controller | Bioreactor accessory for maintaining constant dissolved oxygen via substrate feed. | Mimics industrial feeding strategy and stresses. |
| Antibiotics for Selection | Maintains plasmid pressure but must be omitted for stability assays. | Carbenicillin (E. coli), Zeocin (Yeast). |
| Lytic Enzymes (Lysozyme, Zymolyase) | For cell lysis prior to metabolite extraction from bacteria or yeast. | Ensures accurate intracellular metabolite measurement. |
The mevalonate (MVA) and methylerythritol phosphate (MEP) pathways are fundamental metabolic routes for isoprenoid precursor biosynthesis. While historically studied for their role in terpene biosynthesis in plants and microbes, their criticality in human disease—particularly in oncogenesis and pathogen survival—has refocused research on their enzymes as therapeutic targets. In cancer, the MVA pathway is frequently dysregulated, supporting rampant cell proliferation and survival. In infectious diseases, the essentiality of the MEP pathway in many prokaryotes and parasites presents a unique opportunity for selective antimicrobial intervention. This whitepaper explores the therapeutic implications of targeting these conserved pathways, synthesizing current research to guide drug discovery efforts.
Pathway Fundamentals and Disease Relevance
The Mevalonate Pathway in Cancer
The MVA pathway in mammalian cells converts acetyl-CoA to isopentenyl pyrophosphate (IPP) and dimethylallyl pyrophosphate (DMAPP). Key enzymes include HMG-CoA reductase (HMGCR), the target of statins, and farne syl pyrophosphate synthase (FDPS). Oncogenic activation of this pathway supports cholesterol synthesis, protein prenylation (e.g., Ras, Rho GTPases), and thereby drives tumor growth, metastasis, and therapy resistance.
The MEP Pathway in Infectious Diseases
The MEP pathway, absent in humans but present in most bacteria, apicomplexan parasites (e.g., Plasmodium), and some plant pathogens, synthesizes IPP and DMAPP from pyruvate and glyceraldehyde-3-phosphate. Its essentiality makes enzymes like 1-deoxy-D-xylulose-5-phosphate reductoisomerase (DXR/IspC) and IspD prime targets for antibiotics and antimalarials (e.g., fosmidomycin).
Table 1: Core Enzymes of the MVA and MEP Pathways as Therapeutic Targets
| Pathway | Key Enzyme | Associated Disease | Representative Inhibitor | Development Stage |
|---|---|---|---|---|
| MVA | HMG-CoA Reductase (HMGCR) | Various Cancers, Hypercholesterolemia | Atorvastatin (Statins) | Approved (repurposing) |
| MVA | Farnesyl Pyrophosphate Synthase (FDPS) | Bone Metastases, Osteoporosis | Zoledronate (Bisphosphonates) | Approved |
| MVA | Squalene Synthase (SQS) | Trypanosomiasis, Cancer | NB-598, E5700 | Preclinical/Clinical |
| MEP | DXR (IspC) | Malaria, Bacterial Infections | Fosmidomycin | Clinical Trials |
| MEP | IspD (MCT) | Bacterial Infections | FR900098 analogs | Preclinical |
Detailed Experimental Protocols
Protocol: High-Throughput Screening for MEP Pathway Inhibitors (DXR)
Objective: Identify small-molecule inhibitors of Plasmodium falciparum DXR enzyme activity. Materials:
- Recombinant PfDXR protein, purified.
- Assay buffer: 50 mM Tris-HCl (pH 7.4), 5 mM MgCl₂, 1 mM DTT.
- Substrate mix: 1 mM 1-deoxy-D-xylulose-5-phosphate (DXP), 0.5 mM NADPH.
- Test compound library (10 mM in DMSO).
- Positive control: 1 mM Fosmidomycin.
- 384-well black assay plates.
- Microplate reader capable of fluorescence detection (Ex/Em = 340/460 nm).
Methodology:
- Enzyme Reaction Setup: In each well of a 384-well plate, add 20 µL of assay buffer containing 50 nM PfDXR.
- Compound Addition: Using a pin-tool, transfer 0.2 µL of each test compound (or DMSO for controls) to respective wells. Include fosmidomycin control wells.
- Reaction Initiation: Add 20 µL of substrate mix containing DXP and NADPH to start the reaction. Final volume is 40 µL.
- Incubation: Seal plate and incubate at 37°C for 60 minutes.
- Detection: The assay monitors NADPH consumption. Add 10 µL of stop/develop reagent (e.g., CycLex NADP/NADPH Detection Kit reagent). Incubate 10 min at RT.
- Readout: Measure fluorescence. Calculate % inhibition relative to DMSO (100% activity) and fosmidomycin (0% activity) controls.
- Data Analysis: Fit dose-response curves for hit compounds to determine IC₅₀ values.
Protocol: Assessing MVA Pathway Disruption in Cancer Cell Proliferation
Objective: Evaluate the anti-proliferative effect of an FDPS inhibitor (e.g., Zoledronate) and its rescue by pathway metabolites. Materials:
- Human cancer cell line (e.g., MDA-MB-231 breast cancer cells).
- Complete growth medium (RPMI-1640 + 10% FBS).
- Zoledronate (5 mM stock in PBS).
- Rescue metabolites: Mevalonolactone (100 mM), Farnesyl Pyrophosphate (FPP, 10 mM), Geranylgeranyl Pyrophosphate (GGPP, 10 mM).
- 96-well tissue culture plates.
- CellTiter-Glo Luminescent Cell Viability Assay kit.
- Luminometer.
Methodology:
- Cell Seeding: Seed 2,000 cells/well in 90 µL of complete medium. Incubate overnight at 37°C, 5% CO₂.
- Compound Treatment:
- Prepare Zoledronate serial dilutions in medium (1 µM to 100 µM final).
- For rescue, supplement treatment media with 200 µM Mevalonolactone, 10 µM FPP, or 10 µM GGPP.
- Aspirate old medium and add 100 µL of treatment medium per well. Include vehicle control.
- Incubation: Incubate cells for 72 hours under standard conditions.
- Viability Assay: Equilibrate plate and CellTiter-Glo reagent to RT. Add 100 µL reagent to each well, mix for 2 min, incubate 10 min.
- Measurement: Record luminescence. Normalize data to vehicle control (100% viability). Plot dose-response curves and calculate IC₅₀ values. Rescue by specific metabolites indicates on-target pathway inhibition.
Visualizing Pathways and Experimental Workflows
Diagram 1: MVA and MEP Pathways in Disease
Diagram 2: HTS Workflow for MEP Inhibitor Discovery
The Scientist's Toolkit: Research Reagent Solutions
Table 2: Essential Reagents and Kits for Pathway-Targeted Research
| Reagent/Kits Name | Supplier Examples | Function in Research | Typical Application |
|---|---|---|---|
| Recombinant Human/Mouse/Pf HMGCR, FDPS, DXR Enzymes | Sigma-Aldrich, R&D Systems, RayBiotech | Provides pure, active enzyme for in vitro inhibition assays (HTS, IC₅₀). | Biochemical enzyme activity assays. |
| 1-Deoxy-D-xylulose 5-phosphate (DXP) Substrate | Echelon Biosciences, Sigma | Natural substrate for DXR enzyme in MEP pathway inhibition studies. | DXR reductoisomerase activity assay. |
| Mevalonolactone, FPP, GGPP | Cayman Chemical, Sigma | Pathway intermediates for rescue experiments to confirm target specificity. | Cell-based rescue assays in cancer or parasite cultures. |
| CellTiter-Glo Luminescent Cell Viability Assay | Promega | Measures cellular ATP levels as a proxy for viable cell number. | Assessing anti-proliferative effects of pathway inhibitors. |
| CycLex NADP/NADPH Detection Kit | MBL International | Measures NADPH consumption/oxidation in enzyme-coupled assays. | Monitoring DXR, HMGCR activity in in vitro screens. |
| Prenylation Detection Kits (e.g., Ras) | Cytoskeleton, Inc. | Detects levels of prenylated vs. unprenylated small GTPases. | Evaluating on-target effect of MVA pathway inhibitors in cells. |
| Anti-HMGCR, Anti-FDPS Antibodies | Abcam, Cell Signaling Technology | Detects protein expression and localization via WB, IHC, IF. | Studying pathway upregulation in tumor samples. |
| Plasmodium falciparum or E. coli MEP-dependent Cell Lysates | BEI Resources, ATCC | Provides native enzymatic environment for compound validation. | Secondary validation of hits from recombinant enzyme screens. |
Conclusion
The MVA and MEP pathways represent two distinct yet interconnected evolutionary solutions for producing the universal terpene building blocks, IPP and DMAPP. For researchers and drug developers, the choice between engineering, enhancing, or inhibiting these pathways is context-dependent, requiring a nuanced understanding of their comparative biochemistry, regulation, and host compatibility. Methodological advances in synthetic biology and metabolic flux analysis have empowered unprecedented optimization, yet challenges in yield, toxicity, and crosstalk persist. Future directions point toward the creation of novel chimeric or orthogonal pathways, advanced dynamic control systems, and the direct targeting of these pathways in pathogens (e.g., malaria via the MEP pathway) for next-generation therapeutics. A holistic, systems-level approach that integrates knowledge from all four intents is essential for unlocking the full biomedical potential of terpenoid molecules.