Streamlining Drug Discovery: A Rational LC-MS/MS Approach to Designing Efficient Natural Product Libraries
This article details a transformative, LC-MS/MS-driven strategy for rationally designing minimized natural product screening libraries, directly addressing the critical bottleneck of cost and redundancy in early-stage drug discovery.
Streamlining Drug Discovery: A Rational LC-MS/MS Approach to Designing Efficient Natural Product Libraries
Abstract
This article details a transformative, LC-MS/MS-driven strategy for rationally designing minimized natural product screening libraries, directly addressing the critical bottleneck of cost and redundancy in early-stage drug discovery. We explore the foundational principle of using tandem mass spectrometry to map scaffold diversity within extensive extract collections. A step-by-step methodological framework is presented, covering data acquisition, molecular networking analysis, and computational selection to construct libraries representing maximal chemical diversity with minimal sample numbers. The discussion extends to practical troubleshooting for method optimization and robustness, followed by a critical validation of the approach through comparative performance metrics against random selection and full libraries. Demonstrated outcomes include dramatically increased bioassay hit rates and significant reductions in screening costs, offering researchers and drug development professionals a practical, data-driven pathway to accelerate the discovery of novel bioactive leads from nature.
The Chemical Redundancy Challenge: Why Rational Library Design is the Future of Natural Product Discovery
The Historical Significance and Modern Bottleneck of Natural Product Libraries in Drug Discovery
Natural products (NPs) and their derivatives have historically formed the cornerstone of pharmacotherapy, accounting for a substantial proportion of approved drugs, particularly in the realms of oncology, infectious diseases, and metabolic disorders [1] [2]. Their molecular frameworks, honed by millions of years of evolutionary selection, possess unique chemical diversity, stereochemical complexity, and biological relevance that are often unmatched by purely synthetic libraries [1]. This historical success, however, is contrasted by significant bottlenecks that emerged in the late 20th century, including laborious screening processes, challenges in sustainable sourcing, compound rediscovery, and difficulties in structural elucidation and optimization [1] [2] [3]. These challenges led to a waning of interest from major pharmaceutical pipelines.
Today, a powerful resurgence is underway, driven by technological convergence [4]. The integration of advanced analytical techniques—especially liquid chromatography-tandem mass spectrometry (LC-MS/MS)—with genomics, synthetic biology, and artificial intelligence (AI) is reinvigorating the field [1] [5]. This modern paradigm shifts the focus from serendipitous discovery of individual molecules to the rational design of high-quality NP libraries. This article, framed within a thesis research context on LC-MS/MS for rational NP library design, details the historical significance, dissects the modern bottlenecks, and provides actionable application notes and protocols for constructing minimized, diverse, and target-informed NP libraries to accelerate drug discovery.
Historical Significance and the Genesis of Modern Bottlenecks
The historical contribution of NPs to modern medicine is profound. From early isolates like morphine and quinine to blockbuster agents such as paclitaxel and artemisinin, NPs have provided critical pharmacophores against a vast array of human diseases [1] [3]. Their success is rooted in their evolutionary role as signaling and defense molecules, making them inherently predisposed to interact with biological macromolecules [1].
Table 1: Historical Contribution of Natural Products to Drug Discovery
| Era/Period | Key Examples | Therapeutic Area | Impact & Legacy |
|---|---|---|---|
| 19th - Early 20th Century | Morphine, Quinine, Cocaine, Digitalis | Analgesia, Antimalarial, Anesthesia, Cardiology | Isolated "active principles"; founded medicinal chemistry [3]. |
| Antibiotic Era (Mid-20th Century) | Penicillin, Tetracyclines, Streptomycin | Infectious Diseases | Revolutionized medicine; established microbial screening paradigms [3]. |
| Modern Oncology & Beyond (Late 20th Century) | Paclitaxel, Doxorubicin, Cyclosporine, Statins | Cancer, Immunology, Cardiovascular | Addressed complex diseases; highlighted supply and synthesis challenges [1] [3]. |
| 21st Century Renaissance | Artemisinins, Eribulin (Halichondrin analog), Plitidepsin | Antimalarial, Cancer, Antiviral | Inspired by complex NPs; driven by advanced analytics and engineering [1] [4]. |
Despite this legacy, the traditional NP drug discovery process developed intrinsic bottlenecks:
- Redundancy and Rediscovery: Large extract libraries contain significant overlap in metabolite production, leading to wasted resources on known compounds [6].
- Limited Chemical Diversity in Screens: Unprioritized libraries often fail to maximize the scaffold diversity presented to biological assays.
- Analytical Burden: Dereplication and structure elucidation are time-consuming and rate-limiting steps.
- Supply and Sustainability: Scaling production of complex NPs from original sources is often ecologically unsustainable or economically unviable [1].
These bottlenecks necessitated a shift from large, uncharacterized collections to smaller, rationally designed, and well-annotated libraries.
Core Protocol: LC-MS/MS-Guided Rational Library Minimization
This protocol, central to the thesis research context, details a method to drastically reduce NP extract library size while retaining chemical diversity and bioactive potential, based on validated research [6] [7].
Application Notes
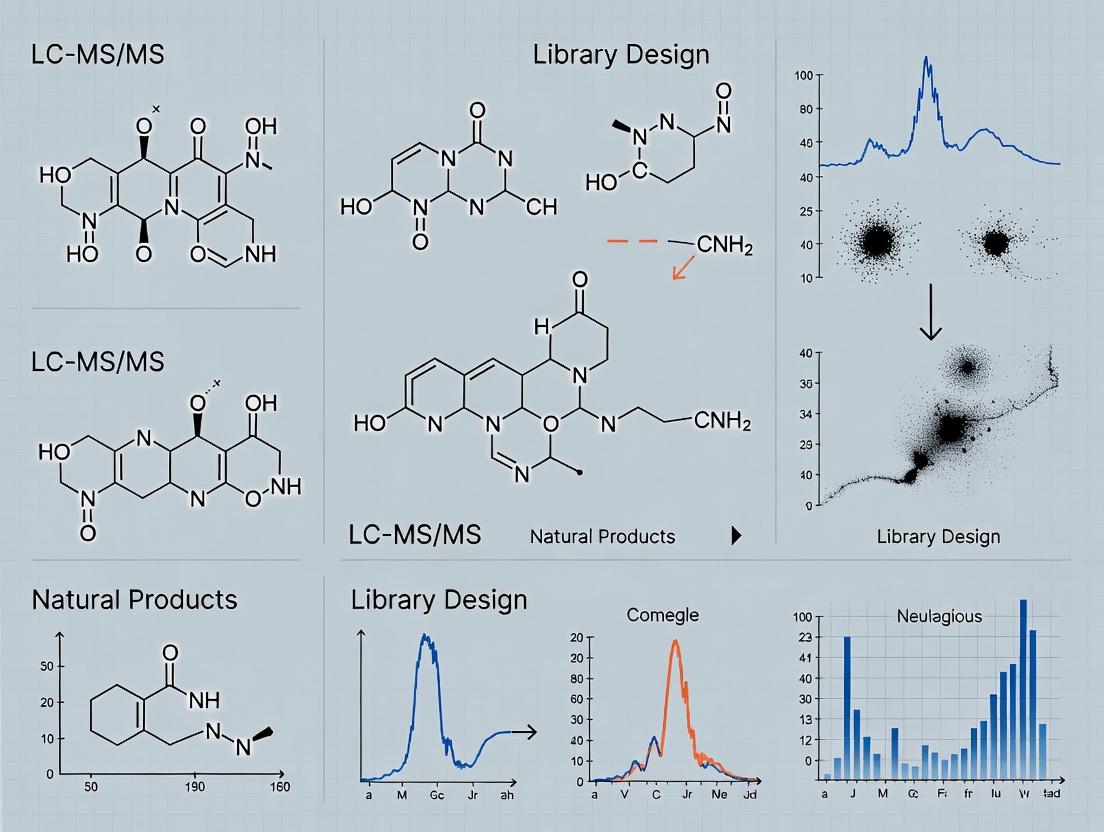
The objective is to transition from a large, redundant library of crude extracts to a minimal library that captures the maximal scaffold diversity. This is achieved by using untargeted LC-MS/MS data to cluster metabolites by structural similarity and then algorithmically selecting the subset of extracts that best represent these clusters. This method has demonstrated an 84.9% reduction in the library size required to reach maximal scaffold diversity, while concurrently increasing bioassay hit rates by reducing redundancy [6].
Materials and Instrumentation (The Scientist's Toolkit)
Table 2: Key Research Reagent Solutions & Equipment
| Item | Function / Specification | Role in Protocol |
|---|---|---|
| Natural Product Extract Library | Crude extracts (e.g., fungal, bacterial) in a compatible solvent (e.g., MeOH, DMSO). | The input library for analysis and minimization. |
| LC-MS/MS System | High-resolution tandem mass spectrometer coupled to a UHPLC system (e.g., Q-TOF, Orbitrap). | Generates MS1 and MS2 spectral data for all detectable metabolites. |
| Chromatography Column | Reversed-phase C18 column (e.g., 2.1 x 100 mm, 1.7-1.9 μm). | Separates metabolites in the extract prior to mass spectrometry. |
| Data Processing Software (GNPS) | Global Natural Products Social Molecular Networking platform. | Performs molecular networking to cluster MS/MS spectra based on similarity. |
| Scripting Environment (R/Python) | Custom scripts for diversity analysis and sample selection [6]. | Implements the rational selection algorithm to build the minimal library. |
| Bioassay Plates & Reagents | Assay-specific materials for validation (e.g., growth media, enzymatic substrates). | Validates the bioactivity retention of the minimized library. |
Step-by-Step Experimental Protocol
Step 1: Untargeted LC-MS/MS Data Acquisition
- Sample Preparation: Reconstitute each crude NP extract in a consistent solvent suitable for LC-MS (e.g., 80% methanol). Centrifuge to remove particulates.
- Chromatography: Inject samples onto the LC system. Use a gradient method (e.g., 5-95% acetonitrile in water, both with 0.1% formic acid over 20-30 minutes).
- Mass Spectrometry: Operate in data-dependent acquisition (DDA) mode. Collect high-resolution MS1 spectra (e.g., 70,000 resolution) followed by fragmentation MS2 spectra for the top N most intense ions.
Step 2: Molecular Networking and Scaffold Definition
- Data Conversion: Convert raw MS files to open formats (.mzML, .mzXML).
- Feature Detection: Use software (e.g., MZmine, XCMS) to detect chromatographic peaks, aligning features across samples by m/z and retention time.
- Create Molecular Network: Upload processed data to the GNPS platform. Use the "Classical Molecular Networking" workflow with standard parameters. This clusters MS/MS spectra into "molecular families" or "scaffold clusters" based on spectral similarity, where each cluster represents a related chemical scaffold [6].
Step 4: Rational Library Construction via Iterative Selection
- Algorithmic Selection: Implement a custom script (as described in [6]) that performs the following:
- Calculates the total number of unique scaffold clusters present in the full library.
- Identifies the single extract that contains the highest number of scaffold clusters.
- Selects this extract as the first member of the rational library.
- Identifies the next extract that adds the greatest number of new, unrepresented scaffold clusters to the growing rational library.
- Iterates this process until a pre-defined threshold is met (e.g., 80%, 95%, or 100% of total scaffold diversity).
- Output: The algorithm generates a list of extract IDs constituting the minimal rational library.
Step 5: Validation
- Chemical Validation: Compare the scaffold diversity coverage of the rational library versus randomly selected libraries of the same size.
- Biological Validation: Screen both the full library and the rational minimal library in relevant bioassays (e.g., antimicrobial, enzyme inhibition). Compare hit rates and potency of active extracts [6].
Table 3: Performance Data for Rational Library Minimization (Adapted from [6])
| Metric | Full Library (1,439 extracts) | Rational Library (80% Diversity) | Rational Library (100% Diversity) | Random Selection (50 extracts) |
|---|---|---|---|---|
| Library Size | 1,439 | 50 (28.8-fold reduction) | 216 (6.6-fold reduction) | 50 |
| Scaffold Diversity Achieved | 100% | 80% | 100% | ~80% (average) |
| P. falciparum Hit Rate | 11.26% | 22.00% | 15.74% | 8-14% (interquartile range) |
| T. vaginalis Hit Rate | 7.64% | 18.00% | 12.50% | 4-10% |
| Feature Correlation Retention | Baseline | 80-100% of bioactive features retained | 100% of bioactive features retained | Variable |
Diagram 1: LC-MS/MS Workflow for Rational NP Library Design (Max Width: 760px)
Expanding the Rational Design Toolkit: Fragment-Based and Target-Focused Approaches
Protocol: Generating NP-Derived Fragment Libraries for FBDD
Fragment-Based Drug Design (FBDD) utilizes small molecular fragments (MW < 300 Da) as building blocks. NPs are excellent sources of novel, bioactive fragments [8].
Procedure:
- Source NP Databases: Obtain structures from large, curated NP databases (e.g., COCONUT, LANaPDB) [8].
- Virtual Fragmentation: Apply a retrosynthetic fragmentation algorithm (e.g., RECAP, BRICS) using cheminformatics toolkits (e.g., RDKit). This cleaves molecules at synthetically relevant bonds to generate fragments.
- Filter and Curate: Standardize fragments and filter them using the "Rule of Three" (Ro3) criteria for fragment libraries (MW ≤300, HBD ≤3, HBA ≤3, cLogP ≤3) [8].
- Diversity Analysis: Assess the chemical space coverage of the NP-derived fragment library compared to commercial synthetic fragment libraries using descriptors like molecular weight, polar surface area, and scaffold analysis.
Table 4: Comparison of Fragment Libraries from Different Sources [8]
| Library Source | Total Fragments | Fragments Fulfilling Ro3 | Percentage Ro3 | Key Characteristics |
|---|---|---|---|---|
| COCONUT (NP Database) | ~2.58 million | 38,747 | 1.5% | High structural complexity, novel scaffolds, low Ro3 compliance. |
| LANaPDB (NP Database) | 74,193 | 1,832 | 2.5% | Ethnomedical relevance, region-specific chemistry. |
| CRAFT (Synthetic) | 1,202 | 176 | 14.6% | Designed for synthetic accessibility, focused on new heterocycles. |
| Enamine (Commercial) | 12,496 | 8,386 | 67.1% | High Ro3 compliance, high solubility, designed for screening. |
Integrating Target Identification with Library Design
Modern NP discovery integrates phenotypic screening with rapid target deconvolution. This allows for the construction of mechanism-informed libraries.
Protocol for Target Identification via Chemical Proteomics:
- Phenotypic Hit: Identify an active NP from a rational library screen.
- Probe Synthesis: Derivatize the NP with a clickable handle (e.g., alkyne tag) and a biotin tag for purification, without abolishing its bioactivity.
- Cellular Pull-Down: Incubate the probe with live cells or cell lysates. Use click chemistry to conjugate the probe to its protein targets. Capture the protein-probe complex using streptavidin beads.
- Protein Identification: Digest the captured proteins and identify them via LC-MS/MS-based proteomics. Compare to a control sample (e.g., using a structurally similar inactive probe) to identify specific binding partners.
- Validation: Validate target engagement using cellular thermal shift assays (CETSA), siRNA knockdown, or biophysical methods.
Diagram 2: Target Identification Informing Library Design (Max Width: 760px)
The integration of LC-MS/MS-driven rational library design with fragment-based approaches and target identification represents the frontier of NP research. Future directions include:
- AI-Enabled Integration: Machine learning models that predict bioactive scaffolds from LC-MS/MS data or genomic information (biosynthetic gene clusters) to guide library construction before synthesis or cultivation [1] [9].
- Dynamic Library Design: Libraries designed against specific protein families or disease pathways, enriched with NP fragments known to engage relevant target classes.
- Sustainable Production Pathways: Using the insights from rational design to prioritize NPs for heterologous biosynthesis or total synthesis, addressing supply bottlenecks from the outset [1].
In conclusion, the historical significance of NPs is indisputable. The modern bottlenecks are being decisively addressed by a new paradigm centered on rational library design. LC-MS/MS is the pivotal analytical engine driving this paradigm, enabling the transformation of large, redundant collections into focused, diverse, and mechanism-aware libraries. This approach, detailed in the protocols herein, maximizes the value of nature's chemical innovation and positions NP libraries as a more efficient, sustainable, and powerful foundation for the next generation of drug discovery.
The discovery of novel bioactive molecules from natural sources is a cornerstone of pharmaceutical development, with natural products constituting a significant proportion of approved drugs [6]. However, the initial phase of this process—high-throughput screening (HTS) of vast natural product extract libraries—is fraught with systemic inefficiencies. Conventional screening paradigms are critically hampered by three interconnected issues: pervasive structural redundancy in libraries, prohibitive operational costs, and persistently low bioassay hit rates [6].
This structural redundancy arises because different microbial or plant isolates often produce identical or structurally similar secondary metabolites. Screening thousands of chemically overlapping extracts consumes immense resources while yielding diminishing returns through the frequent "re-discovery" of known compounds [6]. The financial and temporal costs of maintaining, processing, and screening massive libraries are substantial, creating a significant bottleneck for drug discovery campaigns [7]. Consequently, hit rates—the percentage of tested extracts yielding desired bioactivity—often fall to low single digits, making the discovery process inefficient and unpredictable [10].
Within this context, Liquid Chromatography-Tandem Mass Spectrometry (LC-MS/MS) emerges as a pivotal analytical technology for enabling rational library design. By providing a rapid, high-resolution chemical fingerprint of each extract, LC-MS/MS data allows researchers to visualize and quantify library diversity before any biological testing [6]. This application note details how LC-MS/MS-guided strategies directly address the core problems of conventional screening, transforming natural product library design from a numbers game into a rational, evidence-based process that maximizes chemical diversity and bioactive potential while minimizing cost and effort.
Quantitative Analysis of Conventional Screening Limitations
The inefficiencies of conventional, non-guided screening are quantifiable across multiple dimensions. The following table summarizes key comparative data that defines the problem, contrasting full library screening with a rationally designed, LC-MS/MS-guided approach [6] [10].
Table 1: Comparative Performance of Conventional vs. LC-MS/MS-Guided Screening
| Screening Metric | Full Conventional Library (1,439 fungal extracts) | Rational LC-MS/MS Library (80% scaffold diversity, 50 extracts) | Improvement Factor |
|---|---|---|---|
| Library Size (Extracts) | 1,439 | 50 | 28.8-fold reduction |
| Scaffold Diversity Attainment | 100% (baseline) | 80% | Achieved with 3.5% of original samples |
| Hit Rate vs. P. falciparum | 11.26% | 22.00% | 1.95-fold increase |
| Hit Rate vs. T. vaginalis | 7.64% | 18.00% | 2.36-fold increase |
| Hit Rate vs. Neuraminidase | 2.57% | 8.00% | 3.11-fold increase |
| Retention of Bioactivity-Correlated Features | Baseline (e.g., 10 features for P. falciparum) | 8 of 10 features retained (80%) | Minimal loss of high-value candidates |
Table Notes: Data derived from a study screening a library of 1,439 fungal extracts [6]. The rational library was designed to capture 80% of the total MS/MS spectral scaffold diversity. Hit rates for random selection of 50 extracts were significantly lower (e.g., 8-14% for P. falciparum), demonstrating the non-serendipitous advantage of the rational method [6].
The data reveals a profound inefficiency: a full library of 1,439 extracts is necessary to capture 100% of chemical scaffolds, but 80% of that total diversity can be represented by a mere 50 carefully selected extracts [6]. This extreme redundancy directly translates to wasted screening capacity. Furthermore, the increased hit rates across varied assay types (phenotypic and target-based) prove that rational selection does not merely shrink the library but actively enriches it for bioactive potential, likely by filtering out redundant, inactive chemistry [6].
Detailed Experimental Protocols
Protocol 1: LC-MS/MS-Based Library Reduction and Rational Design
This protocol describes the construction of a minimal, chemically diverse natural product library from a larger collection of crude extracts, using untargeted LC-MS/MS and molecular networking.
I. Sample Preparation and Data Acquisition
- Extract Preparation: Prepare crude organic extracts (e.g., using ethyl acetate or methanol) from microbial cultures or plant material. Standardize dry weight and reconstitution volume to ensure consistency [7].
- LC-MS/MS Analysis:
- Chromatography: Use a reverse-phase C18 column. Employ a gradient elution (e.g., 5% to 100% acetonitrile in water, both modifiers containing 0.1% formic acid) over 20-30 minutes.
- Mass Spectrometry: Operate the mass spectrometer in data-dependent acquisition (DDA) mode. Full MS1 scans (e.g., m/z 100-1500) are followed by fragmentation (MS2) of the most intense ions. Use positive and/or negative electrospray ionization (ESI) modes.
II. Data Processing and Molecular Networking
- Convert Raw Data: Process .raw or .d files into open formats (.mzML, .mzXML) using tools like MSConvert (ProteoWizard).
- Feature Detection and Alignment: Use MZmine3 or similar software to detect chromatographic peaks, align across samples, and deisotope.
- Create Molecular Network: Upload the processed MS2 data (as .mgf files) to the Global Natural Products Social Molecular Networking (GNPS) platform.
- Parameters: Set precursor and fragment ion mass tolerance (e.g., 0.02 Da). Use a cosine score threshold (e.g., 0.7) and minimum matched fragment ions (e.g., 6) to define spectral similarity edges [6].
- Cluster to Define Scaffolds: In the resulting network, nodes represent consensus MS/MS spectra, and edges connect spectra with high similarity. Each connected cluster of nodes is operationally defined as a unique molecular "scaffold" or scaffold family [6].
III. Rational Library Selection Algorithm
- Create Sample-Scaffold Matrix: Generate a binary matrix where rows are samples (extracts) and columns are scaffolds (GNPS clusters). An entry is
1if a scaffold is detected in a sample. - Iterative Selection:
- Step 1: Select the extract containing the greatest number of unique scaffolds.
- Step 2: Add the extract that contributes the largest number of scaffolds not already present in the selected library.
- Step 3: Repeat Step 2 until a pre-defined diversity threshold is met (e.g., 80%, 95%, or 100% of all scaffolds in the full collection) [6].
- Output: The final list of selected extracts constitutes the rationally minimized library, optimized for scaffold diversity.
Protocol 2: Virtual Screening for Targeted Hit Enhancement
This computational protocol can be integrated following rational library design to prioritize specific compounds within selected extracts for isolation and testing [11].
I. Protein Target Preparation
- Obtain 3D Structure: Source a high-resolution crystal structure of the target protein from the Protein Data Bank (PDB). Prefer structures co-crystallized with a native ligand.
- Prepare Structure: Using software like Schrödinger's Protein Preparation Wizard or UCSF Chimera:
- Add missing hydrogen atoms.
- Assign protonation states for amino acid residues (e.g., using PROPKA) [11].
- Optimize hydrogen bond networks.
- Remove crystallographic water molecules not involved in key binding interactions.
- Perform restrained energy minimization to relieve steric clashes.
II. Library Preparation for Docking
- Compound Curation: From the LC-MS/MS analysis of rational library extracts, generate a list of putative compounds identified via database matching (e.g., against GNPS libraries).
- Ligand Preparation: For each compound, generate plausible 3D conformations.
- Assign correct bond orders and formal charges.
- Generate accessible tautomeric and stereoisomeric states.
- Perform conformational sampling to obtain low-energy 3D structures.
III. Molecular Docking and Hit Prioritization
- Define Binding Site: Delineate the binding pocket on the prepared protein, typically centered on the co-crystallized ligand's location.
- Perform Docking: Use programs like AutoDock Vina, Glide, or GOLD to dock each prepared ligand into the binding site.
- The algorithm searches translational, rotational, and conformational space to find optimal binding poses.
- Scoring and Ranking: The docking score (an estimated binding affinity) is calculated for each pose. Rank all docked compounds by their best score.
- Post-Processing and Visualization:
- Visually inspect top-ranking poses for sensible binding interactions (hydrogen bonds, hydrophobic contacts, etc.).
- Filter out compounds with undesirable chemical properties or poor complementarity.
- The final prioritized list guides the targeted isolation of specific metabolites from the active rational library extracts [11].
The Scientist's Toolkit: Research Reagent Solutions
Table 2: Key Reagents, Software, and Materials for Rational Library Design
| Item Name | Function / Description | Role in Workflow |
|---|---|---|
| LC-MS/MS System | High-resolution tandem mass spectrometer coupled to a UHPLC. Enables separation and fragmentation of complex metabolite mixtures. | Core data generation for chemical profiling [6] [7]. |
| GNPS Platform | Web-based mass spectrometry ecosystem for data sharing, molecular networking, and library search. | Converts raw MS2 data into chemical similarity networks to define scaffolds [6]. |
| MZmine3 / OpenMS | Open-source software for LC-MS data processing: peak detection, alignment, and deconvolution. | Bridges raw instrument data to analyzable feature lists for networking [6]. |
| R or Python Environment | Programming environments with packages for statistical analysis and custom algorithm development. | Executes the iterative library selection algorithm and analyzes results [6]. |
| Compound Databases (e.g., PubChem, COCONUT) | Public repositories of known chemical structures and their properties. | Used for virtual screening library construction and preliminary dereplication [11]. |
| Docking Software (e.g., AutoDock Vina, Glide) | Programs that predict how a small molecule binds to a protein target and estimate binding affinity. | Prioritizes specific compounds from rational libraries for targeted biological testing [11]. |
| Natural Product Extract Library | A physically banked collection of crude or fractionated extracts from diverse biological sources. | The foundational biological material for screening and LC-MS/MS analysis [7]. |
Visualizing the Workflow and Strategy
LC-MS/MS Workflow for Rational Natural Product Library Design
Integrated Strategy Combining Rational Library Design & Virtual Screening
1. Introduction and Thesis Context
Within the broader thesis on LC-MS/MS for rational natural product (NP) library design, a central challenge is efficiently navigating vast chemical spaces. While LC-MS/MS (Liquid Chromatography-Tandem Mass Spectrometry) enables high-throughput profiling of complex NP extracts, data interpretation must move beyond mere compound identification. This application note establishes core principles and protocols for linking MS² spectral similarity directly to molecular scaffold diversity. The underlying thesis posits that by quantifying spectral relationships and mapping them to core structural frameworks, researchers can prioritize extracts and fractions enriched in structurally unique scaffolds, thereby designing targeted NP libraries with maximized chemical diversity for biological screening.
2. Core Principles and Data Presentation
The linkage rests on two correlative principles:
Principle 1: Spectral Similarity Metrics Predict Structural Relatedness. High MS² spectral similarity (cosine score > 0.8) often corresponds to shared molecular substructures or stereochemistry variants. Moderate similarity (0.5-0.8) may indicate shared scaffolds with significant decoration differences.
Principle 2: Scaffold Diversity is Quantifiable via Spectral Networks. Clusters within Molecular Networks (e.g., GNPS) primarily contain analogs sharing a core scaffold. The number of distinct, non-connected clusters within a dataset serves as a proxy for scaffold diversity.
Table 1: Quantitative Interpretation of MS² Spectral Cosine Scores and Structural Implications
| Cosine Score Range | Likely Structural Relationship | Typical Scaffold Outcome |
|---|---|---|
| 0.90 – 1.00 | Near-identical or isomer | Same scaffold, identical or very minor modification |
| 0.70 – 0.89 | Close analog, homologue | Same core scaffold with moderate decoration change (e.g., -OH, -CH₃) |
| 0.50 – 0.69 | Shared core structure | Same scaffold with significant peripheral alterations or different glycosylation |
| 0.20 – 0.49 | Potential shared sub-structure | Possibly different scaffolds with a common biogenetic building block |
| < 0.20 | Structurally distinct | Different molecular scaffolds |
Table 2: Scaffold Diversity Metrics from a Hypothetical NP Extract Analysis
| Extract ID | Total Features | Spectral Clusters (≥ 2 members) | Singleton Features | Estimated Scaffold Count | Priority Rank (Diversity) |
|---|---|---|---|---|---|
| NP-Ext-001 | 150 | 12 | 45 | ~57 | 2 |
| NP-Ext-002 | 200 | 25 | 30 | ~55 | 3 |
| NP-Ext-003 | 80 | 5 | 50 | ~55 | 1 |
| NP-Ext-004 | 300 | 40 | 100 | ~140 | 4 |
Estimated Scaffold Count = Number of Clusters + Number of Singletons. Priority assumes the goal is maximum scaffold diversity.
3. Experimental Protocols
Protocol 1: LC-MS/MS Data Acquisition for Molecular Networking
- Sample Prep: Reconstitute NP extract/fraction in MS-grade methanol to ~1 mg/mL. Centrifuge at 14,000 g for 10 min to pellet insoluble.
- LC Method: Reversed-phase C18 column (2.1 x 100 mm, 1.7 µm). Gradient: 5% to 100% acetonitrile (0.1% formic acid) in H₂O (0.1% formic acid) over 18 min, hold 2 min. Flow rate: 0.3 mL/min.
- MS Method (Q-TOF or Orbitrap): Data-Dependent Acquisition (DDA). Full MS scan (m/z 100-1500). Top 20 most intense ions selected for MS/MS per cycle. Collision energy: stepped (e.g., 20, 40, 60 eV). Dynamic exclusion: 15 s.
Protocol 2: Constructing and Analyzing a Spectral Network (GNPS Workflow)
- File Conversion: Convert raw files to .mzML format using MSConvert (ProteoWizard).
- Feature Detection: Use MZmine 3 to detect chromatographic features, align across samples, and gap-fill. Export as .mgf (for MS/MS) and .csv (quantification).
- GNPS Molecular Networking:
- Upload the .mgf file to the GNPS platform (https://gnps.ucsd.edu).
- Create Network Parameters: Set
Precursor Ion Mass Toleranceto 0.02 Da,Fragment Ion Mass Toleranceto 0.02 Da. SetMin Pairs Costo 0.7 (or lower to explore distant relationships). SetNetwork TopKto 10. - Advanced Workflows: Enable
Feature-Based Molecular Networkingby uploading the quantitative .csv table from MZmine. - Submit job.
- Analysis in Cytoscape: Download the network file (.graphml). Visualize using Cytoscape software. Use the
clusterMaker2app to apply community detection algorithms (e.g., Leiden clustering) to formally define clusters. Each major cluster is treated as a putative scaffold family.
Protocol 3: Scaffold Dereplication and Diversity Mapping
- In-Cluster Dereplication: For each cluster, examine node annotations from GNPS library matches. Use the highest-confidence match to propose a core scaffold.
- Singleton Assessment: For singleton features (not connected in the network), perform automated library search (e.g., against NP libraries in SIRIUS or via GNPS) to assign potential scaffolds.
- Diversity Quantification: Tally (a) the number of clusters, (b) the number of annotated unique scaffolds from clusters, and (c) the number of singletons with unique proposed scaffolds. Use this as the scaffold diversity score.
4. Visualizations
Title: LC-MS/MS Scaffold Diversity Analysis Workflow
Title: Linking Spectral Similarity to Scaffolds & Networks
5. The Scientist's Toolkit: Key Research Reagent Solutions
Table 3: Essential Materials for LC-MS/MS-Based Scaffold Diversity Analysis
| Item | Function & Rationale |
|---|---|
| MS-Grade Solvents (Acetonitrile, Methanol, Water with 0.1% Formic Acid) | Ensure minimal background noise, consistent ionization, and prevent instrument fouling. |
| Reversed-Phase UHPLC Column (e.g., C18, 1.7-2.6 µm particle size) | Provides high-resolution chromatographic separation of complex NP mixtures prior to MS injection. |
| Standardized MS Tuning Calibration Solution | Ensures mass accuracy and reproducibility across instrument runs, critical for spectral comparisons. |
| Commercial Natural Product Libraries (e.g., for MS/MS libraries) | Provide reference spectra for initial scaffold dereplication within GNPS or local software. |
| Data Analysis Software Suite (MZmine, GNPS, Cytoscape, SIRIUS) | Open-source tools for the complete workflow from feature detection to network visualization and in-depth annotation. |
| Internal Standard Mixture (e.g., ESI positive/negative ion mix) | Monitors instrument performance and can aid in semi-quantitative comparisons across runs. |
Within the paradigm of rational natural product library design, the primary challenge is navigating the immense chemical redundancy inherent in crude extract libraries to accelerate the discovery of novel bioactive scaffolds. Traditional high-throughput screening of thousands of extracts is resource-intensive and plagued by the frequent rediscovery of known compounds [6]. This thesis posits that liquid chromatography-tandem mass spectrometry (LC-MS/MS), coupled with computational metabolomics, provides a foundational analytical framework to rationally minimize library size, prioritize chemical novelty, and increase bioassay hit rates.
The integration of untargeted metabolomics with molecular networking transitions library design from a process based on random collection or phylogenetic distance to one driven by empirical chemical data [6]. This workflow enables the systematic deconvolution of complex mixtures, clusters metabolites by structural similarity, and allows for the selection of a minimal subset of extracts that maximize scaffold diversity. By focusing on core structural scaffolds—which often correlate with biological activity—this approach addresses the critical bottleneck in natural product-based drug discovery, offering a faster, more cost-effective path to identifying new chemotypes [6].
Foundational Workflow: Principles and Processes
The foundational workflow transforms raw LC-MS/MS data into a rationally designed screening library. It is built on the principle that MS/MS spectral similarity is a robust proxy for structural similarity [6]. The process begins with untargeted LC-MS/MS analysis of a comprehensive natural product extract library, generating fragmentation spectra (MS2) for detectable metabolites.
The core analytical step is performed via the Global Natural Products Social Molecular Networking (GNPS) platform or similar tools [12]. Here, MS2 spectra are compared and clustered based on cosine spectral similarity, forming a molecular network where nodes represent consensus MS2 spectra and edges connect spectra with high similarity [6]. Each cluster, or molecular family, represents a unique chemical scaffold or a group of closely related analogs. This visualization maps the chemical space of the entire library, highlighting both abundant core scaffolds and rare, unique metabolites [12].
The final, rational step is algorithmic library reduction. Custom scripts (e.g., in R) analyze the network to select the most chemically diverse subset of extracts [6]. The algorithm iteratively selects the extract contributing the greatest number of new, unrepresented molecular scaffolds to the subset until a predefined diversity threshold (e.g., 80% or 100% of total scaffolds) is reached [6]. This data-driven curation dramatically reduces library size while strategically retaining chemical diversity and minimizing the loss of putative bioactive constituents.
Application Notes & Detailed Protocols
Protocol: Untargeted LC-MS/MS Analysis of Natural Product Extracts
This protocol is designed for the comprehensive metabolite profiling of microbial or plant extracts prior to molecular networking [13] [12].
Sample Preparation:
- Perform a biphasic extraction on lyophilized biomass. For fungal/bacterial cultures, mix with methanol:acetonitrile (1:1, v/v). For plant material, use chloroform:methanol:water (5:2.5:2.5, v/v/v) [13] [12].
- Vortex vigorously for 1 minute, then sonicate for 20 minutes at room temperature.
- Centrifuge at 4,000-5,000 x g for 10 minutes to pellet debris [12].
- Filter the supernatant through a 0.22 µm PTFE syringe filter [12].
- Transfer filtrate to an LC-MS vial. Include procedural blanks, solvent blanks, and a positive control extract from a known producer strain for quality control [13].
Instrumentation & Data Acquisition:
- System: Employ a UHPLC system coupled to a high-resolution tandem mass spectrometer (e.g., Q-TOF, Orbitrap).
- Chromatography: Use a reversed-phase C18 column (e.g., 100 x 2.1 mm, 1.7-2.6 µm). Maintain column at 30-40°C. The mobile phase consists of (A) water with 0.1% formic acid and (B) acetonitrile with 0.1% formic acid [12].
- Gradient: Apply a linear gradient from 3% B to 97% B over 15-20 minutes, followed by a wash and re-equilibration [12].
- Mass Spectrometry: Acquire data in data-dependent acquisition (DDA) mode. Collect full scan MS1 data (e.g., m/z 80-1500) in positive and/or negative electrospray ionization mode. Automatically select the top N most intense ions from each MS1 scan for fragmentation to generate MS2 spectra. Use a stepped collision energy (e.g., 20, 40, 60 eV) to capture diverse fragment ions [12].
Protocol: Molecular Networking and Rational Library Curation
This protocol details the computational workflow for creating molecular networks and deriving a minimal diverse library [6] [12].
Data Preprocessing & Feature Detection:
- Convert raw instrument files (.d, .raw) to open formats (.mzML, .mzXML) using vendor or open-source software (e.g., MSConvert, ProteoWizard).
- Process data with feature detection tools like MZmine3, MS-DIAL, or the GNPS feature-based molecular networking (FBMN) workflow [14]. Steps include peak picking, chromatographic alignment, and isotope/adduct grouping.
- Export two files: a feature intensity table (CSV) and an MS2 spectral file (.mgf).
Molecular Networking on GNPS:
- Upload the .mgf file to the GNPS platform .
- Create Job: Use the "Molecular Networking" workflow.
- Set Parameters: A cosine score threshold of 0.7, minimum matched peaks of 6, and a maximum precursor mass difference of 500 Da are common starting points. Enable advanced network topologies like "MS2DeepScore" for improved similarity scoring [15].
- Run Job and Visualize: Execute the job and visualize the resulting network using Cytoscape or the GNPS in-browser viewer. Networks are interactive, allowing exploration of spectral matches to public libraries.
Rational Library Curation:
- Map the feature intensity table back to the network to link clusters (scaffolds) to their source extracts.
- Apply a custom diversity-selection algorithm [6]. The algorithm logic is:
- Input: A list of extracts, each annotated with the unique molecular scaffold clusters it contains.
- Process: Iteratively select the extract that adds the largest number of scaffolds not yet present in the growing "rational library" subset.
- Termination: Stop when the subset contains a user-defined percentage (e.g., 80%, 95%, 100%) of all unique scaffolds detected in the full library.
- The output is a ranked list of extracts constituting the minimal, maximally diverse screening library.
Performance Validation: Bioactivity Retention
To validate that rational library reduction does not discard bioactive potential, follow this bioactivity correlation analysis [6].
- Bioassay: Perform target-based or phenotypic bioassays on the full library of extracts. Record dose-response or inhibition data.
- Statistical Integration: Correlate the abundance of each LC-MS feature (from the intensity table) with bioactivity scores across all extracts using non-parametric tests (e.g., Spearman correlation).
- Identify Bioactive Features: Select features with a significant correlation (e.g., ρ > 0.5, p < 0.05 after FDR correction) as putatively bioactive [6].
- Track Retention: Check which of these significant bioactive features are present in the extracts of the curated rational library. High retention rates (e.g., 8 out of 10 features) confirm the method's efficacy [6].
Table 1: Performance Metrics of Rational Library Reduction (Example Data from a 1,439-Extract Fungal Library) [6]
| Scaffold Diversity Target | Extracts in Rational Library | Fold Reduction vs. Full Library | Bioassay Hit Rate (%) |
|---|---|---|---|
| Full Library (Baseline) | 1,439 | 1x | 11.3% (P. falciparum) |
| 80% Diversity | 50 | 28.8x | 22.0% (P. falciparum) |
| 100% Diversity | 216 | 6.6x | 15.7% (P. falciparum) |
Table 2: Retention of Bioactivity-Correlated Metabolites in Rational Libraries [6]
| Bioassay Target | Significant Features in Full Library | Retained in 80% Diversity Library | Retained in 100% Diversity Library |
|---|---|---|---|
| Plasmodium falciparum | 10 | 8 | 10 |
| Trichomonas vaginalis | 5 | 5 | 5 |
| Influenza Neuraminidase | 17 | 16 | 17 |
Workflow and Pathway Visualization
Figure 1. Foundational LC-MS/MS Workflow for Rational NP Library Design
Figure 2. Information Extraction from a Molecular Network for Library Curation
The Scientist's Toolkit: Essential Research Reagents & Materials
Table 3: Essential Reagents, Software, and Databases for the Workflow
| Category | Item/Resource | Function in Workflow | Key Notes |
|---|---|---|---|
| Sample Prep | Methanol, Acetonitrile, Chloroform (HPLC/MS grade) | Solvents for comprehensive metabolite extraction from biological matrices [13] [12]. | Use high-purity solvents to minimize MS background noise. |
| Sample Prep | PTFE Syringe Filters (0.22 µm) | Clarification of crude extracts prior to LC-MS injection to prevent column clogging [12]. | Essential for reproducible chromatography. |
| LC-MS | Reversed-Phase C18 UHPLC Column | Chromatographic separation of complex metabolite mixtures [12]. | Core column chemistry for broad natural product coverage. |
| LC-MS | Formic Acid (LC-MS grade) | Mobile phase additive for improved ionization efficiency in electrospray MS [12]. | Typically used at 0.1% concentration. |
| Data Analysis | GNPS (Global Natural Products Social) | Web platform for performing molecular networking, spectral library search, and community sharing [6] [12]. | Foundational, freely available tool for MS/MS analysis. |
| Data Analysis | MZmine3 / MS-DIAL | Open-source software for LC-MS data preprocessing: peak detection, alignment, filtering, and export for GNPS [14]. | Critical for converting raw data into analyzable feature lists. |
| Data Analysis | Cytoscape | Network visualization and analysis software. Used to explore, customize, and interpret molecular networks from GNPS. | Enables advanced network topology and metadata analysis. |
| Data Analysis | MetaboAnalyst | Web-based platform for comprehensive statistical analysis, functional interpretation, and integration of metabolomics data [16]. | Useful for PCA, biomarker analysis, and pathway enrichment post-discovery. |
| Database | GNPS Spectral Libraries | Curated libraries of reference MS2 spectra (e.g., GNPS, NIST, MassBank) for metabolite annotation [15]. | Enables dereplication and putative identification of known compounds. |
| Database | Internal Standard Compounds | Stable isotope-labeled analogs of key metabolites. Used for retention time alignment and semi-quantification in MS1-based workflows. | Mitigates issues from instrumental drift; improves data quality [15]. |
Within the context of rational natural product library design using Liquid Chromatography-Tandem Mass Spectrometry (LC-MS/MS), a fundamental paradigm shift is gaining traction: prioritizing molecular scaffolds over individual molecules. This approach is rooted in the principle that a compound's core structural framework, rather than its peripheral substituents, is the primary determinant of its biological activity [17]. Scaffolds, defined as the core ring systems and linkers remaining after removal of all side chains, serve as blueprints for families of compounds [17] [18].
In natural product research, where chemical redundancy across extracts is a major bottleneck, this scaffold-centric view offers a powerful strategy for library optimization [6]. High-throughput screening of large, unfocused natural product libraries is hampered by structural redundancy, leading to the frequent rediscovery of known bioactive compounds and exorbitant costs [6] [19]. By using LC-MS/MS to profile extracts based on their scaffold diversity, researchers can rationally design minimal libraries that maximize chemical space coverage and bioactive potential while drastically reducing the number of samples to screen [6] [7]. This method directly addresses the challenge of focusing limited resources on the most promising chemical matter, accelerating the journey from screening to lead identification.
Conceptual and Technical Foundations
The scaffold-based approach is supported by well-established concepts in medicinal chemistry and enabled by modern analytical and computational technologies.
Scaffold Hopping and Activity Landscapes: The activity landscape of a biological target encompasses the relationship between chemical structure and potency [18]. Two key features are scaffold hops and activity cliffs. A scaffold hop occurs when two compounds with distinct core structures exhibit similar potency against the same target, demonstrating that bioactivity can be maintained across different scaffolds [20] [18]. Conversely, an activity cliff describes two structurally similar compounds (sharing the same scaffold) that show a large difference in potency, highlighting critical structure-activity relationship (SAR) determinants [18]. A scaffold-focused library design aims to enrich for scaffolds capable of productive hopping, thereby increasing the chances of identifying novel bioactive chemotypes.
The Role of LC-MS/MS and Molecular Networking: LC-MS/MS is the enabling technology for implementing scaffold-based library design from complex natural extracts. Untargeted LC-MS/MS analysis generates fragmentation spectra (MS/MS) for the metabolites in an extract. These spectra are processed through molecular networking platforms like GNPS (Global Natural Products Social Molecular Networking), which clusters MS/MS spectra based on similarity [6] [19]. Each cluster, or molecular family, is presumed to originate from compounds sharing a common scaffold or closely related structures. Thus, the network serves as a proxy for scaffold diversity, allowing researchers to quantify and prioritize extracts based on the unique scaffolds they contain rather than the total number of molecules [6].
Application Notes & Quantitative Outcomes
Applying the scaffold-centric method to a library of 1,439 fungal extracts demonstrates its significant advantages [6] [19]. The process involves constructing a molecular network from LC-MS/MS data and then algorithmically selecting the subset of extracts that cumulatively capture the maximum number of scaffold clusters.
Table 1: Library Size Reduction and Efficiency Gains Using Scaffold-Centric Selection
| Metric | Full Library (1,439 extracts) | 80% Scaffold Diversity Library | 100% Scaffold Diversity Library |
|---|---|---|---|
| Number of Extracts | 1,439 | 50 | 216 |
| Library Size Reduction | Baseline | 28.8-fold (to 3.5% of original) | 6.6-fold (to 15% of original) [6] |
| Extracts Needed for 80% Diversity (vs. Random) | N/A | 50 (Method) vs. 109 (Random Avg.) [6] | N/A |
The most critical validation is whether this dramatic downsizing retains or even enriches bioactive potential. Testing against diverse targets (a phenotypic assay for the parasite Plasmodium falciparum and an enzyme assay for influenza neuraminidase) confirmed superior performance.
Table 2: Enhanced Bioassay Hit Rates in Rationally Designed Scaffold Libraries
| Bioassay Target | Hit Rate: Full Library | Hit Rate: 80% Diversity Library | Hit Rate: 100% Diversity Library | Hit Rate Range: 50 Random Extracts |
|---|---|---|---|---|
| Plasmodium falciparum | 11.26% | 22.00% | 15.74% | 8.00 – 14.00% [6] |
| Influenza Neuraminidase | 2.57% | 8.00% | 5.09% | 0.00 – 2.00% [6] |
Furthermore, analysis of MS features statistically correlated with bioactivity in the full library showed that the minimized libraries retained the vast majority of these putative bioactive molecules [19].
Table 3: Retention of Bioactivity-Correlated Molecular Features
| Bioassay Target | Features Correlated in Full Library | Retained in 80% Diversity Library | Retained in 100% Diversity Library |
|---|---|---|---|
| Plasmodium falciparum | 10 | 8 | 10 [6] |
| Influenza Neuraminidase | 17 | 16 | 17 [6] |
Detailed Experimental Protocols
Protocol 1: LC-MS/MS-Based Scaffold Diversity Analysis for Library Rationalization
This protocol details the steps to create a scaffold-focused minimal library from a crude natural extract collection [6] [19].
Sample Preparation & Data Acquisition:
- Prepare crude organic extracts from microbial or plant material. Standardize dry weight and solvent for resuspension (e.g., 1 mg/mL in methanol) [19].
- Acquire untargeted LC-MS/MS data on a high-resolution tandem mass spectrometer. Use reversed-phase chromatography (e.g., C18 column) with a water/acetonitrile gradient. Collect data in data-dependent acquisition (DDA) mode, fragmenting top ions in each cycle.
Data Processing & Molecular Networking:
- Convert raw data to open formats (e.g., .mzML). Process using MZmine or similar software for feature detection, alignment, and deisotoping.
- Export MS/MS spectra in .mgf format. Submit to the GNPS platform (https://gnps.ucsd.edu) for Classical Molecular Networking analysis.
- Use standard GNPS parameters: precursor ion mass tolerance 2.0 Da, fragment ion tolerance 0.5 Da, minimum cosine score for network edges of 0.7. The resulting network clusters represent groups of compounds with similar MS/MS spectra, inferring shared scaffolds.
Scaffold-Centric Library Design:
- Download the network clustering information (e.g.,
.clustersummaryfile from GNPS). - Execute a custom R algorithm (as described in [6]): a. Create a binary matrix where rows are extracts and columns are scaffold clusters (nodes from GNPS). b. Select the first extract containing the highest number of unique scaffold clusters. c. Iteratively add the extract that contains the greatest number of scaffold clusters not yet represented in the selected library set. d. Continue until a user-defined threshold of total scaffold diversity is captured (e.g., 80%, 95%, 100%).
- Download the network clustering information (e.g.,
Validation:
- Test the bioactivity of the rationally selected minimal library against relevant targets and compare hit rates to the full library and randomly selected subsets of equal size [6].
- Perform statistical correlation (e.g., Pearson or Spearman) between MS1 feature abundance and bioassay activity scores across the full library to identify putative bioactive metabolites. Verify the retention of these features in the minimal library.
Protocol 2: Integrating Scaffold-Based Design for Targeted Drug Delivery Systems
This protocol outlines the development of a biomaterial scaffold for localized, sustained drug delivery, exemplifying the broader bioactive potential of the scaffold concept in a therapeutic context [21] [22].
Material Selection & Formulation:
- Polymer Choice: Select a biodegradable, biocompatible polymer suitable for the application. Common choices include synthetic poly(lactic-co-glycolic acid) (PLGA) for tunable degradation or natural polymers like collagen or chitosan for enhanced biocompatibility [21] [22].
- Drug Loading: Incorporate the therapeutic agent (e.g., chemotherapeutic like paclitaxel, growth factor) into the polymer matrix. This can be achieved via:
- Blending: Dissolve or disperse the drug homogenously within the polymer solution prior to scaffold fabrication.
- Coating: Adsorb or covalently attach the drug to the surface of a pre-formed scaffold.
- Encapsulation: Use double-emulsion methods to create drug-loaded microspheres, which are then formed into a scaffold.
Scaffold Fabrication:
- Electrospinning: Prepare a polymer-drug solution with appropriate viscosity. Use a high-voltage electric field to draw fibers onto a collector, creating a nanofibrous mat with high surface area for cell interaction and drug release [22].
- 3D Printing (Bioprinting): Utilize fused deposition modeling (FDM) of polymer filaments or stereolithography (SLA) of photo-curable resin-polymer blends to create scaffolds with precise, reproducible architecture and porosity [22].
- Porogen Leaching: Mix polymer solution with a porogen (e.g., salt crystals, sugar), cast into a mold, solidify, and then immerse in water to leach out the porogen, leaving a porous structure.
Characterization & Release Kinetics:
- Characterize scaffold morphology using scanning electron microscopy (SEM). Measure porosity and pore size distribution.
- Perform in vitro drug release studies by incubating the scaffold in phosphate-buffered saline (PBS) at 37°C under sink conditions. Sample the release medium at periodic intervals and quantify drug concentration using HPLC-UV or LC-MS/MS. Fit the release data to models (e.g., Higuchi, Korsmeyer-Peppas) to understand the release mechanism.
Biological Evaluation:
- Assess cytocompatibility with relevant cell lines (e.g., osteoblasts for bone scaffolds) using assays for viability (MTT/AlamarBlue) and proliferation.
- For anti-cancer applications (e.g., oral cancer), test efficacy using cancer cell lines. Measure cytotoxicity (IC50), apoptosis induction, and inhibition of cell migration/invasion [21].
Visualizing Pathways and Workflows
Diagram 1: LC-MS/MS Workflow for Scaffold-Based Library Design (100 chars)
Diagram 2: Scaffold-Based Drug Design & Delivery Pathways (99 chars)
Diagram 3: Scaffolds in Activity Landscape Analysis (96 chars)
The Scientist's Toolkit: Research Reagent Solutions
Table 4: Essential Materials & Tools for Scaffold-Centric Research
| Category | Item / Solution | Function & Relevance |
|---|---|---|
| Analytical Core | High-Resolution LC-MS/MS System (e.g., Q-TOF, Orbitrap) | Acquires precise mass and fragmentation data for untargeted metabolomics and scaffold characterization [6] [23]. |
| GNPS (Global Natural Products Social Molecular Networking) Platform | Cloud-based platform for processing MS/MS data to create molecular networks, where clusters represent scaffold families [6] [19]. | |
| Informatics & Software | Custom R/Python Scripts for Library Rationalization | Implements the iterative algorithm to select extracts maximizing scaffold diversity [6]. |
| Scaffold Hopping Software (e.g., FTrees, ReCore, SeeSAR) | Computational tools for identifying novel core structures that maintain target pharmacophore geometry, enabling lead optimization [20]. | |
| Biomaterial Scaffolds | Biodegradable Polymer (e.g., PLGA, PCL, Chitosan) | Forms the matrix for drug delivery scaffolds; provides structural support and controlled drug release kinetics [21] [22]. |
| Electrospinning Apparatus or 3D Bioprinter | Fabricates scaffolds with defined nano/micro-architecture (fibers, pores) crucial for cell interaction and tailored drug release profiles [22]. | |
| Biological Assays | Target-Specific Phenotypic & Biochemical Assays | Validates the bioactive potential of scaffold-focused libraries and measures the efficacy of scaffold-based delivery systems (e.g., cytotoxicity, enzyme inhibition) [6]. |
| Cell Lines & 3D Tissue Models | Provides biologically relevant systems for testing scaffold biocompatibility, drug efficacy, and localized delivery performance [21]. |
A Step-by-Step Pipeline: Building Your Rational NP Library with LC-MS/MS and Molecular Networking
Natural products (NPs) and their inspired analogues are a cornerstone of drug discovery, representing a significant fraction of approved therapeutics [24]. The core objective of rational NP library design is to systematically explore the biologically relevant chemical space surrounding guiding NPs to discover new bioactive compounds with optimized properties [24]. This discovery process hinges on the reliable and comprehensive characterization of complex synthetic and natural mixtures, a task for which untargeted liquid chromatography-tandem mass spectrometry (LC-MS/MS) is an indispensable platform.
Untargeted LC-MS/MS provides the high sensitivity, specificity, and broad metabolite detection capabilities required to profile the diverse and often novel chemical entities within NP-inspired libraries [25]. The quality of this chemical data directly influences downstream decisions in library design—guiding synthetic iterations, informing structure-activity relationships (SAR), and prioritizing leads. Therefore, establishing a robust, reproducible, and optimized workflow for sample preparation and data acquisition is the critical first phase in any NP research pipeline. This protocol details the standardized procedures and quality control (QC) frameworks necessary to generate high-fidelity untargeted LC-MS/MS data, ensuring that subsequent phases of library analysis and design are built on a foundation of reliable analytical science.
Comprehensive Sample Preparation Protocols
Proper sample preparation is paramount to minimizing analytical variance and ensuring the LC-MS/MS system accurately reflects the sample's true chemical composition. The protocol must be tailored to the sample matrix (e.g., microbial fermentation broth, plant extract, synthetic reaction mixture) and the desired chemical space (e.g., polar metabolites, mid-polar natural product scaffolds, lipids).
Protocol: Automated Biphasic Extraction for High-Throughput Analysis
For high-throughput profiling of NP libraries, which may contain hundreds to thousands of samples, automation and speed are essential without sacrificing comprehensiveness. An optimized biphasic extraction allows for the simultaneous recovery of a wide range of metabolites and lipids [26].
- Materials: Automated liquid handler (e.g., Agilent Bravo with 384ST head), 384-well plates, methanol (MeOH), methyl tert-butyl ether (MTBE), water (H₂O), internal standard mix.
- Procedure:
- Sample Transfer: Aliquot 20 µL of sample (e.g., plasma, cell lysate, or a concentrated NP library fraction in appropriate solvent) into designated wells of a 384-well plate.
- Protein Precipitation & Lipid Extraction: Using the liquid handler, add 225 µL of chilled MeOH:MTBE (1:3, v/v) to each well. Seal the plate and mix vigorously for 10 minutes.
- Phase Separation: Add 750 µL of MTBE and 188 µL of H₂O to induce biphasic separation. Mix and then centrifuge the plate (1000 × g, 10 min, 4°C).
- Phase Collection (Lipid-Rich Phase): The automated system transfers the upper organic (MTBE) phase, rich in non-polar lipids, to a new collection plate.
- Solvent Polarity Switching & Polar Phase Collection: The lower aqueous layer is subjected to a polarity switch, typically through addition of a polar organic solvent, and the resulting polar metabolite-enriched phase is collected into a separate plate.
- Concentration & Reconstitution: Dry collected fractions under a gentle stream of nitrogen or by centrifugal evaporation. Reconstitute the lipid fraction in an isopropanol:acetonitrile mixture (e.g., 1:1) and the polar metabolite fraction in H₂O:acetonitrile (e.g., 95:5) for LC-MS analysis.
Protocol: Solid-Phase Microextraction (SPME) for Sensitive Nanoflow LC-MS
When sample amounts are limited (e.g., rare natural product isolates or microscale library synthesis) or when integrating metabolomics with proteomics from the same sample, a nanoflow LC-MS (nLC-MS) approach with SPME cleanup is advantageous for enhanced sensitivity [27].
- Materials: 96-blade SPME system, C18 or mixed-mode SPME blades, nanoflow LC system coupled to high-resolution MS, loading solvent (e.g., 0.1% formic acid in H₂O).
- Procedure:
- SPME Blade Conditioning: Condition the C18-coated SPME blades by sequential immersion in methanol, isopropanol, and finally loading solvent.
- Metabolite Binding: Load the prepared sample onto the SPME blade by immersion or static contact for a defined period (e.g., 30-60 min), allowing metabolites to bind to the stationary phase.
- Washing: Briefly rinse the blade with loading solvent to remove salts and non-specifically bound matrix components.
- Elution & Injection: Elute bound metabolites directly into the nLC column using the MS ionization solvent (e.g., 80% acetonitrile, 0.1% formic acid). This on-blade elution serves as the injection for the nLC-MS run.
- Dual Omics Analysis: Following the metabolomics run, the same sample lysate (or a separate aliquot) can be processed for proteomics using standard proteolytic digestion, with both data streams acquired on the same nLC-MS platform for integrated analysis [27].
Table 1: Comparison of Sample Preparation Protocols for NP Library Analysis
| Protocol | Best For | Key Advantage | Throughput | Primary Reference |
|---|---|---|---|---|
| Automated Biphasic Extraction | High-throughput screening of diverse chemical space; Lipidomics & Metabolomics. | Simultaneous, reproducible extraction of polar and non-polar compounds; minimal human error. | Very High (384-well format) | [26] |
| SPME for nLC-MS | Limited/rare samples; Metabo-proteomics integration; Sensitivity-critical applications. | Analyte cleaning and enrichment; prevents column blockage; enhances ionization. | Medium (96-blade format) | [27] |
Optimized Untargeted LC-MS/MS Data Acquisition Strategies
The acquisition mode fundamentally determines the depth, quality, and reproducibility of the untargeted data. A systematic comparison of modern strategies is crucial for rational selection.
Protocol: System Suitability Testing (SST) and Acquisition Mode Selection
Prior to analyzing valuable NP library samples, SST ensures the entire LC-MS system is performing optimally. This protocol uses a standard mixture of known compounds relevant to the expected chemical space (e.g., eicosanoids for oxidative metabolites, a set of diverse natural products) [28].
- Materials: Eicosanoid or NP Standard Mix (14 compounds recommended), bovine liver total lipid extract (TLE) or other complex matrix, C18 or equivalent LC column, HRAM mass spectrometer (e.g., Orbitrap Exploris).
- Procedure:
- SST Sample Preparation: Spike the standard mixture at a defined concentration (e.g., 10 ng/mL) into the complex matrix (TLE). This simulates the challenge of detecting analytes in a real NP library background.
- Chromatographic Optimization: Develop and refine a short, robust gradient (e.g., 4-8 minutes) on a core-shell column that adequately separates the standard compounds.
- Acquisition Comparison: Analyze the SST sample in triplicate over multiple days using different acquisition modes:
- Data-Dependent Acquisition (DDA): Acquires MS/MS spectra for the most intense precursor ions in each MS1 scan.
- Data-Independent Acquisition (DIA): Fragments all precursors within sequential, wide m/z windows (e.g., 25 Da).
- AcquireX/Iterative DDA: Uses a built-in exclusion list from prior runs to target lower abundance ions in subsequent injections.
- Performance Metrics: Evaluate the number of detected features, reproducibility (Coefficient of Variance, CV%), and identification consistency across runs. Based on this data, select the optimal mode for the main study.
Table 2: Quantitative Performance Comparison of LC-MS/MS Acquisition Modes [28]
| Acquisition Mode | Avg. Features Detected | Reproducibility (CV%) | ID Consistency (Day-to-Day Overlap) | Best Application in NP Research |
|---|---|---|---|---|
| Data-Independent Acquisition (DIA) | ~1036 | 10% | 61% | Comprehensive, reproducible profiling of complex, unknown libraries. |
| Data-Dependent Acquisition (DDA) | ~850 (18% fewer) | 17% | 43% | Traditional discovery; good for abundant, novel ions. |
| AcquireX / Iterative DDA | ~653 (37% fewer) | 15% | 50% | Deep mining of low-abundance ions in follow-up studies. |
Note: Data based on a study of eicosanoids in a lipid matrix; relative performance is indicative.
Optimized LC-MS Parameters for NP-Like Compounds
NP-like compounds often possess higher fractions of sp³-hybridized carbons (Fsp³) and increased stereochemical complexity compared to typical synthetic drugs [24]. This influences optimal LC-MS conditions.
- Chromatography:
- Column: Core-shell C18 or C8 columns (e.g., Kinetex) for fast, efficient separations. Use HILIC for highly polar NPs [26] [28].
- Gradient: Fast, shallow gradients (e.g., 5-15% to 95-100% organic over 4-8 minutes) are suitable for high-throughput screening [26]. For deeper analysis, longer gradients (15-25 minutes) on UHPLC systems provide better separation of isomers common in NPs.
- Mass Spectrometry:
- Ionization: Heated Electrospray Ionization (HESI) in both positive and negative modes is essential for broad coverage.
- MS1 Resolution: ≥ 60,000 (at 200 m/z) for accurate mass measurement and formula assignment of unknown NPs.
- MS2 Fragmentation: Higher-energy collisional dissociation (HCD) with stepped normalized collision energies (e.g., 20, 40, 60 eV) to generate informative fragmentation spectra across different compound classes.
Integrated Quality Control (QC) Framework
Implementing a rigorous QC framework is non-negotiable for generating reliable data. The use of pooled QC samples is a widely adopted best practice [25].
Protocol: Generation and Use of Pooled QC Samples
A pooled QC sample acts as a technical replicate that monitors system stability throughout the run sequence [25].
- Generation: After initial sample preparation, combine an equal-volume aliquot from every study sample (including all NP library members and controls) into a single vial. This creates a sample that is chemically representative of the entire experiment.
- Injection Scheme: Inject the pooled QC sample at the beginning of the sequence for system conditioning (≥5 injections). Subsequently, inject it periodically throughout the batch (e.g., after every 6-10 experimental samples).
- Data Utilization:
- Monitoring: Plot the total ion chromatogram (TIC) base peak intensity and retention time of key features from the pooled QC injections. This visualizes instrumental drift.
- Correction: Use statistical algorithms (e.g., robust locally estimated scatterplot smoothing - RLOESS) to correct for systematic drift in feature intensity across the batch based on the pooled QC measurements.
- Filtering: Remove metabolic features that show excessive variation (e.g., relative standard deviation >20-30%) in the pooled QC samples from downstream analysis, as they are analytically unreliable.
Data Visualization and Real-Time QC Monitoring
Advanced visualization tools are critical for moving from opaque "black box" data acquisition to transparent, real-time quality assessment [29].
Protocol: Implementing a Real-Time QC Dashboard
An open-source dashboard allows for interactive monitoring of key instrument and data quality parameters during acquisition [30].
- Toolkit Setup: Develop or implement a Python-based parsing tool that automatically extracts metadata (e.g., total ion current, pressure, injection counts) and QC sample results from the raw data files (e.g., .raw, .d) or intermediate .mzML files after each batch [30].
- Database Creation: Store parsed data in a relational database with tables for instrument runs, QC compounds, and performance metrics.
- Visualization Modules: Create a web-based dashboard with interactive modules:
- Trend Lines: Plot QC standard intensity and retention time across all historical runs.
- Histograms: Display the distribution of QC metrics (e.g., CV%) to identify outliers.
- 2D "Virtual Gel" Views: Implement streaming visualization of LC-MS data surfaces (RT vs. m/z) to quickly inspect chromatographic quality and peak shapes for pooled QC samples [29].
- Proactive Action: Use the dashboard to set alert thresholds. A drift in QC metrics triggers preventative maintenance, reducing instrument downtime.
The Scientist's Toolkit: Essential Materials for NP LC-MS Workflows
- Automated Liquid Handler (e.g., Agilent Bravo): Enables reproducible, high-throughput sample preparation in 96- or 384-well format, minimizing human error and variability [26].
- Core-Shell UHPLC Columns (C8, C18, HILIC): Provides fast, high-efficiency separations essential for resolving complex NP mixtures. The C8 phase is particularly useful for a broad range of mid-polar NPs [26] [28].
- High-Resolution Accurate Mass Spectrometer (Orbitrap/Q-TOF): Delivers the mass accuracy and resolution required for confident molecular formula assignment of unknown NPs and their library analogues.
- Pooled QC Sample: The single most important QC material. Serves as a stable, representative reference for monitoring and correcting analytical drift throughout long sequences [25].
- System Suitability Test (SST) Mix: A standardized cocktail of known compounds (e.g., eicosanoids) used to verify instrument sensitivity, chromatography, and reproducibility before analyzing valuable NP library samples [28].
- SPME Blades (for nLC-MS): Allows for clean-up, concentration, and direct injection of precious samples, enhancing sensitivity and protecting nanoflow columns from blockage [27].
- Open-Source Visualization Software (e.g., seaMass, custom Python dashboards): Critical tools for interactive, streaming visualization of raw data quality and real-time instrument performance monitoring, moving beyond static reports [29] [30].
Within the research framework of LC-MS/MS for rational natural product library design, the generation of molecular networks via the Global Natural Products Social Molecular Networking (GNPS) platform represents a critical computational and informatics phase [31] [32]. This process transforms raw, untargeted tandem mass spectrometry (MS/MS) data into a structured, interactive map of chemical space, where connections between molecules are inferred from the similarity of their fragmentation patterns [31]. For the specific goal of rational library design, molecular networking is indispensable as it enables the grouping of complex extract constituents into chemically related "molecular families" or scaffolds [19]. This scaffold-level grouping is the cornerstone of a rational library reduction strategy, as it allows researchers to prioritize extracts based on scaffold diversity rather than the total number of molecules. By focusing on unique structural cores, the method efficiently minimizes chemical redundancy inherent in large natural product collections, dramatically reducing the number of extracts required for primary high-throughput screening while retaining the majority of bioactive potential [19]. The subsequent protocols detail the application of GNPS to achieve this specific research objective, ensuring reproducible and high-quality network generation.
Experimental Protocols & Application Notes
Protocol 1: Data Preparation and Submission to GNPS
Objective: To convert raw LC-MS/MS vendor files into open formats, organize supplementary metadata, and successfully upload the data to the GNPS/MassIVE ecosystem for analysis.
Detailed Methodology:
File Format Conversion:
- Convert raw instrument files (e.g.,
.raw,.d) to open community formats using tools like MSConvert (part of ProteoWizard) or DAReel. - The recommended formats for GNPS are mzML or mzXML [31]. Ensure centroiding of MS/MS spectra is performed during conversion for optimal processing.
- Convert raw instrument files (e.g.,
Metadata Table Creation:
- Prepare a sample metadata table (
.tsvfile) essential for contextualizing results. This file links each data file to experimental attributes [31]. - Mandatory column:
filename. Critical optional columns for library design include:sample_type(e.g., crude extract, fraction),organism_source, andcollection_site. For bioactivity-guided analysis, columns likebioactivity_scoreortarget_inhibitioncan be added to color-code nodes in the final network [31] [32].
- Prepare a sample metadata table (
Data Upload:
- For datasets exceeding a few files, use an FTP client (e.g., WinSCP) to connect to
massive-ftp.ucsd.edufor robust, batch uploading [33]. - For quick submission of small datasets (<50 files, each <200MB), use the GNPS web drag-and-drop uploader [34]. Organize files into logical folders (e.g., by sample batch or organism).
- For datasets exceeding a few files, use an FTP client (e.g., WinSCP) to connect to
Protocol 2: Configuring and Executing the Molecular Networking Workflow
Objective: To create a molecular network from uploaded MS/MS data by calculating spectral similarities and applying optimized clustering parameters.
Detailed Methodology:
Workflow Initiation:
Parameter Selection and Optimization:
Table 1: Key GNPS Molecular Networking Parameters for Rational Library Design
| Parameter | Recommended Setting for Library Design | Function and Rationale |
|---|---|---|
| Precursor Ion Mass Tolerance | 0.02 Da (high-res instruments) | Controls MS-Cluster grouping; tight tolerance reduces merging of different precursors. |
| Fragment Ion Mass Tolerance | 0.02 Da (high-res instruments) | Impacts cosine score calculation; critical for accurate spectral similarity. |
| Min Pairs Cosine | 0.7-0.8 | Most critical. Higher values create specific networks of closely related analogs; lower values connect more diverse structures. |
| Minimum Matched Peaks | 6 | Ensures connections are based on sufficient spectral evidence. Lower values may create noisy networks. |
| Run MSCluster | On | Essential. Clusters near-identical spectra from across files into a consensus spectrum, reducing redundancy. |
| Minimum Cluster Size | 2 | Only considers consensus spectra from ≥2 raw spectra, filtering singletons and noise. |
| Network TopK | 10 | Limits connections per node to the 10 strongest, simplifying visualization of large networks. |
| Maximum Connected Component Size | 100 | Breaks overly large clusters for easier visualization without losing intranetwork relationships. |
- Job Submission and Monitoring:
- Provide a descriptive title and your email for notification.
- Submit the job. Processing time varies from minutes for small datasets to hours for large ones [31]. Monitor progress on the status page.
Protocol 3: Analysis, Annotation, and Data Integration for Library Design
Objective: To interpret the molecular network, annotate chemical features, and extract the scaffold-level information required for rational extract selection.
Detailed Methodology:
Network Exploration and Visualization:
- Use the in-browser visualizer to explore spectral families. The network can be exported for advanced visualization in Cytoscape [31] [32].
- Color nodes by metadata: Import your metadata table to color-code nodes based on
organism_sourceorbioactivity_score. This visually identifies bioactive or taxonomically unique chemical clusters [32].
Spectral Library Annotation and Dereplication:
- GNPS automatically performs library search. Inspect the "View All Library Hits" results to annotate nodes with known compounds [31].
- Critical Step for Library Design: Use annotations to flag and potentially exclude clusters containing known nuisance compounds (e.g., detergents, media components) or previously discovered toxins from your selection algorithm [19].
Extraction of Scaffold Information for Rational Selection:
- Each connected cluster in the network corresponds to a unique molecular scaffold or a closely related family [19].
- The goal is to map which extracts (source files) contribute MS/MS spectra to each cluster. GNPS output tables provide this mapping.
- Execute Rational Selection Algorithm: Using custom scripts (e.g., in R, as described in [19]), iterate through the list of unique scaffolds (clusters). Select the extract that contains the greatest number of unique scaffolds. Iteratively add the next extract that adds the most new scaffolds to the selection, until a target percentage of total scaffold diversity (e.g., 80%, 95%) is achieved.
Visualizing the Workflow for Rational Library Design
The following diagram illustrates the integrated workflow from LC-MS/MS analysis to the generation of a rationally designed natural product library via GNPS molecular networking.
Diagram 1: Integrated workflow from LC-MS/MS analysis to rational library design via GNPS.
Table 2: Key Resources for Molecular Networking and Rational Library Design
| Resource Category | Specific Tool / Reagent | Function in Workflow |
|---|---|---|
| Data Conversion Software | MSConvert (ProteoWizard) | Converts proprietary mass spectrometer vendor files (.raw, .d) to open mzML/mzXML formats for GNPS upload [32]. |
| Metadata Standard | GNPS Metadata Template (.tsv) | Provides experimental context for samples, enabling color-coding and grouping in network visualizations and statistical analysis [31] [32]. |
| Computational Platform | GNPS Web Platform | Hosts the molecular networking, library search, and analysis workflows in a freely accessible, reproducible cloud environment [31] [35]. |
| Spectral Reference Libraries | GNPS Public Spectral Libraries (e.g., MassBank, ReSpect) | Enables dereplication by matching experimental MS/MS spectra to known compounds, preventing rediscovery [31] [32]. |
| Network Visualization & Analysis | Cytoscape | Advanced open-source platform for customizing, analyzing, and publishing molecular network graphs exported from GNPS [31] [32]. |
| Collaborative Analysis Tool | GNPS Dashboard | Enables real-time, collaborative online exploration of LC-MS data and molecular networks, facilitating remote team science [36]. |
| Statistical Computing Environment | R or Python with custom scripts | Executes the scaffold-based iterative selection algorithm to identify the minimal set of extracts for the rational library [19]. |
Results & Validation in the Context of Library Design
The efficacy of this GNPS-driven workflow is quantitatively demonstrated in rational library design research [19]. Applying the scaffold-based selection method to a library of 1,439 fungal extracts achieved dramatic library size reduction with minimal loss of chemical or bioactive diversity.
Table 3: Performance Metrics of GNPS-Driven Rational Library Design
| Metric | Full Library (1,439 extracts) | Rational Library (80% Scaffold Diversity) | Rational Library (100% Scaffold Diversity) | Improvement Over Random Selection |
|---|---|---|---|---|
| Library Size (No. of Extracts) | 1,439 | 50 | 216 | 84.9% size reduction to reach max diversity [19]. |
| Anti-P. falciparum Hit Rate | 11.26% | 22.00% | 15.74% | Hit rate doubled in minimized library; outperformed random selection quartiles (8-14%) [19]. |
| Retention of Bioactivity-Correlated Molecules | 266 molecules | 223 molecules (84%) | 260 molecules (98%) | Preserves majority of putative bioactive constituents despite major size reduction [19]. |
The data confirms that molecular networking successfully groups molecules into scaffolds, enabling a selection logic that prioritizes chemical diversity. The resulting rational libraries are not merely smaller random subsets but are enriched for bioactivity due to the reduction of redundant chemistry, thereby increasing screening efficiency and cost-effectiveness for drug discovery campaigns [19].
This document details the third phase of a comprehensive thesis focused on rational natural product (NP) library design for drug discovery. The overarching research program integrates liquid chromatography-tandem mass spectrometry (LC-MS/MS) analysis with computational methods to transform the inefficient, redundancy-plagued screening of NP extract libraries into a targeted, rationale-driven process [37] [38]. The central challenge addressed is that large NP libraries, while rich in chemical diversity, contain significant structural redundancy, leading to high costs, prolonged timelines, and repeated rediscovery of known compounds in high-throughput screening (HTS) [6].
Within this framework, Phase 1 established the foundational LC-MS/MS metabolomic profiling and dereplication protocols to annotate known compounds [37] [39]. Phase 2 implemented molecular networking via platforms like GNPS to visualize chemical relationships and group metabolites into scaffold-based families [37] [6]. This current phase, Phase 3, introduces a core computational advancement: an iterative selection algorithm. This algorithm is designed to analyze molecular networking data and construct a maximally diverse, minimal subset library. By prioritizing scaffold diversity—the variation in core molecular frameworks—the algorithm minimizes redundant chemotypes while maximizing the probability of discovering novel bioactive entities [40] [6]. This strategy directly enhances HTS efficiency by increasing bioassay hit rates and accelerating the identification of unique leads [6].
The Iterative Selection Algorithm: Rationale and Workflow
The goal of the selection algorithm is to transition from a large, redundant library of N extracts to a minimal, rationally designed library of n extracts (where n << N) that retains the vast majority of the original scaffold diversity [6]. The algorithm operates on the principle that molecules with similar MS/MS fragmentation patterns share core structural scaffolds and often similar biological activities [40] [6]. Therefore, diversifying scaffolds is prioritized over diversifying every individual ion signal.
The algorithm proceeds through the following automated, iterative steps, as implemented in custom R or Python code [6]:
- Input & Scaffold Definition: Processed LC-MS/MS data from all N library extracts is used as input. Molecular features (unique m/z and retention time pairs) are grouped into scaffold clusters using spectral similarity algorithms within the Global Natural Products Social Molecular Networking (GNPS) platform [37] [6].
- Initialization: The algorithm selects the single extract containing the highest number of unique scaffold clusters.
- Iterative Selection: a. The scaffolds present in the current rational library are identified. b. For each remaining extract in the full library, the algorithm calculates the number of novel scaffolds it contains that are not already represented in the rational library. c. The extract with the highest count of novel scaffolds is added to the rational library.
- Termination: Steps 3a-c repeat until a predefined stopping criterion is met. This is typically either:
- Achieving a target percentage (e.g., 80%, 95%, 100%) of the total scaffold diversity found in the full library.
- Reaching a predefined maximum number of extracts.
This greedy selection strategy accelerates the accumulation of diversity. Empirical validation on a library of 1,439 fungal extracts demonstrated that this method achieves 80% of maximal scaffold diversity with only 50 extracts, compared to an average of 109 extracts required by random selection—a greater than two-fold efficiency gain [6].
Diagram: Algorithm for Iterative Library Selection
Quantitative Performance Data
The algorithm's effectiveness is quantified by two key metrics: library size reduction and bioactive retention. Testing on a fungal extract library against multiple biological targets confirms its superior performance over random selection [6].
Table 1: Library Size Reduction to Achieve Scaffold Diversity [6]
| Target Scaffold Diversity | Extracts Required (Random Selection) | Extracts Required (Algorithmic Selection) | Fold Reduction vs. Random | Reduction vs. Full Library (1,439 extracts) |
|---|---|---|---|---|
| 80% of Max | 109 | 50 | 2.2x | 28.8x |
| 100% of Max | 755 | 216 | 3.5x | 6.6x |
Table 2: Bioassay Hit Rate Enhancement with Algorithmically Selected Libraries [6]
| Bioassay Target | Hit Rate: Full Library | Hit Rate: 80% Diversity Library | Hit Rate (Range): 50 Random Extracts |
|---|---|---|---|
| Plasmodium falciparum | 11.26% | 22.00% | 8.00% – 14.00% |
| Trichomonas vaginalis | 7.64% | 18.00% | 4.00% – 10.00% |
| Influenza Neuraminidase | 2.57% | 8.00% | 0.00% – 2.00% |
Table 3: Retention of Bioactivity-Correlated Molecular Features [6]
| Bioassay Target | Significant Features in Full Library | Features Retained in 80% Diversity Library | Features Retained in 100% Diversity Library |
|---|---|---|---|
| Plasmodium falciparum | 10 | 8 | 10 |
| Trichomonas vaginalis | 5 | 5 | 5 |
| Influenza Neuraminidase | 17 | 16 | 17 |
Application Notes & Experimental Protocols
Protocol I: LC-MS/MS Data Acquisition for Molecular Networking
This protocol generates the high-quality spectral data required for scaffold clustering [37] [39] [6]. 1. Sample Preparation:
- Prepare crude natural product extracts (e.g., from fungi, plants) in LC-MS grade methanol at a concentration of ~1 mg/mL [39].
- Centrifuge at 14,000 x g for 10 minutes to pellet insoluble debris. Transfer supernatant to an LC-MS vial.
2. LC-MS/MS Analysis:
- Chromatography: Use a reversed-phase C18 column (e.g., 2.1 x 100 mm, 1.7-2.7 µm). Employ a gradient from 5% to 95% acetonitrile (with 0.1% formic acid) in water (with 0.1% formic acid) over 10-20 minutes [39].
- Mass Spectrometry:
- Instrument: High-resolution tandem mass spectrometer (e.g., Q-TOF, Orbitrap).
- Ionization: Electrospray Ionization (ESI), both positive and negative polarity modes [39].
- Scanning: Data-Dependent Acquisition (DDA). A full MS1 scan (e.g., m/z 100-2000) is followed by MS2 fragmentation of the most intense ions.
- Fragmentation: Use stepped collision energies (e.g., 10, 35, 80 eV) to generate comprehensive fragmentation spectra [39].
3. Data Processing:
- Convert raw files to open formats (.mzXML, .mzML) using tools like MSConvert [39].
- Upload data to the GNPS platform for molecular networking and library searching [37].
Diagram: LC-MS/MS to Molecular Networking Workflow
Protocol II: Proteomic Profiling for Mechanism-of-Action Studies
Following the identification of bioactive extracts from the rationally selected library, this LC-MS/MS-based proteomics protocol can be used to elucidate the compound's cellular target and mechanism of action [38]. 1. Cell Treatment and Preparation:
- Treat relevant cell lines (e.g., cancer, parasite) with the bioactive natural product extract or purified compound at the IC50 concentration. Include a vehicle-only control.
- After incubation (e.g., 24h), wash cells with PBS and lyse using RIPA buffer with protease/phosphatase inhibitors.
2. Protein Digestion (Bottom-Up Proteomics):
- Quantify protein concentration using a BCA assay.
- Reduce (e.g., DTT), alkylate (e.g., iodoacetamide), and digest proteins with trypsin overnight [38].
- Desalt peptides using C18 solid-phase extraction tips.
3. LC-MS/MS Analysis and Quantification:
- Chromatography: Similar to Protocol I, but with a longer nano-flow C18 column for enhanced peptide separation.
- Mass Spectrometry: Use a high-resolution instrument. For label-free quantification (LFQ), use Data-Independent Acquisition (DIA, e.g., SWATH-MS) for comprehensive peptide fragmentation [38].
- Data Analysis: Process data with proteomics software (e.g., Spectronaut, DIA-NN, MaxQuant). Identify and quantify proteins by searching against the appropriate species-specific database.
4. Bioinformatics & Pathway Analysis:
- Perform statistical analysis to identify proteins with significantly altered abundance between treatment and control groups.
- Use tools like STRING or Metascape to map differentially expressed proteins onto biological pathways (e.g., apoptosis, oxidative stress) to generate hypotheses for mechanism of action [38].
Protocol III: In Silico Scaffold Optimization & Hopping
When a promising NP scaffold with suboptimal properties is identified, computational scaffold hopping can be employed to design novel analogs [40] [41]. 1. Pharmacophore Modeling:
- Based on the active NP's structure and/or a co-crystal structure with its target, define the essential pharmacophore features (e.g., hydrogen bond donor/acceptor, hydrophobic region, positive ionizable group) [40].
2. Virtual Screening & Scaffold Design:
- Fragment Linking/Merging: If multiple fragment hits bind to adjacent pockets, use software (e.g., Fragmenstein) to computationally link them into a single, higher-affinity scaffold [41].
- Ultra-Large Library Docking: Dock billions of make-on-demand virtual compounds (e.g., from Enamine REAL database) into the target protein's binding site to identify novel chemotypes that satisfy the pharmacophore [41].
- Topology-Based Hopping: Use shape-based or topology-based similarity searches to identify structurally distinct molecules that present similar 3D pharmacophores [40].
3. Validation & Selection:
- Select top-ranked virtual hits for synthesis or purchase.
- Validate binding and activity using the biochemical or cell-based assays from the original screening campaign.
Table 4: Key Research Reagents, Databases, and Software for NP Library Design
| Item | Function / Application | Example / Source |
|---|---|---|
| LC-MS Grade Solvents | Essential for sample preparation and mobile phases to minimize background noise and ion suppression in mass spectrometry. | Methanol, Acetonitrile, Water (with 0.1% Formic Acid) |
| Reversed-Phase C18 Column | Standard chromatography column for separating small molecule natural products based on hydrophobicity. | Agilent InfinityLab Poroshell 120, Waters ACQUITY UPLC BEH C18 |
| GNPS Platform | Central, open-access platform for mass spectrometry data analysis, molecular networking, spectral library searching, and dereplication. | https://gnps.ucsd.edu [37] [6] |
| MS/MS Spectral Libraries | Curated databases of reference spectra for dereplication, crucial for avoiding rediscovery of known compounds. | GNPS Libraries, Lichen Database (LDB), ElixDB [39], NIST MS/MS Library |
| Molecular Docking Software | Software for predicting how small molecules (virtual hits, NP scaffolds) bind to a protein target, enabling structure-based design and scaffold hopping. | AutoDock Vina, Glide, GOLD [42] [41] |
| Proteomics Analysis Suite | Software for processing raw LC-MS/MS proteomics data, identifying peptides, quantifying proteins, and performing statistical analysis. | MaxQuant, Proteome Discoverer, DIA-NN, Spectronaut [38] |
| In Silico Compound Library | Ultra-large, enumerable virtual libraries of synthetically accessible compounds for virtual screening and novel scaffold discovery. | Enamine REAL, ZINC [41] |
| Cellular Assay Reagents | Reagents for phenotypic or target-based high-throughput screening to validate bioactivity of selected extracts and pure compounds. | Cell lines, assay kits (e.g., for viability, enzyme activity), fluorescent probes. |
Natural products (NPs) are a preeminent source of new pharmaceuticals, accounting for a significant proportion of newly approved drugs [19]. However, traditional discovery pipelines that screen vast libraries of crude extracts are plagued by high costs, long timelines, and the frequent rediscovery of known compounds [19]. This inefficiency underscores the critical need for rational library design, where the goal shifts from screening the largest possible collection to curating a smaller, smarter library that maximizes chemical diversity and bioactivity potential.
At the heart of this strategy is the concept of scaffold diversity. A scaffold represents the core ring system and framework of a molecule, which largely dictates its three-dimensional shape and biological interactions [43]. Focusing on diversifying scaffolds, rather than individual molecules, ensures coverage of broader chemical space and increases the probability of identifying novel bioactive leads [19]. This application note, framed within broader research on LC-MS/MS for rational NP library design, provides a detailed framework for defining and achieving specific scaffold diversity targets (e.g., 80%, 100%). We present quantitative metrics, experimental protocols, and a toolkit for researchers to implement this strategy effectively.
Quantitative Framework for Scaffold Diversity Metrics
Setting rational targets for library design requires robust, quantifiable metrics. The following measures, derived from cheminformatic analysis, allow for the objective assessment and comparison of scaffold diversity.
Table 1: Key Metrics for Assessing Scaffold Diversity
| Metric | Definition | Interpretation | Benchmark from Literature |
|---|---|---|---|
| Scaffold Coverage (F₅₀) | The fraction of unique scaffolds required to account for 50% of the molecules in a library [43]. | A lower F₅₀ value indicates higher diversity, as fewer scaffolds dominate the collection. | For fungal metabolites, F₅₀ was 0.19, indicating higher diversity than commercial NP libraries (F₅₀ ~0.25) [43]. |
| Scaled Shannon Entropy (SSE) | A normalized measure (0-1) of the uniformity of compound distribution across scaffolds [43]. | An SSE closer to 1 indicates a near-even distribution of compounds across many scaffolds (high diversity). | Fungal metabolite libraries showed high SSE values, confirming even distribution across diverse scaffolds [43]. |
| Singleton Scaffold Ratio | The proportion of scaffolds that appear only once in the library [43]. | A higher ratio suggests a library rich in unique, rare chemotypes. | In one analysis, 67% of scaffolds in a fungal metabolite set were singletons [43]. |
| Cumulative Diversity Gain | The number of extracts needed to reach a target percentage of total scaffold diversity. | Measures the efficiency of a selection algorithm. A steep gain is desirable. | A rational LC-MS/MS method reached 80% diversity with 50 extracts, vs. 109 for random selection [19]. |
These metrics enable the definition of clear success thresholds. For example, a rational design goal could be: "Achieve 80% of total identified scaffold diversity with a library containing <20% of the original extracts, while maintaining an SSE > 0.8."
Table 2: Performance of Rational vs. Random Library Selection (1439-Extract Library)
| Diversity Target | Rational Selection (Extracts Required) | Random Selection (Avg. Extracts Required) | Library Size Reduction | Resulting Bioactivity Hit Rate (P. falciparum) |
|---|---|---|---|---|
| 80% | 50 [19] | 109 [19] | 96.5% | 22.0% [19] |
| 100% | 216 [19] | 755 [19] | 85.0% | 15.7% [19] |
| Full Library (Reference) | 1439 | 1439 | 0% | 11.3% [19] |
The Scientist's Toolkit: Essential Reagents and Solutions
Table 3: Research Reagent Solutions for LC-MS/MS-Based Library Design
| Item | Function / Specification | Application in Protocol |
|---|---|---|
| Liquid Chromatography System | UHPLC capable of reproducible gradient elution (e.g., C18 column, 1.7-1.8 µm particle size). | Separates complex natural product extracts prior to mass spectrometry analysis. |
| Tandem Mass Spectrometer | High-resolution Q-TOF or Orbitrap instrument with data-dependent acquisition (DDA) capabilities. | Generates MS1 (precursor) and MS2 (fragmentation) spectral data for molecular networking. |
| Solvents for LC-MS | LC-MS grade water, acetonitrile, and methanol; additive: 0.1% formic acid. | Mobile phase for chromatographic separation and ionization enhancement in positive mode. |
| Molecular Networking Software (GNPS) | Global Natural Products Social Molecular Networking platform (gnps.ucsd.edu). | Processes MS/MS data to create networks where similar spectra cluster, defining scaffold families [19]. |
| Solid-State Fermentation Media | E.g., Cheerios-based medium or defined rice/oatmeal agar [19]. | Supports the growth of fungi and production of secondary metabolites for extract generation. |
| Extraction Solvents | Ethyl acetate, methanol, or dichloromethane-methanol mixtures. | Extracts metabolites from microbial culture or solid fermentation media. |
| Standard 96 or 384-Well Plates | Clear, cell culture-treated plates compatible with HTS readers. | Stores normalized extracts for screening and facilitates logistical management. |
Detailed Experimental Protocols
Protocol 1: LC-MS/MS Data Acquisition for Molecular Networking
Objective: Generate high-quality, comparable MS/MS data from all library extracts for subsequent scaffold analysis.
Sample Preparation:
- Prepare fungal extracts (e.g., from solid-state fermentation [19]) and dissolve in appropriate solvent (e.g., 1 mg/mL in methanol).
- Centrifuge at high speed (>10,000 x g) for 10 minutes to remove particulates.
- Transfer supernatant to LC-MS vials. Include a pooled "quality control" sample created by mixing equal volumes of all extracts to monitor instrument performance.
LC-MS/MS Method:
- Column: Reversed-phase C18 (e.g., 100 x 2.1 mm, 1.7 µm).
- Mobile Phase: A: Water + 0.1% formic acid; B: Acetonitrile + 0.1% formic acid.
- Gradient: Optimize for your column; e.g., 5% B to 100% B over 20-25 minutes, hold at 100% B for 3 minutes, re-equilibrate.
- MS Acquisition (Data-Dependent Analysis - DDA):
- MS1 Scan: 100-1500 m/z, high resolution (e.g., 60,000-120,000 at 200 m/z).
- MS2 Fragmentation: Select top N (e.g., 10) most intense ions per cycle for fragmentation using stepped normalized collision energy (e.g., 20, 40, 60 eV).
- Dynamic Exclusion: Set to 15-30 seconds to prevent repeated fragmentation of the same abundant ions.
Protocol 2: Constructing the Scaffold Network & Iterative Library Selection
Objective: Convert MS/MS data into a scaffold-based network and algorithmically select a minimal set of extracts that achieves target diversity coverage.
Data Processing & Molecular Networking:
- Convert raw MS files to open formats (.mzML, .mzXML) using MSConvert (ProteoWizard).
- Upload files to the GNPS platform. Perform "Molecular Networking" with Classical workflow [19].
- Key Parameters: Precursor ion mass tolerance (0.02 Da), MS/MS fragment ion tolerance (0.02 Da), minimum cosine score for network edges (e.g., 0.7), minimum matched peaks (6).
- Execute the job. The output is a network where each node is a consensus MS/MS spectrum, and edges connect spectrally similar nodes, representing scaffolds or closely related analogs.
Iterative Maximum-Diversity Selection Algorithm:
- Input: The list of all extracts and the GNPS network clusters (scaffolds) each extract contains.
- Process (Greedy Algorithm):
- Calculate the total number of unique scaffold clusters across all extracts. This is the 100% diversity reference.
- Select the single extract that contains the greatest number of unique scaffolds. This is the first member of the rational library.
- From the remaining extracts, select the one that adds the largest number of new scaffolds not yet present in the rational library.
- Repeat step 3 iteratively.
- Stop when the rational library contains the target percentage (e.g., 80%) of the total unique scaffolds identified in step 1 [19].
- Output: An ordered list of extracts constituting the rationally minimized library. This process, validated in recent research, achieves 80% scaffold diversity with only 3.5% of a 1439-extract library [19].
Protocol 3: Validating Library Performance: Bioactivity Retention
Objective: Confirm that the rationally minimized library retains the bioactivity potential of the full library.
Parallel Biological Screening:
- Subject both the full library and the rational sub-library to identical high-throughput phenotypic or target-based assays (e.g., anti-parasitic or enzyme inhibition) [19].
- Use standardized positive and negative controls in each assay plate.
Data Analysis & Success Metrics:
- Calculate hit rates (% of active extracts) for both libraries.
- Success Criterion: The hit rate of the rational library should be statistically equivalent to or greater than that of the full library. Recent studies show hit rates can increase (e.g., from 11.3% to 22% for P. falciparum) due to reduced redundancy [19].
- Perform statistical tests (e.g., Fisher's exact test) to confirm the significance of the result.
Visualizing the Workflow and Algorithm
LC-MS/MS Workflow for Rational Library Design
Iterative Algorithm for Maximum-Diversity Selection
Rational natural product library design, guided by quantitative scaffold diversity targets, transforms drug discovery from a numbers game into an efficient, knowledge-driven process. The integration of untargeted LC-MS/MS, molecular networking, and iterative algorithms provides a robust pipeline to achieve this.
Based on empirical data [19], we recommend the following tiered strategy:
- For Initial Discovery & Resource-Limited Settings: Aim for an 80% scaffold diversity target. This captures the majority of chemical space with a minimal library (often <5% of the original size), significantly increases bioactivity hit rates, and dramatically reduces screening costs and time.
- For Comprehensive Discovery & Lead Expansion: Aim for 100% scaffold diversity. This ensures no rare scaffold is missed and provides the complete chemical inventory of your source material for subsequent optimization and SAR studies.
This framework provides researchers with a clear, actionable path to build more effective, efficient, and economically viable natural product screening libraries, accelerating the discovery of next-generation therapeutics.
Application Notes: Integration of LC-MS/MS Based Rational Design into a Drug Discovery Thesis
This document details the practical application and protocols for the rational size reduction of natural product extract libraries using liquid chromatography-tandem mass spectrometry (LC-MS/MS). Framed within a broader thesis on LC-MS/MS for rational natural product library design, this work addresses a critical bottleneck in drug discovery: the screening of excessively large, chemically redundant natural product libraries, which increases time, cost, and the likelihood of re-isolating known compounds [6].
The core innovation is a method that uses untargeted LC-MS/MS data and molecular networking to prioritize chemical scaffold diversity over the sheer number of extracts [6] [19]. By constructing a minimal library that maximizes the representation of unique molecular scaffolds, researchers can dramatically reduce initial screening efforts while preserving, and even enhancing, the probability of discovering novel bioactive leads. This case study demonstrates the application of this method to a library of 1,439 fungal extracts, achieving up to a 28.8-fold reduction in library size (to 50 extracts) while retaining key bioactive compounds and significantly increasing bioassay hit rates [6].
Key Rationale for Thesis Context: This approach exemplifies the thesis core premise by moving beyond LC-MS/MS as a mere analytical tool for dereplication. It positions LC-MS/MS data as the primary informatic driver for strategic library design. The methodology directly links spectral similarity to structural similarity and, by extension, to biological activity space, enabling a more efficient and intelligent allocation of screening resources [6] [44].
The rational reduction algorithm is based on scaffold diversity. Molecular scaffolds, grouped via MS/MS spectral similarity networks, are used as a proxy for structural and potential bioactive diversity [6]. The algorithm iteratively selects the extract containing the greatest number of scaffolds not yet represented in the growing rational library.
Quantitative Efficacy of Library Size Reduction
Table 1: Library Size Reduction and Scaffold Diversity Metrics [6] [19]
| Diversity Target | Full Library (1,439 extracts) | Rational Library (Method) | Random Selection (Average) | Fold Reduction (vs. Full) |
|---|---|---|---|---|
| 80% of Max Scaffolds | 1,439 extracts | 50 extracts | 109 extracts | 28.8-fold |
| 100% of Max Scaffolds | 1,439 extracts | 216 extracts | 755 extracts | 6.6-fold |
Biological Validation: Retention and Enhancement of Bioactivity
A critical validation step tested the rational libraries in bioassays against eukaryotic parasites (Plasmodium falciparum, Trichomonas vaginalis) and the viral enzyme neuraminidase [6]. Table 2: Bioassay Hit Rate Comparison [6] [19]
| Activity Assay | Hit Rate: Full Library | Hit Rate: 80% Diversity Lib. (50 extracts) | Hit Rate: 100% Diversity Lib. (216 extracts) | Random Extract Quartiles (50 extracts) |
|---|---|---|---|---|
| P. falciparum | 11.26% | 22.00% | 15.74% | 8.00–14.00% |
| T. vaginalis | 7.64% | 18.00% | 12.50% | 4.00–10.00% |
| Neuraminidase | 2.57% | 8.00% | 5.09% | 0.00–2.00% |
Furthermore, analysis of MS features (unique m/z and RT) correlated with bioactivity in the full library showed high retention in the rational subset [6]. Table 3: Retention of Bioactivity-Correlated MS Features [6]
| Activity Assay | Significant Features in Full Library | Retained in 80% Diversity Library | Retained in 100% Diversity Library |
|---|---|---|---|
| P. falciparum | 10 | 8 | 10 |
| T. vaginalis | 5 | 5 | 5 |
| Neuraminidase | 17 | 16 | 17 |
Detailed Experimental Protocols
Protocol 1: High-Throughput Fungal Cultivation and Extract Production (FLECS-96)
This protocol is adapted from the FLECS-96 platform for generating chemically characterized fungal extract libraries in a 96-well format [45] [46].
I. Fungal Revival and Inoculation
- Revive frozen fungal strains from the collection (e.g., Agroscope Mycoscope) on Potato Dextrose Agar (PDA) plates. Incubate at 25°C for 7 days.
- Using a sterile cork borer or pipette tip, cut small agar plugs (≈3-4 mm diameter) from the growing edge of the colony.
- Inoculate each plug into a single well of a sterile, deep-well 96-well plate containing 1.5 mL of Potato Dextrose Broth (PDB). Seal the plate with a gas-permeable adhesive membrane.
II. Miniaturized Liquid Culture
- Incubate the deep-well plate on an orbital shaker (e.g., Duetz system) at 25°C, 220 rpm for 14 days to promote mycelial growth and secondary metabolite production [45].
- Monitor growth periodically through visual inspection of mycelial pelleted formation.
III. Metabolite Extraction (Solid-Phase Extraction - SPE) Note: SPE was validated as the optimal method for broad metabolite recovery and reproducibility in high-throughput format [46].
- Post-cultivation, centrifuge the deep-well plate at 4000 × g for 20 minutes to pellet mycelia.
- Transfer 1.0 mL of supernatant from each well to a corresponding well of a 96-well SPE plate packed with C18-bonded silica.
- Condition the SPE plate with 1 mL methanol, then equilibrate with 1 mL HPLC-grade water.
- Load the supernatant. Wash with 1 mL of 5% methanol in water to remove highly polar salts and sugars.
- Elute metabolites with 1 mL of 100% methanol into a fresh collection plate.
- Evaporate the eluent to dryness under a gentle stream of nitrogen or using a centrifugal vacuum concentrator. Store dry extracts at -20°C.
Protocol 2: LC-MS/MS Data Acquisition for Molecular Networking
I. Sample Reconstitution and Analysis
- Reconstitute each dried extract in 100 µL of 80% methanol/20% water containing 0.1% formic acid. Centrifuge to pellet insoluble debris.
- Inject 2-5 µL onto a reversed-phase UHPLC column (e.g., C18, 2.1 x 100 mm, 1.7 µm).
- Use a binary gradient: (A) Water + 0.1% formic acid; (B) Acetonitrile + 0.1% formic acid. Run a linear gradient from 5% B to 100% B over 15-20 minutes.
- Acquire data on a high-resolution tandem mass spectrometer (e.g., Q-TOF or Orbitrap) in data-dependent acquisition (DDA) mode. Acquire a full MS1 scan (e.g., m/z 100-1500) followed by MS2 scans on the top N most intense ions.
Protocol 3: Computational Workflow for Rational Library Design
I. Molecular Networking and Scaffold Detection
- Convert raw LC-MS/MS files (.d, .raw) to open formats (.mzML, .mzXML) using MSConvert (ProteoWizard).
- Upload files to the Global Natural Products Social Molecular Networking (GNPS) platform .
- Create a Classical Molecular Network using standard parameters: precursor ion mass tolerance 2.0 Da, product ion tolerance 0.5 Da, minimum cosine score 0.7, minimum matched peaks 6 [6]. This clusters MS/MS spectra into molecular families (scaffolds).
- Download the resulting network files (e.g., graphML) and the feature table linking LC-MS features to specific samples and network nodes.
II. Iterative Rational Selection Algorithm
- Using custom R code (available from the primary study [6]), parse the network data to identify all unique scaffold clusters (network nodes).
- For each fungal extract, identify the set of unique scaffolds it contains.
- Selection Iteration: a. Initialize an empty rational library list. b. Select the single extract containing the largest number of unique scaffolds. Add it to the rational library. c. Identify all unique scaffolds now represented in the rational library. d. From the remaining extracts, select the one that contains the greatest number of scaffolds not yet represented in the rational library. e. Repeat steps c-d until a predefined diversity threshold (e.g., 80%, 95%, 100% of total scaffolds) is reached.
- The output is an ordered list of extract IDs constituting the rationally minimized library.
Diagram 1: Integrated workflow from fungal culture to rational library design and validation. This diagram outlines the four-phase process: starting with high-throughput cultivation and LC-MS/MS analysis, progressing to molecular networking for scaffold identification, applying the iterative selection algorithm to build the minimal library, and concluding with biological validation [6] [45].
Diagram 2: Logic of the scaffold diversity-based iterative selection algorithm. This flowchart details the core decision logic of the rational minimization algorithm, which iteratively selects extracts to maximize the accumulation of unique molecular scaffolds until a pre-defined diversity target is met [6] [19].
The Scientist's Toolkit: Essential Research Reagent Solutions
Table 4: Key Reagents, Tools, and Software for Implementation
| Category | Item/Resource | Function in Protocol | Key Notes/Specifications |
|---|---|---|---|
| Cultivation & Extraction | Deep-well 96-well plates (2 mL) | Miniaturized fungal liquid culture [45]. | Compatible with orbital shaker systems (e.g., Duetz). |
| Potato Dextrose Broth (PDB) | Generic culture medium for diverse fungi [45]. | Favors secondary metabolism. | |
| 96-well SPE Plates (C18) | High-throughput solid-phase extraction of metabolites [46]. | Provides clean-up and concentration; optimal recovery for diverse logP [46]. | |
| LC-MS/MS Analysis | Reversed-Phase UHPLC Column (C18) | Chromatographic separation of complex extracts. | e.g., 2.1 x 100 mm, 1.7 µm particle size. |
| High-Resolution Tandem Mass Spectrometer | Detection and fragmentation of metabolites. | Q-TOF or Orbitrap with ESI source for DDA. | |
| Computational Tools | GNPS (Global Natural Products Social Molecular Networking) | Web-platform for MS/MS spectral networking and scaffold clustering [6] [44]. | Core tool for transforming MS data into scaffold relationships. |
| SNAP-MS (Structural similarity Network Annotation Platform) | Annotates molecular networks with compound families using chemical similarity [44]. | Aids in preliminary structural class identification. | |
| BMDMS-NP / NIST / MassBank | Reference MS/MS spectral libraries for dereplication [47] [48]. | Critical for identifying known compounds to avoid rediscovery. | |
| Custom R/Python Scripts | Executes the iterative rational selection algorithm [6]. | Available from cited study; requires feature table and network data. | |
| Data & Standards | Natural Products Atlas | Curated database of microbial natural product structures [44]. | Used as a reference for chemical space and formula distributions. |
| Internal Standard Mixture | Monitoring LC-MS system performance and stability. | A mix of compounds spanning relevant m/z and RT ranges. |
Natural products and their structural analogues have historically been the source of nearly 70% of new chemical entities approved as drugs over the past four decades, particularly for cancer and infectious diseases [2]. Despite this proven utility, drug discovery pipelines face significant bottlenecks when screening large libraries of crude natural product extracts. These challenges include structural redundancy, the high likelihood of bioactive re-discovery, and the substantial time and financial costs associated with high-throughput screening of thousands of complex samples [6]. The traditional approach of screening ever-larger libraries is increasingly viewed as unsustainable.
This context frames the critical need for rational natural product library design. Advances in analytical technologies, particularly liquid chromatography-tandem mass spectrometry (LC-MS/MS), now provide the tools to move beyond mere brute-force screening. By applying LC-MS/MS-based metabolomics and computational analysis, researchers can pre-emptively assess and maximize the chemical diversity of a library while dramatically reducing its size [6] [49]. This strategy shifts the paradigm from screening vast, undifferentiated collections to interrogating focused, rationally designed libraries that are enriched for unique scaffolds and potential bioactivity. This article details the application notes and protocols for applying these LC-MS/MS-driven methods to pre-fractionated libraries and diverse natural sources, within the broader thesis that rational design is essential for the future efficiency of natural product-based discovery.
Core Principles of LC-MS/MS-Driven Rational Library Design
The foundational principle of rational library design is the replacement of redundancy with diversity. The method leverages the fact that molecules with similar MS/MS fragmentation patterns possess structural similarity, which often correlates with similar biological activity [6]. By using LC-MS/MS data to group metabolites into molecular families or "scaffolds" prior to biological screening, researchers can select a minimal set of samples that collectively represent the maximum breadth of chemical diversity present in a larger collection.
The process typically begins with untargeted LC-MS/MS analysis of all extracts in a primary library. The resulting fragmentation data is processed through molecular networking software (e.g., GNPS), which clusters spectra based on similarity [6] [50]. These clusters represent distinct molecular scaffolds. Custom algorithms then select extracts iteratively: the first extract chosen is the one containing the greatest number of scaffolds; subsequent extracts are added based on their contribution of scaffolds not yet represented in the growing rational library. This continues until a pre-defined threshold of total scaffold diversity is achieved [6].
Table: Performance of Rational Library Design vs. Random Selection
| Metric | Full Library (1,439 extracts) | Rational Library (80% diversity) | Rational Library (100% diversity) | Random Selection (50 extracts, avg.) |
|---|---|---|---|---|
| Library Size | 1,439 | 50 | 216 | 50 |
| Scaffold Diversity | 100% | 80% | 100% | Variable |
| Anti-P. falciparum Hit Rate | 11.26% | 22.00% | 15.74% | 8-14% |
| Key Bioactive Feature Retention | 100% | 80% (8 of 10 features) | 100% | Not Guaranteed |
This data-driven curation results in exponential gains in efficiency. As demonstrated in one study, a rational library of just 50 extracts captured 80% of the scaffold diversity of a 1,439-extract library—a 28.8-fold size reduction—while simultaneously doubling the bioassay hit rate against certain targets [6]. This counters the intuitive assumption that a smaller library yields fewer hits; instead, by removing redundant chemistry, the probability of discovering unique bioactivity per sample screened is significantly increased.
Diagram: LC-MS/MS-Driven Rational Library Design Workflow. The process transforms a large, redundant library into a minimal, diverse one prior to screening.
Application Note 1: From Crude Extracts to Pre-fractionated Libraries
Rationale for Pre-fractionation While rational design applied to crude extracts is powerful, applying it to pre-fractionated libraries represents a logical and impactful progression. Crude extracts are complex mixtures where potent bioactive compounds may be masked by interfering substances or their signals suppressed during MS analysis. Pre-fractionation (e.g., using solid-phase extraction or HPLC) reduces this complexity, yielding sub-libraries of semi-purified compounds. This simplifies the chemical background for both LC-MS/MS analysis and subsequent bioassays, leading to clearer structure-activity relationships and facilitating the identification of active principles [2].
Modified Protocol for Pre-fractionated Libraries The core rational design workflow remains applicable but requires adjustments at the data acquisition and processing stages.
- Fractionation: Subject crude extracts to a standardized, mid-resolution fractionation protocol (e.g., fractionation by lipophilicity using a C18 cartridge into 3-5 fractions).
- LC-MS/MS Analysis: Analyze all fractions using the same untargeted LC-MS/MS method. The increased number of samples (crude extracts × fractions) is offset by their reduced complexity, which often improves chromatographic separation and MS/MS spectral quality.
- Data Integration & Networking: Process all fraction data together in a single molecular networking job. A key advantage emerges: the same molecular scaffold appearing in multiple sequential fractions from the same crude extract provides early chromatographic behavior data, which is valuable for later purification.
- Rational Selection: Apply the diversity selection algorithm. The selection unit can shift from the "crude extract" to the "individual fraction." This allows the construction of a rational library that might include, for example, a non-active fraction from one organism that contains a unique scaffold, alongside an active fraction from another organism.
- Bioactivity Correlation: When screening data becomes available, correlating bioactivity to specific MS features is more straightforward in less complex fractions, reducing the risk of missing actives due to ion suppression.
Benefits: This approach delivers a library that is not only chemically diverse but also of reduced complexity, streamlining the path from hit identification to compound isolation. It directly addresses the "activity dilution" problem of crude extracts and minimizes false negatives in screening [51].
The principles of LC-MS/MS-driven library design are agnostic to the biological source material. Successful application requires tailoring sample preparation and data interpretation to the specific source's biochemistry.
Marine Organisms: Marine invertebrates and algae often possess unique halogenated and sulfated metabolites. Sample preparation must consider salt removal, which is critical for LC-MS performance. Libraries should be designed with an awareness of symbiotic relationships (e.g., between sponges and microbial symbionts), as the true producer of a metabolite may not be the macro-organism itself. Molecular networking can help dereplicate common microbial metabolites from truly novel marine scaffolds [2].
Plant Material: Plant extracts are rich in polyphenols, terpenoids, and alkaloids and can be highly complex [50]. A key application is chemotaxonomy—using chemical profile similarity from LC-MS/MS data to inform phylogenetic relationships and guide the collection of genetically distant, and thus chemically diverse, specimens for the library [49]. Pre-fractionation is highly recommended for plants to separate major compound classes.
Fungal & Bacterial Cultures: This is where the method has been most rigorously validated [6] [49]. For microbes, integrating genetic barcoding (e.g., ITS for fungi, 16S for bacteria) with metabolomic data creates a powerful bifunctional design tool. Researchers can identify which phylogenetic clades are under-sampled chemically and target collection efforts accordingly, ensuring diversity at both the genetic and metabolic levels.
Table: Source-Specific Considerations for Rational Library Design
| Natural Source | Key Metabolite Classes | Critical Sample Prep Step | Design Strategy Insight |
|---|---|---|---|
| Fungal Cultures | Polyketides, Non-ribosomal Peptides, Terpenoids | Standardized culture & extraction [6] | Integrate ITS barcoding to map chemotype to genotype [49]. |
| Plant Tissue | Polyphenols, Alkaloids, Terpenoids, Flavonoids | Defatting & polyphenol removal for some assays | Use chemical profiles for chemotaxonomic guidance to maximize phylogenetic diversity [50]. |
| Marine Invertebrates | Halogenated Compounds, Peptides, Polyketides | Thorough desalting (e.g., with Sephadex LH-20) | Be aware of symbiont production; network data can help distinguish source [2]. |
| Bacterial Cultures | Ribosomal & Non-ribosomal Peptides, Specialized Metabolites | Extraction tailored to expected compound polarity | Combine with genome mining data to prioritize strains with unique biosynthetic gene clusters. |
Detailed Experimental Protocols
Protocol 1: LC-MS/MS-Based Library Reduction & Design
This protocol details the core method for creating a rational, minimal library from a larger collection of crude or pre-fractionated natural product samples [6].
I. Sample Preparation & LC-MS/MS Data Acquisition
- Standardized Extraction: Perform extractions on all source material (e.g., fungal biomass, plant tissue) using a consistent, validated solvent system (e.g., 1:1:1 ethyl acetate:methanol:water) and procedure to ensure comparability.
- LC-MS/MS Analysis: Analyze all samples using a standardized untargeted LC-MS/MS method.
- LC: Reversed-phase C18 column (e.g., 2.1 x 100 mm, 1.7 µm). Gradient: 5% to 100% acetonitrile (with 0.1% formic acid) in water (with 0.1% formic acid) over 20-30 minutes.
- MS: High-resolution tandem mass spectrometer (e.g., Q-TOF, Orbitrap). Data-Dependent Acquisition (DDA) mode: full MS scan (e.g., m/z 100-1500) followed by MS/MS scans on the top N most intense ions. Use dynamic exclusion.
II. Data Processing & Molecular Networking
- Convert raw data files to open format (.mzML, .mzXML).
- Process data through the Global Natural Products Social Molecular Networking (GNPS) platform or analogous software.
- Perform peak picking, alignment, and deisotoping.
- Create a molecular network using the GNPS classical networking workflow. Key parameters: minimum cosine score (e.g., 0.7), minimum matched fragment ions (e.g., 6), network TopK (e.g., 10).
- The output is a network where nodes represent MS/MS spectra and edges connect spectra with high similarity. Each connected cluster represents a molecular family or scaffold.
III. Rational Library Selection Algorithm
- Export the list of all features (defined by m/z and RT) and their associated scaffold/cluster IDs and the samples they appear in.
- Using custom R/Python scripting (code often shared alongside primary publications [6]), execute the iterative selection:
- Step 1: Identify the sample (extract or fraction) containing the highest number of unique scaffolds. Add this to the rational library list.
- Step 2: From the remaining samples, select the one that adds the greatest number of scaffolds not already present in the rational library.
- Step 3: Repeat Step 2 until a pre-defined target is met (e.g., 80%, 95%, or 100% of total scaffold diversity from the full library).
Protocol 2: Affinity Selection Mass Spectrometry (AS-MS) for Target-Specific Library Screening
AS-MS is a powerful complementary technique to screen rational libraries against specific protein targets, identifying binders directly from complex mixtures [51].
I. Assay Setup & Incubation
- Choose Assay Format: Decide between solution-based (e.g., ultrafiltration) or immobilized-target (e.g., ligand fishing on magnetic beads) formats [51].
- Prepare Target & Library: Incubate the purified target protein (at low µM concentration) with the pooled or individual samples from your rational library. Use a buffer that maintains protein stability and activity. A target-to-ligand molar excess is typical to avoid competition [51].
II. Separation of Target-Ligand Complexes
- For Ultrafiltration: Transfer the incubation mixture to an ultrafiltration device (MW cutoff suitable to retain the protein). Centrifuge to separate the flow-through (unbound compounds) from the retentate (protein-ligand complexes) [51].
- For Immobilized Target: Use a magnet (for magnetic beads) or centrifugation to separate the beads with captured target-ligand complexes from the supernatant.
III. Washing, Dissociation, and Analysis
- Wash: Gently wash the retained complexes with buffer to remove non-specifically bound materials.
- Dissociate Ligands: Elute bound ligands from the target. Methods include:
- Denaturing with organic solvent (e.g., 50% methanol with 1% formic acid).
- Displacing with a high-affinity competitor.
- Changing pH [51].
- LC-MS/MS Analysis: Analyze the eluent using LC-MS/MS. Identify putative ligands by comparing the MS features in the eluent sample to those in a control sample (target incubated without library or with inactive matrix). Features significantly enriched in the eluent are potential binders.
Diagram: Affinity Selection Mass Spectrometry (AS-MS) Workflow. A target-specific screening method complementary to phenotypic assays.
The Scientist's Toolkit: Essential Reagents & Solutions
Table: Key Research Reagent Solutions for Rational NP Library Design
| Tool / Reagent | Function / Description | Application in Workflow |
|---|---|---|
| High-Resolution LC-MS/MS System | Instrumentation for untargeted metabolomics. Provides accurate mass and fragmentation data. | Core data generation for molecular networking and library design [6] [50]. |
| GNPS (Global Natural Products Social) Platform | Open-access web platform for MS/MS data processing, molecular networking, and library search. | Clustering MS/MS spectra into molecular families; dereplication [6]. |
| Custom R/Python Scripts for Diversity Selection | Algorithms for iterative sample selection based on scaffold diversity. | The computational engine for building the minimal rational library from MS/MS data [6]. |
| Standardized Solid-Phase Extraction (SPE) Cartridges | For pre-fractionation of crude extracts by polarity (e.g., C18, Diol, Ion-Exchange). | Creating pre-fractionated sub-libraries to reduce sample complexity [2]. |
| Ultrafiltration Devices (e.g., 10kDa MWCO) | Filters that retain protein-ligand complexes while allowing unbound small molecules to pass. | Key component for solution-based Affinity Selection Mass Spectrometry (AS-MS) [51]. |
| Magnetic Beads with Immobilization Chemistry | Beads functionalized with NHS, glutathione, or Ni-NTA for immobilizing protein targets. | Used in immobilized-target AS-MS ("ligand fishing") assays [51]. |
| ITS/16S rRNA PCR Primers & Sequencing | Tools for genetic barcoding of fungal or bacterial isolates. | Integrating phylogenetic information with metabolomic data for bifunctional library design [49]. |
| Bioassay Kits & Reagents (e.g., for P. falciparum, Enzymes) | Validated phenotypic and target-based assay components. | Screening the rational library to confirm enhanced hit rates and bioactive retention [6]. |
Ensuring Robustness: Optimizing LC-MS/MS Parameters and Overcoming Analytical Pitfalls
The integration of Liquid Chromatography with Tandem Mass Spectrometry (LC-MS/MS) has become indispensable in modern natural product research, particularly for the rational design of screening libraries. This approach directly addresses a critical bottleneck: the prohibitive cost and time associated with high-throughput screening of vast, chemically redundant natural product extract libraries [19]. By enabling the detailed profiling of complex mixtures, LC-MS/MS facilitates a strategic shift from brute-force screening to intelligent, data-driven library minimization.
Rational library design aims to maximize chemical diversity while drastically reducing the number of extracts to be screened. This is achieved by using LC-MS/MS data to cluster molecules based on structural similarity via molecular networking and then selecting a subset of extracts that best represent this diversity [19]. The success of this strategy is highly dependent on the quality and information content of the underlying LC-MS/MS data. Suboptimal method parameters can lead to poor ionization, inadequate separation, or insufficient fragmentation, resulting in a loss of critical chemical information and a failure to capture the true diversity of the library. Consequently, meticulous optimization of ionization modes, source parameters, and chromatographic conditions is not merely a technical exercise but a fundamental prerequisite for constructing robust, miniaturized libraries that retain bioactive potential and accelerate the drug discovery pipeline [19] [52].
Core Optimization Principles for Informative LC-MS/MS Data
The primary goal of method optimization in this context is to generate data that accurately reflects the chemical composition of natural product extracts. This involves maximizing the number of detected ion features, achieving clean precursor and fragment ion spectra for confident molecular networking, and ensuring chromatographic resolution to reduce ion suppression.
A study on rational library minimization demonstrated the impact of a well-optimized method. Starting with a library of 1,439 fungal extracts, LC-MS/MS profiling and molecular networking identified unique molecular scaffolds. An algorithm was then used to select a minimal subset of extracts that captured the maximum scaffold diversity [19].
Table 1: Performance of a Rational LC-MS/MS-Based Library Minimization Strategy [19]
| Metric | Full Library (1,439 extracts) | Rational Library (80% Diversity) | Rational Library (100% Diversity) |
|---|---|---|---|
| Number of Extracts | 1,439 | 50 | 216 |
| Library Size Reduction | - | 96.5% | 85.0% |
| P. falciparum Hit Rate | 11.26% | 22.00% | 15.74% |
| Retention of Bioactive Correlates | 266 molecules | 223 molecules (84%) | 260 molecules (98%) |
The data shows that a rationally designed library of only 50 extracts (96.5% smaller) not only captured 80% of chemical scaffolds but also doubled the bioactivity hit rate against Plasmodium falciparum. This counterintuitive result—increased hit rate with a smaller library—is attributed to the removal of chemical redundancy, allowing true bioactive leads to be identified more efficiently [19]. This underscores that optimization aims not just to "see more," but to "understand better" for smarter downstream decisions.
Systematic Optimization Protocols
Ionization Mode and Source Parameter Optimization
The choice of ionization mode is the most significant decision in method development [53] [54]. A systematic, empirical approach is required, as rules of thumb can be misleading for novel natural products.
Protocol: Empirical Ionization Mode and Source Optimization
- Standard Preparation: Prepare a mixed standard solution (approx. 1 µg/mL) containing representative analytes dissolved in a 50:50 mixture of LC-MS grade organic solvent (e.g., acetonitrile) and aqueous buffer [53].
- Infusion Screening: Use a syringe pump or a tee-piece to infuse the standard directly into the ion source at a low, constant flow rate (e.g., 10-25 µL/min) [55]. Simultaneously, introduce the 50:50 mobile phase blend.
- Polarity and Mode Test: Perform infusion experiments in both positive and negative polarities for Electrospray Ionization (ESI). For broader coverage, also test Atmospheric Pressure Chemical Ionization (APCI) for less polar compounds [53] [54].
- Parameter Tuning: Using the instrument's tuning or optimization routine, systematically adjust key source parameters to maximize the signal for the precursor ion [M+H]+ or [M-H]-. Critical parameters include:
- Capillary/Sprayer Voltage: Optimizes droplet charging and ion emission. Avoid the absolute maximum; seek a stable plateau [54].
- Nebulizer Gas (GS1): Shears liquid into fine droplets. Optimize for stable spray and signal intensity [55].
- Drying Gas (GS2) & Temperature: Facilitates desolvation of charged droplets. Increase with higher aqueous flows [54] [55].
- Declustering Potential (DP): Removes solvent adducts. Too high a value can cause in-source fragmentation [55].
- Selection Criteria: The optimal ionization mode is identified by the greatest signal intensity, stability, and the cleanest precursor ion spectrum with minimal in-source fragmentation.
Table 2: Guidance for Ionization Mode Selection and Key Parameters [53] [54] [55]
| Ionization Mode | Best For Analyte Properties | Key Optimizable Source Parameters | Typical Optimization Goal |
|---|---|---|---|
| ESI (+) / (-) | Polar, ionizable compounds; medium to high molecular weight; natural products (alkaloids, glycosides). | Capillary Voltage, Nebulizer Gas, Drying Gas & Temp, Declustering Potential (DP) | Max stable signal for [M+H]+ or [M-H]-; minimal in-source fragmentation. |
| APCI (+) / (-) | Less polar, thermally stable compounds; lower molecular weight. | Corona Needle Current, Vaporizer Temp, Nebulizer Gas, DP | Efficient gas-phase chemical ionization; good for compounds with low proton affinity. |
| APPI | Non-polar, aromatic compounds (e.g., certain polyketides, carotenoids). | Lamp Energy, Dopant type/flow, Vaporizer Temp | Effective photoionization and charge transfer for non-polar species. |
Chromatographic Separation Optimization
Chromatography is critical for separating isomers and reducing matrix effects that cause ion suppression. The objective is to achieve baseline resolution of critical pairs while maintaining a reasonable analysis time.
Protocol: Gradient Optimization for Complex Natural Product Extracts
- Column and Mobile Phase Selection: Start with a reversed-phase C18 column. Use volatile buffers compatible with MS, such as 5-10 mM ammonium formate or acetate. Acidify with 0.1% formic acid for positive mode or add ammonia for negative mode [56].
- Initial Scouting Run: Inject a representative natural product extract. Run a broad, generic gradient (e.g., 5% to 100% organic over 20-30 minutes) at a moderate flow rate [53].
- Peak Capacity Assessment: Evaluate the Total Ion Chromatogram (TIC) and Base Peak Chromatogram (BPC). Identify regions of co-elution and peak broadening.
- Gradient Fine-Tuning: Adjust gradient steepness (%B/min) in crowded regions to improve separation. The optimal gradient time (t_g) can be estimated using the equation: t_g = (1/S) * k* * Δφ * (VM/F), where S is a molecular weight-dependent factor, k* is the desired gradient retention factor (start with 5), Δφ is the change in organic phase, VM is the column void volume, and F is the flow rate [53].
- Buffer and pH Evaluation: Compare different buffers (e.g., ammonium formate vs. acetate) and pH values. As demonstrated in a method for dye analysis, ammonium formate with 0.1% formic acid often provides superior sensitivity and peak shape for a wide range of analytes compared to ammonium acetate [56].
Table 3: Impact of Mobile Phase Buffer on LC-MS/MS Performance (Example Data) [56]
| Buffer System (5mM) | Relative Peak Response | Peak Shape (Symmetry) | Remarks |
|---|---|---|---|
| Ammonium Formate + 0.1% FA | High (Reference = 100%) | Good (1.0 - 1.2) | Optimal sensitivity and resolution for tested dyes. |
| Ammonium Acetate | Low (40-60%) | Poor (>1.5) | Broader peaks, reduced signal intensity. |
MS/MS Parameter Optimization for Molecular Networking
High-quality MS/MS spectra are the raw material for molecular networking, which groups compounds by structural similarity [19]. Collision energy (CE) is the most critical parameter.
Protocol: Collision Energy Optimization for Untargeted MS/MS
- Precursor Selection: From an LC-MS run of a standard or sample, select the precursor ions of interest.
- CE Ramping: Using the instrument's automated optimization function or manual tuning, acquire product ion scans across a range of collision energies (e.g., 10-50 eV in steps of 5 eV) [55].
- Spectrum Evaluation: The optimal CE provides a rich fragmentation pattern with several informative product ions while retaining about 10-15% of the precursor ion intensity [53]. Avoid CE values that completely destroy the precursor or produce only one dominant fragment.
- Implementation for Untargeted Analysis: For data-dependent acquisition (DDA), apply a collision energy ramp (e.g., 20-40 eV) or a formula-based CE (e.g., CE = (slope) * (m/z) + (offset)) to ensure good fragmentation across a wide mass range.
Application to Rational Natural Product Library Design: A Detailed Workflow
The optimized parameters are integrated into a cohesive workflow for rational library design. This workflow transforms raw LC-MS/MS data into a strategy for selecting a maximally diverse, minimal extract subset.
Diagram: Rational natural product library design workflow.
Workflow Protocol:
- LC-MS/MS Profiling: Analyze all crude extracts in the full library using the optimized untargeted LC-MS/MS method, typically in data-dependent acquisition (DDA) mode [19].
- Molecular Networking: Process the raw data through platforms like GNPS (Global Natural Products Social Molecular Networking). This clusters MS/MS spectra based on similarity, creating a visual map where each node represents a consensus MS/MS spectrum (a molecular family or scaffold) [19].
- Diversity-Based Selection: Use custom algorithms (e.g., in R or Python) to select extracts. The algorithm iteratively picks the extract contributing the most new, unique molecular network nodes (scaffolds) not already represented in the growing mini-library. This continues until a target percentage of total scaffold diversity is captured [19].
- Validation: Screen the rationally designed mini-library in biological assays. Validate success by confirming (a) an increased bioactivity hit rate compared to the full library or random selection, and (b) a high retention rate of molecular features statistically correlated with bioactivity in the full library [19].
The Scientist's Toolkit: Essential Reagents and Materials
Table 4: Key Research Reagent Solutions for LC-MS/MS Method Optimization
| Reagent/Material | Function in Optimization | Key Considerations & Examples |
|---|---|---|
| Volatile Buffers (Ammonium formate, ammonium acetate) | Provides pH control and ionic strength for chromatography without causing source contamination. Essential for reproducible ionization [53] [56]. | Use LC-MS grade. Concentration typically 2-10 mM. Acidify with 0.1% formic acid (positive mode) or make basic with ammonia (negative mode). |
| LC-MS Grade Solvents (Acetonitrile, Methanol, Water) | Mobile phase components. Purity is critical to minimize background noise and maintain system stability. | Low UV absorbance, low particle count, and minimal non-volatile residues. |
| Infusion Syringe Pump & Tee-union | Allows direct introduction of analyte solution into the ion source for parameter tuning without chromatography [55]. | Enables precise control of flow rate (µL/min) for stable signal during source and MS/MS optimization. |
| Representative Analytic Standards | Used as probes to evaluate ionization efficiency, chromatographic separation, and fragmentation across different compound classes. | Should include acidic, basic, neutral, and zwitterionic compounds relevant to the natural product library. |
| Solid-Phase Extraction (SPE) Cartridges | For sample clean-up to reduce matrix complexity and ion suppression, especially for crude extracts [56]. | Various chemistries (C18, HLB, Ion Exchange) are used to selectively enrich or exclude compound classes. |
| Molecular Networking Software (e.g., GNPS) | The computational engine for clustering MS/MS data by structural similarity, enabling diversity assessment [19]. | Requires data in specific formats (.mzML, .mzXML). Outputs visual networks used for library design decisions. |
Diagram: Systematic sequence for LC-MS/MS method optimization.
Diagram: Decision pathway for initial ionization mode selection.
In the context of rational natural product library design, liquid chromatography-tandem mass spectrometry (LC-MS/MS) is indispensable for profiling the complex chemical space of biological extracts. A primary objective of this broader thesis is to employ LC-MS/MS data to minimize library redundancy by selecting extracts with maximal scaffold diversity, thereby increasing bioassay hit rates and accelerating drug discovery [6]. However, the accuracy and reproducibility of this metabolomics-driven approach are critically threatened by ion suppression, a pervasive matrix effect where co-eluting compounds interfere with the ionization efficiency of target analytes in the electrospray ion source [57].
Ion suppression leads to diminished or variable signal response, which can result in the misrepresentation of a natural product's abundance, the failure to detect low-abundance bioactive scaffolds, and ultimately, the flawed design of a screening library. The phenomenon is particularly acute in the analysis of crude natural product extracts, which contain a wide dynamic range of compounds, including salts, phospholipids, and primary metabolites [58]. This application note details validated strategies in sample cleanup and mobile phase optimization to mitigate ion suppression, ensuring the fidelity of LC-MS/MS data for robust, rational library design.
Strategic Approaches for Mitigation
Effective management of ion suppression requires a multi-pronged strategy that begins with sample preparation and extends through chromatographic and instrumental optimization.
2.1. Sample Cleanup Strategies The goal of sample cleanup is to selectively remove or reduce matrix interferents while retaining the target natural product analytes.
- Targeted Phospholipid Depletion: Phospholipids are major contributors to ion suppression and source fouling in analyses of biological extracts [59]. HybridSPE-Phospholipid technology utilizes zirconia-coated silica to selectively bind phospholipids via Lewis acid-base interactions with their phosphate groups. This process, performed in a 96-well plate format, concurrently precipitates proteins. Compared to standard protein precipitation, this technique significantly reduces matrix interference, leading to a dramatic increase in analyte signal intensity and reproducibility [59].
- Solid-Phase Microextraction (SPME): Biocompatible SPME (bioSPME) offers an alternative "targeted analyte isolation" approach. A fiber with a C18-modified phase is exposed to the sample, concentrating small molecule analytes while excluding larger matrix components like proteins and phospholipids due to a protective biocompatible binder [59]. This method simultaneously cleans and concentrates the sample, markedly improving the signal-to-noise ratio.
- Comprehensive Chemical Isotope Labeling (CIL): While not a cleanup method per se, CIL is a powerful pre-analysis strategy that chemically tags metabolite classes (e.g., amines, phenols, hydroxyls) with a reagent like dansyl chloride. This labeling increases analyte hydrophobicity and ionization efficiency, effectively reducing relative ion suppression and enhancing detectability for polar metabolites [60]. A two-channel mixing strategy for amine/phenol and hydroxyl submetabolomes can further improve throughput [60].
2.2. Mobile Phase and Chromatographic Optimization Chromatographic separation is the first line of defense against ion suppression by temporally separating analytes from interferents.
- Mobile Phase Selection: The use of volatile buffers such as ammonium formate or ammonium acetate is preferred over non-volatile salts (e.g., phosphate buffers), as they enhance spray stability and prevent source contamination [61]. Buffer concentration and pH should be optimized to influence the analyte's ionization state and retention, potentially shifting it away from suppression zones identified via post-column infusion experiments [57].
- Chromatographic Mode Selection: The separation mechanism should be matched to the chemical space of interest. Reversed-phase (C18) chromatography is standard but may not resolve very polar interferents. Hydrophilic interaction liquid chromatography (HILIC) is a complementary mode for polar compounds [58]. Notably, supercritical fluid chromatography (SFC) has demonstrated different selectivity, often eluting phospholipids and salts in different regions compared to LC, and can be a valuable tool for reducing matrix effects for certain analyte classes [62].
- Column Chemistry and Gradient Optimization: Selecting a column with appropriate selectivity (e.g., pentafluorophenyl, F5) can alter elution order to separate analytes from critical interferents [59]. Extending gradient run times or altering the organic solvent ramp can improve resolution, though at the cost of throughput.
Table 1: Comparison of Sample Preparation Techniques for Mitigating Ion Suppression
| Technique | Mechanism of Action | Key Advantage | Consideration for NP Libraries |
|---|---|---|---|
| HybridSPE-Phospholipid [59] | Selective binding and removal of phospholipids via Lewis acid-base chemistry. | Dramatically reduces a major source of suppression; high-throughput 96-well format. | Ideal for prefractionated or crude extracts from cell-rich sources (fungi, bacteria). |
| Biocompatible SPME [59] | Equilibrium-based enrichment of small molecules while excluding large matrix components. | Simultaneous cleanup and concentration; non-destructive to sample. | Excellent for concentrating low-abundance scaffolds from dilute extracts. |
| Protein Precipitation | Solvent-induced denaturation and removal of proteins. | Simple, fast, and low-cost. | Ineffective against phospholipids and small molecule interferents; can exacerbate suppression [59]. |
| Chemical Isotope Labeling [60] | Derivatization of specific metabolite classes to boost ionization efficiency. | Enhances sensitivity and detectability for targeted chemical classes. | Can be used to strategically profile key natural product functional groups (amines, phenols). |
Experimental Protocols
3.1. Protocol for Post-Column Infusion to Diagnose Ion Suppression [57] Purpose: To visually identify regions of ion suppression/enhancement throughout the chromatographic run. Materials: LC-MS/MS system, syringe pump, T-connector, analyte standard solution. Procedure:
- Prepare a solution of a target analyte (e.g., 1 µM) in the starting mobile phase.
- Connect a syringe pump loaded with the analyte solution to a T-connector placed between the HPLC column outlet and the MS ion source.
- Start a constant post-column infusion of the analyte (e.g., 10 µL/min).
- While infusing, inject a blank, prepared sample extract (e.g., a solvent-blank fungal extract) onto the LC column and start the analytical gradient method.
- Monitor the selected reaction monitoring (SRM) or MRM trace for the infused analyte. A stable baseline indicates no suppression. A dip in the baseline indicates ion suppression from co-eluting matrix components; a rise indicates ion enhancement.
3.2. Protocol for Targeted Phospholipid Removal Using HybridSPE-Phospholipid Plates [59] Purpose: To selectively remove phospholipids from plasma, serum, or cellular natural product extracts. Materials: HybridSPE-Phospholipid 96-well plate, positive pressure manifold, centrifuge, organic solvents (acetonitrile, methanol). Procedure:
- Load: Transfer 50-100 µL of sample (e.g., fungal culture broth extract) to the well of a HybridSPE-Phospholipid plate.
- Precipitate & Bind: Add 300 µL of a 3:1 (v/v) mixture of acetonitrile or methanol containing 1% formic acid (precipitation solvent) to the sample. Immediately mix thoroughly by repeated draw-dispense or vortex agitation for 1 minute. This step precipitates proteins and simultaneously promotes binding of phospholipids to the zirconia phase.
- Elute: Place the plate on a positive pressure manifold. Apply pressure to collect the eluent (~350 µL) into a clean collection plate. The target analytes are in this flow-through fraction; phospholipids are retained on the sorbent.
- Optional Evaporation/Reconstitution: Evaporate the eluent to dryness under a gentle nitrogen stream at 40°C. Reconstitute in an appropriate volume of starting mobile phase for LC-MS/MS analysis.
3.3. Protocol for Evaluating and Correcting Suppression via IROA-IS [58] Purpose: To quantitatively measure and correct for ion suppression in non-targeted metabolomics using an Isotopic Ratio Outlier Analysis Internal Standard (IROA-IS). Materials: IROA-IS library (95% ¹³C), IROA Long-Term Reference Standard (LTRS), ClusterFinder software. Procedure:
- Spike and Prepare: Spike a constant, known amount of the IROA-IS into all experimental samples and quality controls prior to extraction.
- LC-MS/MS Analysis: Analyze samples alongside the IROA-LTRS using the standard untargeted profiling method.
- Data Processing: Process data using ClusterFinder software. The algorithm identifies true metabolites via their signature IROA isotopolog ladder (paired ¹²C and ¹³C peaks).
- Suppression Calculation & Correction: For each detected metabolite, the software applies a proprietary algorithm (Eq. 1 in the source) that uses the signal of the spiked ¹³C internal standard to calculate and correct for the ion suppression experienced by the endogenous ¹²C analyte signal, yielding a suppression-corrected peak area.
Application in Rational Natural Product Library Design
The quantitative data integrity ensured by these mitigation strategies is fundamental to the computational pipeline for rational library design. Research demonstrates that an LC-MS/MS-based method, which groups MS/MS spectra into molecular scaffolds, can reduce a library of 1,439 fungal extracts to a rationally selected 216-extract library while retaining 100% of the original scaffold diversity—a 6.6-fold reduction [6]. Critically, this rational library not only preserved bioactive compounds but also increased bioassay hit rates against diverse targets like Plasmodium falciparum and viral neuraminidase, as interfering chemical redundancy was minimized [6].
Table 2: Performance of a Rational LC-MS/MS-Based Library Design Strategy [6]
| Metric | Full Library (1,439 Extracts) | Rational Library (80% Diversity - 50 Extracts) | Rational Library (100% Diversity - 216 Extracts) |
|---|---|---|---|
| Scaffold Diversity Retained | 100% (Baseline) | 80% | 100% |
| Hit Rate vs. P. falciparum | 11.26% | 22.00% | 15.74% |
| Hit Rate vs. Neuraminidase | 2.57% | 8.00% | 5.09% |
| Features Correlated to Anti-P. falciparum Activity | 10 features | 8 retained | 10 retained |
This success is contingent on high-quality MS/MS spectra. Ion suppression can distort spectral abundance and introduce noise, compromising the molecular networking that underpins scaffold grouping. Therefore, implementing the sample cleanup and chromatographic strategies outlined above is not merely an analytical best practice but a prerequisite for generating the reliable data that drives effective library minimization.
Diagram 1: Comprehensive LC-MS/MS Workflow for Rational Library Design Highlighting Ion Suppression Mitigation Points
Diagram 2: Mechanism of Ion Suppression in ESI
The Scientist's Toolkit: Essential Reagents & Materials
Table 3: Key Research Reagent Solutions for Ion Suppression Mitigation
| Item | Function in Mitigating Ion Suppression | Application Context |
|---|---|---|
| HybridSPE-Phospholipid Plates/Cartridges [59] | Selective removal of phospholipids via zirconia-phosphate Lewis acid-base interaction. | Sample cleanup for extracts from plasma, serum, or cellular sources (fungal/bacterial). |
| Biocompatible SPME (bioSPME) Fibers [59] | Equilibrium-based extraction concentrating small molecules while excluding macromolecular matrix. | Cleanup and concentration of analytes from complex biological fluids or crude extracts. |
| Chemical Isotope Labeling Kits (e.g., DnsCl) [60] | Derivatization of specific metabolite functional groups to enhance ionization efficiency and detectability. | Targeted profiling of amine/phenol/hydroxyl-containing natural products in metabolomic studies. |
| IROA Internal Standard (IROA-IS) Library [58] | A 95% ¹³C-labeled internal standard mix for quantitative measurement and correction of ion suppression. | Non-targeted metabolomics for absolute quantification and rigorous suppression correction. |
| Volatile Buffer Salts (Ammonium Formate/Acetate) [61] | MS-compatible mobile phase additives that improve spray stability without causing source contamination. | Mobile phase preparation for both reversed-phase and HILIC chromatography. |
| Specialized LC Columns (e.g., F5, HILIC) [62] [59] | Chromatographic phases offering alternative selectivity to shift analyte retention away from interferents. | Method development to resolve analytes from co-eluting matrix components. |
The success of rational natural product library design using LC-MS/MS is fundamentally dependent on the integrity of the underlying analytical data. High data quality directly influences the accuracy of chemical dereplication, molecular networking, and the subsequent selection of extracts for screening libraries. This application note details a comprehensive quality assurance (QA) framework, integrating the systematic use of blanks, quality control (QC) samples, and system suitability tests (SSTs) to ensure the reliability of LC-MS/MS data within this research context. Adherence to these protocols safeguards against false positives/negatives, ensures consistent instrument performance, and provides the validated data necessary for confident library minimization and bioactive candidate prioritization [63] [19].
Natural products (NPs) remain a preeminent source of novel drug leads and chemical scaffolds [19]. Modern discovery pipelines employ untargeted LC-MS/MS to profile vast libraries of crude extracts, generating complex datasets used for chemical annotation and biological correlation. A transformative advancement is the rational design of minimized screening libraries, which uses MS/MS spectral similarity and molecular networking to maximize chemical diversity while drastically reducing the number of extracts requiring biological testing [19].
The efficacy of this strategy is entirely contingent on the accuracy, consistency, and reliability of the primary LC-MS/MS data. Poor data quality can lead to misannotation of compounds, erroneous network construction, and the inadvertent loss of bioactive scaffolds or the inclusion of redundant ones. Consequently, robust QA is not merely a best practice but a critical component of the research methodology [64].
This document outlines a tiered QA system tailored for NP research:
- Blanks: To detect and eliminate background interference and carryover.
- QC Samples: To monitor and validate the stability and performance of the entire analytical system over time.
- System Suitability Tests (SSTs): To verify instrument readiness prior to committing valuable sample batches.
Implementing this framework creates a "fit-for-purpose" validation state for data used in rational library design, directly supporting the broader thesis that high-fidelity chemical data enables more efficient and productive drug discovery campaigns [19] [65].
The Role and Protocol for Analytical Blanks
Blanks are essential diagnostic tools used to identify contamination arising from solvents, reagents, sample preparation surfaces, or the LC-MS/MS system itself.
2.1 Types of Blanks and Their Purpose
- Method/Reagent Blank: Consists of the reconstitution solvent processed through the entire sample preparation protocol. It identifies contamination introduced during extraction, drying, or reconstitution.
- Instrument/Injector Blank: A pure solvent injection. It diagnoses carryover from the autosampler or LC system.
- Carryover Blank: A blank injection immediately following a high-concentration standard or sample. It specifically assesses and validates the effectiveness of the autosampler wash protocol and chromatographic separation [66].
2.2 Protocol for Integration of Blanks A standardized sequence should be embedded within every batch:
- Start of Batch: Inject one instrument blank.
- Pre-Calibration: Inject one method blank.
- Post-High Concentration Sample: Inject one carryover blank (e.g., after the upper limit of quantitation calibrator).
- End of Batch: Inject one instrument blank.
2.3 Acceptance Criteria and Action
- Criteria: The chromatogram for the target analyte(s) in a blank must show no peak with a signal-to-noise ratio (S/N) ≥ 3 at the expected retention time.
- Action: If a significant peak is detected (> 30% of the lower limit of quantitation or S/N ≥ 10), the source must be investigated. The preceding sample/calibrator may be flagged as potentially compromised, and the system (e.g., autosampler needle wash, column) must be cleaned or replaced before proceeding [66].
Quality Control Samples for Longitudinal Performance Monitoring
QC samples are used to assess the precision and accuracy of the analytical method throughout a batch and across different batches over time. In NP research, where absolute quantitation may be secondary to relative abundance and feature detection, QCs ensure system stability.
3.1 QC Sample Design and Preparation
- Matrix-Matched QCs: Ideally, prepare QC samples in a pooled, representative natural product extract matrix (e.g., a pooled fungal extract) at low, mid, and high concentration levels for key marker compounds. If unavailable, use the standard preparation solvent.
- Pooled QC: A single QC prepared by pooling a small aliquot of every sample in the study. This is injected repeatedly throughout the batch to monitor global system stability for untargeted profiling [63].
- Preparation: Prepare large, homogeneous batches of QC materials, aliquot, and store under conditions identical to study samples to ensure long-term stability.
3.2 Placement and Frequency QC samples should be distributed evenly throughout the analytical run. A general guideline is to include a minimum of 5% of the total injections as QCs, with at least one QC at the beginning, middle, and end of the batch. For high-throughput NP profiling, a QC injection after every 10-15 experimental samples is recommended [63].
3.3 Key Performance Parameters and Acceptance Criteria The following table outlines core metrics for monitoring LC-MS/MS performance in an untargeted NP profiling context.
Table 1: Key Quality Control Parameters and Acceptance Criteria for Untargeted Profiling [63] [65]
| Parameter | Description | Typical Acceptance Criterion |
|---|---|---|
| Retention Time Shift | Drift in the elution time of marker compounds. | ≤ ± 0.1 min or ≤ ± 2% RSD across batch. |
| Peak Area Precision | Variability in the response of marker compounds in repeated QC injections. | ≤ 20% RSD (for low abundance); ≤ 15% RSD (for mid/high abundance). |
| Mass Accuracy | Deviation between measured and theoretical m/z for lock-mass or internal reference ions. | ≤ ± 5 ppm (for high-resolution MS). |
| Chromatographic Peak Width | Measure of column performance and integrity. | ≤ 20% increase at baseline (e.g., 50% height). |
| Total Ion Chromatogram (TIC) Background | Signal intensity in regions without peaks. | Stable and low; significant increase indicates contamination. |
System Suitability Tests: Ensuring Pre-Run Readiness
An SST is a specific test sample analyzed to verify that the entire LC-MS/MS system meets the performance standards required for a particular method before a batch of valuable samples is processed [66].
4.1 SST Design for Natural Product Analysis
- Composition: The SST should contain a small panel (3-5) of chemically diverse standard compounds relevant to the study (e.g., alkaloids, flavonoids, terpenoids) at a defined concentration, along with any internal standards. This checks specificity and sensitivity across different compound classes [66].
- Concentration: A concentration at 2-3x the estimated detection limit for the method provides a robust signal to assess sensitivity and precision [66].
4.2 SST Protocol and Evaluation
- Preparation: The SST solution is prepared in advance, aliquoted, and stored for daily use.
- Injection Sequence: Typically, the SST is run as part of a short pre-batch sequence: Reagent Blank → Reagent Blank → SST → Carryover Blank [66].
- Immediate Assessment: Prior to running study samples, the analyst reviews the SST chromatogram against pre-defined, method-specific criteria.
Table 2: System Suitability Test Pass/Fail Criteria and Troubleshooting Guide [66]
| Parameter | Pass Criteria | Common Cause of Failure | Initial Troubleshooting Action |
|---|---|---|---|
| Peak Area Intensity | Within ± 25% of historical average. | Loss of MS sensitivity; incorrect sample vial; preparation error. | Check vial placement/volume; inspect ion source; verify tuning. |
| Retention Time | Within ± 0.1 min of expected. | Incorrect mobile phase/gradient; column degradation; temperature fluctuation. | Verify mobile phase composition and gradient program; check column condition. |
| Peak Shape (Asymmetry) | 0.8 - 1.5. | Column void/degradation; sample solvent mismatch; injector issue. | Examine column pressure; ensure SST solvent matches initial mobile phase. |
| Signal-to-Noise (S/N) | ≥ 10 for target concentration. | Source contamination; low analyte concentration; detector issue. | Clean ion source; verify SST concentration. |
| Chromatographic Resolution | Baseline separation (R > 1.5) for critical pairs. | Column selectivity loss; incorrect mobile phase pH. | Replace column; adjust mobile phase pH. |
| Carryover in Blank | Absent (S/N < 3). | Ineffective needle wash; column contamination. | Perform intensive autosampler wash; apply strong column wash gradient. |
Integrated Quality Assurance Workflow for NP Library Profiling
The following diagram illustrates the logical integration of blanks, QCs, and SSTs into a coherent workflow for ensuring data quality in natural product LC-MS/MS profiling.
Diagram 1: Integrated LC-MS/MS QA Workflow for NP Research. This workflow ensures only data passing stringent quality gates is used for downstream library design.
From Quality Data to Rational Library Design: A Practical Workflow
High-quality, validated LC-MS/MS data enables the core processes of rational library minimization. The following diagram maps the transformation of raw data into a designed screening library.
Diagram 2: Data Flow from QA-Checked MS Data to Rational Library. QA metrics directly inform data preprocessing and algorithm confidence.
The Scientist's Toolkit: Essential Reagents and Materials
Table 3: Key Research Reagent Solutions for LC-MS/MS QA in NP Studies
| Item | Function & Description | Critical Quality Attribute |
|---|---|---|
| Ultra-Pure Solvents | Used for mobile phases, sample reconstitution, and blanks. Minimizes chemical noise and background interference. | LC-MS grade; low UV cutoff; minimal volatile impurities. |
| Certified Reference Standards | Pure compounds for preparing calibrators, SSTs, and spiked QC samples. Essential for identity confirmation and performance testing. | High chemical purity (≥95%); verified identity (NMR/MS); stability under storage conditions. |
| Stable Isotope-Labeled Internal Standards | Added to all samples, blanks, and QCs to correct for matrix effects and recovery variability during sample preparation. | Identical chemical behavior to analyte; distinct mass shift; high isotopic purity. |
| Characterized Pooled Matrix | A representative, well-characterized natural product extract used to prepare matrix-matched QCs, simulating the study sample composition. | Chemical profile representative of the sample library; homogeneity; stability. |
| System Suitability Test Mix | A ready-to-use solution containing target analytes at defined concentrations for daily instrument performance verification [66]. | Long-term stability; concentration accuracy; compatibility with the analytical method. |
| Quality Control Materials | Low, mid, and high concentration samples used to monitor precision and accuracy across and between batches [63]. | Homogeneity; stability over the study duration; commutability with study samples. |
The integration of liquid chromatography-tandem mass spectrometry (LC-MS/MS) with computational metabolomics has become a cornerstone in the modernization of natural product drug discovery [6]. Within the context of a broader thesis on LC-MS/MS for rational natural product library design, this work addresses a critical, yet often underexplored, component: the systematic evaluation of how variations in computational networking parameters and algorithm settings impact the outcome and efficiency of library design. Rational library design aims to maximize chemical diversity while minimizing redundancy, thereby increasing bioassay hit rates and accelerating the identification of novel bioactive scaffolds [6]. The core process involves analyzing untargeted LC-MS/MS data through molecular networking—clustering MS/MS spectra based on fragmentation similarity—and applying selection algorithms to choose a minimal subset of extracts representing maximal scaffold diversity [6].
The performance of this pipeline is not deterministic; it is governed by a suite of user-defined parameters in both the networking (e.g., cosine score thresholds, minimum matched peaks) and algorithmic selection stages. Sensitivity Analysis (SA) is the formal study of how uncertainty in the output of a model or system can be apportioned to different sources of uncertainty in its inputs [67]. In this application, SA provides the methodological framework to rigorously test the robustness of the library design, understand relationships between input parameters and output metrics (e.g., library size, diversity coverage, bioactive retention), and ultimately optimize the workflow. By identifying which parameters exert the most influence and which have negligible effects, researchers can prioritize calibration efforts, simplify models, and enhance the reliability and communicability of their rational design process [67].
Foundational Principles of Sensitivity Analysis in Computational Workflows
Sensitivity analysis moves beyond a simple "one-off" optimization to provide a comprehensive map of the parameter space. Its primary objectives within a computational workflow include [67]:
- Robustness Testing: Determining if key outputs remain stable under plausible variations of input parameters.
- Understanding Input-Output Relationships: Revealing linear, nonlinear, or interactive effects of parameters on results.
- Uncertainty Reduction: Identifying parameters that contribute most to output variance, directing focused data collection or refinement.
- Model Simplification: Fixing or eliminating parameters that have no significant effect on the output.
Several SA methodologies are applicable to the LC-MS/MS library design pipeline, each with distinct advantages:
- One-at-a-Time (OAT): The simplest approach, where one input variable is varied while others are held at baseline values [67]. While intuitive, it fails to detect interactions between parameters and does not explore the full input space.
- Local Derivative-Based Methods: These estimate the local sensitivity by computing partial derivatives of the output with respect to each input [67]. They are efficient for linear systems but less suited for the nonlinear relationships common in metabolomic networks.
- Global Variance-Based Methods: These are the most robust for complex systems. Methods like those of Sobol' decompose the total output variance into contributions from individual parameters and their interactions, providing a complete picture of sensitivity across the entire parameter space [67].
- Screening Methods: Techniques like the Morris method provide an efficient middle ground, offering a rank-order of parameter importance with relatively few model evaluations, making them ideal for initial screening of systems with many parameters [67].
For the rational library design workflow, a two-stage approach is recommended: an initial Morris screening to identify the most influential parameters, followed by a global variance-based analysis on that reduced set for a detailed quantification of effects and interactions.
Key Parameters in LC-MS/MS Networking and Library Selection Algorithms
The rational library design pipeline can be conceptualized as a function ( Y = f(X) ), where the output ( Y ) (e.g., final library size, hit rate) is determined by a vector of input parameters ( X ) [67]. These parameters reside in two main domains.
3.1 Molecular Networking Parameters (GNPS Workflow) Molecular networking on platforms like GNPS groups MS/MS spectra based on spectral similarity [6]. Key tunable parameters include:
- Cosine Score Threshold: The minimum similarity score for two spectra to be connected. A higher value creates stricter, more specific clusters; a lower value creates broader, more inclusive networks.
- Minimum Matched Peaks: The number of shared fragment ions required between spectra. This impacts cluster quality and resilience to noise.
- Maximum Shift in Retention Time: Allows alignment of features with similar spectra but slight retention time differences, critical for detecting analogs.
- Cluster Size Precursor Tolerance & Fragment Ion Tolerance: Mass accuracy windows for aligning precursor and fragment ions, directly affecting cluster membership.
3.2 Library Selection Algorithm Parameters The algorithm that selects extracts based on network data also contains critical settings [6]:
- Scaffold Diversity Target: The percentage of total unique molecular families (scaffolds) in the full library that the rational library aims to capture (e.g., 80%, 95%, 100%) [6].
- Selection Heuristic: The rule for choosing the next extract (e.g., "extract with the most novel scaffolds not yet represented").
- Weighting Factors: Potential weights assigned to scaffolds based on properties like network connectivity (hub vs. outlier), integrated peak area (abundance), or prior probability of bioactivity.
Table 1: Key Algorithmic and Networking Parameters for Sensitivity Analysis
| Parameter Domain | Specific Parameter | Typical Range/Values | Primary Influence on Output |
|---|---|---|---|
| Molecular Networking | Cosine Score Threshold | 0.6 - 0.9 | Number and specificity of spectral clusters (scaffolds). |
| Minimum Matched Peaks | 3 - 7 | Robustness of spectral connections; filters noise. | |
| RT Maximum Shift | 0.1 - 0.5 min | Ability to group related analogs with small RT differences. | |
| Mass Tolerance (Precursor & Fragment) | 0.01 - 0.05 Da | Accuracy of spectrum alignment and cluster formation. | |
| Library Selection | Scaffold Diversity Target | 70% - 100% | Final rational library size and comprehensiveness [6]. |
| Selection Iteration Criterion | Maximize novel scaffolds | Rate of diversity accumulation and final library composition. | |
| Scaffold Weighting | Uniform, Abundance-based, Topological | Priority given to certain chemical classes over others. |
Experimental Protocols for Parameter Sensitivity Analysis
Protocol 4.1: Systematic Parameter Perturbation for Molecular Networking
- Baseline Establishment: Process a standardized, well-characterized LC-MS/MS dataset (e.g., a published fungal extract library [6]) through the GNPS workflow using a recommended default parameter set.
- Parameter Ranges: Define a physiologically or computationally plausible range for each networking parameter (see Table 1). Use a structured sampling design (e.g., Latin Hypercube Sampling) to generate 50-100 unique parameter combinations that efficiently cover the multi-dimensional space.
- Network Generation: Execute the molecular networking job on GNPS for each parameter combination.
- Output Metrics: For each resulting network, calculate: (i) Total number of spectral clusters (scaffolds), (ii) Average cluster size, (iii) Number of singleton clusters, (iv) Network connectivity index.
- Analysis: Perform global sensitivity analysis (e.g., using the
sensobolR package) to compute Sobol' indices. This quantifies the proportion of variance in each output metric attributable to each input parameter and their interactions [67].
Protocol 4.2: Sensitivity Analysis of the Library Selection Algorithm
- Fixed Network Input: Use a single, consensus molecular network (from Protocol 4.1 defaults) as the stable input for this stage.
- Vary Selection Parameters: Apply the rational selection algorithm [6] while varying:
- Diversity Target: From 70% to 100% in 5% increments.
- Weighting Schemes: Run selection with uniform weighting, abundance weighting, and connectivity weighting.
- Performance Evaluation: For each selected rational library, calculate:
- Efficiency: Number of extracts required to hit the diversity target.
- Bioactive Retention: Using pre-existing bioassay data (blinded during selection), calculate the hit rate and the percentage of known bioactive features retained [6].
- Redundancy: Mean pairwise chemical similarity of selected extracts.
- Validation: Compare the performance of parameter-optimized libraries against 1,000 iterations of random selection of the same size to confirm superiority, as demonstrated in prior research [6].
Table 2: Exemplar Data from Sensitivity Analysis of Library Design (Modeled on Published Results [6])
| Diversity Target | Avg. Lib. Size (Rational) | Avg. Lib. Size (Random) | Avg. Hit Rate vs. P. falciparum (Rational) | Hit Rate Quartiles (Random) | Bioact. Features Retained |
|---|---|---|---|---|---|
| 80% | 50 | 109 | 22.0% | 8.0% – 14.0% | 8 / 10 |
| 95% | 116 | N/A | 19.8% | N/A | 10 / 10 |
| 100% | 216 | 755 | 15.7% | N/A | 10 / 10 |
Note: Data illustrates the non-linear relationship between diversity target and library size/hit rate. The rational algorithm consistently outperforms random selection [6].
Protocol 4.3: Integrated End-to-End Workflow Sensitivity Analysis This protocol assesses the cross-domain interaction between networking and algorithm parameters.
- Coupled Sampling: Select 3-5 representative parameter sets from the networking SA (e.g., one producing many small clusters, one producing few large clusters).
- Cascade Workflow: For each network parameter set, run the full library selection algorithm across the range of diversity targets.
- Meta-Analysis: The final output (e.g., bioactive retention rate) is now a function of both networking (N) and selection (S) parameters. Fit a meta-model (e.g., a Gaussian Process) to the results ( Y = f(N, S) ) and compute total-effect Sobol' indices to reveal if interactions between domains exist.
The Scientist's Toolkit: Essential Research Reagent Solutions
Table 3: Key Research Reagent Solutions for LC-MS/MS-Based Library Design
| Item | Function / Role in Workflow | Critical Application Note |
|---|---|---|
| LC-MS Grade Solvents (Acetonitrile, Methanol, Water with 0.1% Formic Acid) | Mobile phase for UHPLC separation; ensures minimal ion suppression and background noise. | Use high-purity solvents to prevent column degradation and MS source contamination [68]. |
| Solid Phase Extraction (SPE) Cartridges (C18, Polymer-based) | Clean-up and fractionation of crude natural product extracts prior to LC-MS/MS to reduce complexity. | Optimization of sorbent and elution protocol is crucial for reproducible metabolite recovery [68]. |
| Protein Immobilization Beads (e.g., Agarose Beads) | For affinity selection-MS (AS-MS) workflows used in validating target engagement of library hits [69]. | Bead choice affects non-specific binding and protein stability, impacting false positive/negative rates [69]. |
| Internal Standard Mix (Stable Isotope-Labeled Metabolites) | For quality control and semi-quantification across LC-MS/MS runs; monitors instrument performance. | Include standards that elute across the entire chromatographic range to assess retention time stability. |
| Bioassay Reagent Kits (e.g., for viability, enzyme activity) | Functional validation of rational library selections against phenotypic or target-based assays [6]. | Kit-based assays provide the standardized, high-throughput data needed to compute bioactivity hit rates. |
Visualization of Workflows and Logical Relationships
Diagram 1: Integrated workflow showing SA feedback loops on networking and algorithm parameters.
Diagram 2: Detailed LC-MS/MS data processing pipeline from sample prep to network input.
Diagram 3: Decision workflow for selecting appropriate sensitivity analysis methodology based on problem constraints.
The exploration of natural products for drug discovery has entered a transformative phase, shifting from brute-force screening of vast extract libraries to intelligent, scaffold-centric design [6]. This paradigm recognizes that a natural product's core molecular framework, or scaffold, is the primary determinant of its biological activity and potential for synthetic optimization. Consequently, the comprehensive detection and prioritization of unique chemical scaffolds within complex biological matrices has become a critical objective. This pursuit sits at the heart of rational natural product library design, where the goal is to maximize chemical diversity and bioactive potential while minimizing redundancy and resource expenditure [6].
Liquid chromatography-tandem mass spectrometry (LC-MS/MS) is the indispensable engine driving this scaffold-focused approach. However, a fundamental tension exists between the depth of analysis—the ability to detect low-abundance scaffolds and acquire high-quality fragment spectra for confident annotation—and the speed of analysis required to process hundreds of samples in a high-throughput workflow [70]. Traditional Data-Dependent Acquisition (DDA), while effective for abundant ions, often suffers from stochastic sampling gaps and inconsistent coverage. The emergence of Data-Independent Acquisition (DIA) strategies and intelligent, iterative acquisition methods like AcquireX presents new opportunities to overcome this bottleneck [71] [72]. This application note details protocols and strategies for optimizing MS/MS acquisition parameters to strategically balance depth and speed, thereby enabling comprehensive scaffold detection for the construction of lean, diverse, and bioactive-enriched natural product screening libraries.
Core Concepts and Strategic Framework
The Scaffold as the Unit of Diversity
In rational library design, the scaffold is prioritized over individual molecules. Molecules sharing a core scaffold often exhibit similar biological properties, and diversifying core structures increases the probability of discovering novel bioactive motifs [6]. Advanced LC-MS/MS workflows enable scaffold detection through molecular networking, where MS/MS spectral similarity is used to cluster compounds into scaffold groups without requiring initial structural elucidation [6]. This approach efficiently maps the chemical landscape of natural product extracts, focusing on the underlying architectural blueprints rather than every decorative variation.
Acquisition Philosophies: DDA vs. DIA
The choice of acquisition mode fundamentally shapes the trade-off between depth and speed.
- Data-Dependent Acquisition (DDA): A sequential method where the most intense precursor ions detected in a full MS scan are selected for fragmentation. While it produces clean, interpretable spectra, its stochastic nature can lead to poor reproducibility and missed detection of low-abundance precursors co-eluting with intense ions [71].
- Data-Independent Acquisition (DIA): A parallel method where all precursor ions within a predefined, contiguous m/z window are fragmented simultaneously. This provides a more complete and reproducible record of all detectable analytes but generates highly complex composite spectra that require sophisticated computational deconvolution [73] [71].
Table 1: Strategic Comparison of MS/MS Acquisition Modes for Scaffold Detection
| Feature | Data-Dependent Acquisition (DDA) | Data-Independent Acquisition (DIA) | Intelligent Iterative DDA (e.g., AcquireX) |
|---|---|---|---|
| Acquisition Principle | Selective, intensity-driven | Comprehensive, non-selective | Iterative, learning-driven |
| Depth of Coverage | Moderate; biased towards abundant ions | High; covers all ions in selected windows | Very High; improves with each injection |
| Speed/Throughput | High for simple samples; lower for complex ones | Configurable; wider windows increase speed | Lower per sample, but reduces need for re-runs |
| Spectral Quality | High-quality, clean MS/MS spectra | Complex, composite spectra requiring deconvolution | High-quality, like DDA |
| Best Application in Library Design | Initial profiling of low-complexity samples or affinity-selection hits [51] | Comprehensive, reproducible mapping of highly complex extract libraries [6] | Ultra-deep characterization of priority samples or benchmark materials [72] |
The Role of Affinity Selection Mass Spectrometry (AS-MS)
AS-MS is a powerful orthogonal technique that introduces a functional filter prior to MS analysis. It involves incubating a biological target with a complex natural product extract, separating the bound ligands, and then using LC-MS/MS to identify them [51]. This directly selects for scaffolds with binding potential, dramatically simplifying the mixture analyzed by MS and allowing for more focused, in-depth acquisition on the relevant portions of the chromatogram. AS-MS can be performed with the target in solution (e.g., by ultrafiltration) or immobilized (ligand fishing) [51].
Detailed Experimental Protocols
Protocol 1: Optimized DIA-MS for Untargeted Scaffold Mapping
This protocol is designed for the comprehensive initial analysis of a natural product extract library to assess scaffold diversity.
I. Sample Preparation:
- Prepare fungal, bacterial, or plant extracts in a solvent compatible with reversed-phase LC (e.g., 80% methanol).
- Dilute extracts to a consistent concentration of total solid content (e.g., 1 mg/mL) to facilitate comparative analysis.
- Centrifuge at 14,000 x g for 10 minutes to remove particulate matter.
II. Liquid Chromatography:
- Column: Nanoflow or microflow reversed-phase C18 column (e.g., 75 µm x 25 cm, 1.7 µm particle size).
- Gradient: Employ a short, steep gradient for rapid screening (e.g., 13 minutes from 2% to 98% acetonitrile in water with 0.1% formic acid) [73].
- Flow Rate: 300 nL/min for nanoflow; 5 µL/min for microflow.
- Column Temperature: 40°C.
III. Mass Spectrometry – DIA Acquisition:
- Instrument: High-resolution tandem mass spectrometer (Q-TOF, Orbitrap).
- Ion Source: NanoESI or heated electrospray ionization (HESI).
- Full MS Scan: Resolution ≥ 60,000; scan range m/z 100-1500.
- DIA Segmented Windows: Based on [73] [71].
- Divide the m/z 400-900 range into 20-30 variable-width windows (narrower in dense regions).
- Isolation Width: 20-25 m/z provides a balance of specificity and coverage [73].
- Collision Energy: Use a stepped energy ramp (e.g., 25, 35, 45 eV) to generate diverse fragments.
- Cycle Time: Aim for a total cycle time (1 full scan + all DIA scans) of 2-3 seconds to ensure sufficient points across chromatographic peaks.
Protocol 2: Intelligent Iterative DDA for Deep Scaffold Interrogation
This protocol uses a platform like AcquireX for ultra-deep characterization of prioritized samples or benchmark extracts [72].
I. Sample & LC Setup:
- Follow the sample preparation and LC conditions from Protocol 1.
II. Mass Spectrometry – AcquireX Intelligent DDA:
- Initial Run: Perform a standard DDA analysis (Top 20 precursors) to create a baseline spectral library for the sample.
- Exclusion List Generation: The software automatically generates a dynamic exclusion list of previously identified high-abundance features.
- Iterative Runs: Re-inject the same sample. The method now excludes known high-intensity precursors, directing MS/MS effort towards previously undetected, lower-abundance ions.
- Parameter Settings:
- Automatic Gain Control (AGC) Target: Set to "Standard" or "High" for improved low-abundance ion detection.
- Dynamic Exclusion: Enabled with a short duration (e.g., 15 s) to allow re-sampling of co-eluting isomers.
- Minimum Intensity Threshold: Set low to trigger on faint ions.
Protocol 3: AS-MS Workflow for Bioactive Scaffold Enrichment
This protocol outlines an ultrafiltration-based AS-MS method to fish for ligands from a target protein [51].
I. Incubation:
- Incubate the target protein (e.g., 5-LOX at 1 µM) with the natural product extract (at a non-saturating concentration) in a physiological buffer (e.g., PBS, pH 7.4) for 30-60 minutes at 4°C [51].
II. Separation of Complexes:
- Load the incubation mixture into a centrifugal ultrafiltration device with a molecular weight cutoff (MWCO) lower than the target protein (e.g., 10 kDa MWCO).
- Centrifuge at 14,000 x g for 15-20 minutes. The protein-ligand complexes are retained on the filter; unbound compounds pass through.
III. Washing & Dissociation:
- Wash the filter unit 2-3 times with buffer to remove non-specifically bound compounds.
- Dissociate the ligands by adding a denaturing organic solvent (e.g., 50% methanol, 1% formic acid) to the filter and incubating for 5 minutes.
- Centrifuge to recover the eluent containing the liberated ligands.
IV. LC-MS/MS Analysis:
- Analyze the eluent using Protocol 1 or 2. Compare against a control experiment (protein omitted) to identify ions specifically enriched in the incubation sample.
Data Analysis and Library Construction Workflow
The computational pipeline transforms raw MS data into a rationalized library.
Step 1: Feature Detection & Alignment: Use software (e.g., MZmine, MS-DIAL) to pick peaks, align features across samples, and annotate adducts.
Step 2: Molecular Networking & Scaffold Clustering: Upload processed MS/MS data to the Global Natural Products Social Molecular Networking (GNPS) platform. Classical molecular networking clusters spectra based on cosine similarity, forming molecular families that represent scaffolds [6].
Step 3: Rational Library Selection Algorithm:
- The algorithm selects the extract contributing the highest number of unique scaffold clusters.
- It iteratively adds the next extract that adds the most new scaffolds not yet represented.
- This continues until a user-defined percentage of total scaffold diversity is captured (e.g., 80% or 100%) [6].
Step 4: Bioactivity Correlation (Optional): For libraries with associated bioassay data, statistical analysis (e.g., Spearman correlation) can identify MS features whose abundance correlates with activity, providing putative active scaffolds [6].
Diagram 1: Computational Workflow for Rational Library Design from MS/MS Data.
Performance Metrics and Benchmarking
Evaluating the success of the optimized acquisition strategy involves both chemical and biological metrics.
Table 2: Impact of Rational Library Design on Screening Efficiency [6]
| Metric | Full Library (1,439 extracts) | Rational Library (80% Diversity, 50 extracts) | Rational Library (100% Diversity, 216 extracts) |
|---|---|---|---|
| Library Size Reduction | Baseline | 28.8-fold reduction | 6.6-fold reduction |
| Anti-P. falciparum Hit Rate | 11.26% | 22.00% | 15.74% |
| Anti-T. vaginalis Hit Rate | 7.64% | 18.00% | 12.50% |
| Anti-Neuraminidase Hit Rate | 2.57% | 8.00% | 5.09% |
| Retention of Bioactivity-Correlated Features | All features | 80-100% retained [6] | 100% retained [6] |
The data demonstrates that a rationally designed library not only drastically reduces size but also enriches bioactivity hit rates, as it removes redundant, inactive chemistry and increases the probability of selecting bioactive scaffolds [6].
Diagram 2: DIA-MS Acquisition Cycle with Sequential Window Isolation.
The Scientist's Toolkit: Research Reagent Solutions
Table 3: Essential Materials for Scaffold Detection Workflows
| Item | Function | Example / Specification |
|---|---|---|
| Ultrapure Solvents (Acetonitrile, Methanol, Water) | Mobile phase for LC; sample reconstitution. Minimizes background ions and column contamination. | LC-MS Grade, with 0.1% Formic Acid as additive. |
| Reversed-Phase LC Column | Separation of complex natural product mixtures prior to MS injection. | C18 silica, 1.7-2 µm particle size, 75-150 µm inner diameter for nano/microflow [73]. |
| Mass Spectrometer | High-resolution accurate mass measurement and fragmentation for scaffold identification. | Q-TOF or Orbitrap-based system capable of DDA and DIA acquisition [71]. |
| Ultrafiltration Devices | Physical separation of protein-ligand complexes from unbound compounds in AS-MS. | 10 kDa molecular weight cut-off (MWCO) centrifugal units [51]. |
| Purified Target Protein | The "bait" for bioactive scaffold fishing in AS-MS experiments. | Soluble, recombinant protein at >90% purity for reliable binding assays [51]. |
| Molecular Networking Software | Cloud-based platform for clustering MS/MS spectra into scaffold groups. | GNPS (Global Natural Products Social Molecular Networking) [6]. |
| Statistical Analysis Software | For correlating MS feature abundance with bioassay data to pinpoint active scaffolds. | R or Python with packages for multivariate analysis (e.g., statistics in R) [6]. |
Future Perspectives and Concluding Remarks
The future of scaffold detection lies in the convergence of acquisition strategies. Hybrid methods that use DIA for comprehensive mapping and intelligent DDA for follow-up characterization will become standard. Furthermore, integrating AS-MS as a front-end filter will provide a powerful functional dimension to library design, creating libraries not just of diverse scaffolds, but of target-relevant scaffolds [51]. As computational power grows, real-time adaptive acquisition—where the MS instrument decides on the fly whether to perform DDA or DIA based on the complexity of the eluting region—could offer the ultimate balance of depth and speed.
In conclusion, balancing depth and speed in MS/MS acquisition is not a compromise but a strategic optimization. By applying the protocols and frameworks outlined here, researchers can systematically detect and prioritize chemical scaffolds. This enables the construction of rationally minimized natural product libraries that are cost-effective, highly diverse, and enriched with bioactive potential, thereby accelerating the discovery of novel therapeutic leads from nature's chemical repertoire.
Proof of Performance: Validating Library Efficacy Through Bioassay and Comparative Metrics
Thesis Context & Rationale
This work is situated within a doctoral thesis investigating Liquid Chromatography-Tandem Mass Spectrometry (LC-MS/MS) as a foundational tool for the rational design of natural product (NP) screening libraries. The overarching hypothesis is that chemical diversity, as captured by MS/MS spectral fingerprints, is a superior proxy for biological potential compared to traditional library construction based on organism taxonomy or crude extract availability [6] [19].
The traditional NP drug discovery pipeline is hampered by the screening of large, chemically redundant extract libraries, leading to high costs, long timelines, and the frequent rediscovery of known bioactive scaffolds [6] [74]. The thesis posits that a pre-screening LC-MS/MS analysis, coupled with computational metabolomics, can rationally minimize library size by prioritizing chemical diversity, thereby enhancing the probability of identifying novel bioactive entities. The "Gold Standard Validation" of such a method is its proven ability to not merely retain, but enhance the bioactivity hit rate in downstream biological assays—a direct measure of efficiency and predictive power [6] [19]. This document provides the application notes and detailed protocols for achieving and validating this critical outcome.
Defining "Gold Standard Validation" in Rational Library Design
In the context of rational NP library design, "Gold Standard Validation" transcends simple library size reduction. It is a multi-faceted demonstration that the computationally designed library:
- Maximizes Chemical Scaffold Diversity: Efficiently captures the breadth of molecular scaffolds present in the full library.
- Enhances Bioassay Hit Rates: Yields a statistically significant increase in the rate of bioactive samples compared to screening the full, uncurated library.
- Retains Bioactivity-Correlated Features: Preserves the specific chemical features (LC-MS peaks) statistically linked to bioactivity in the full dataset.
- Outperforms Random Selection: Provides a clear and reproducible advantage over naïve, random subset selection in achieving objectives 1-3 [6] [19].
Validation against phenotypic (e.g., anti-parasitic) and target-based (e.g., enzyme inhibition) assays is essential to demonstrate broad applicability [6].
Core Protocol: LC-MS/MS-Guided Rational Library Design & Validation
This protocol details the primary method for constructing a rationally minimized NP extract library and rigorously validating its enhanced performance [6] [19].
Application Notes
- Objective: To reduce a large NP extract library by >80% while increasing bioactivity hit rates by 1.5 to 3-fold.
- Principle: LC-MS/MS spectra are clustered into molecular networks based on fragmentation pattern similarity (GNPS). An iterative algorithm selects extracts that cumulatively add the greatest number of new spectral scaffolds, maximizing chemical diversity with minimal samples [6].
- Key Outcome: A minimal library that is enriched for bioactive potential, drastically reducing screening costs and accelerating the discovery pipeline.
Materials & Equipment
- Library: Crude natural product extracts (e.g., fungal, bacterial) in suitable solvents [6] [19].
- LC-MS/MS System: High-resolution tandem mass spectrometer coupled to a UHPLC system.
- Software: MSConvert (ProteoWizard), GNPS Classical Molecular Networking, R or Python with custom scripts for diversity selection [6].
- Assay Reagents: Target-specific bioassay kits (e.g., Plasmodium falciparum SYBR Green assay, neuraminidase fluorometric assay) or materials for custom assays [6].
Step-by-Step Procedure
Part A: LC-MS/MS Data Acquisition and Molecular Networking
- Sample Preparation: Dilute all crude extracts to a standardized concentration. Include process blanks and QC reference samples.
- Untargeted LC-MS/MS Analysis: Analyze each extract in data-dependent acquisition (DDA) mode. Use a reversed-phase C18 column and a water/acetonitrile gradient with formic acid. Collect both positive and negative ionization mode data for comprehensive coverage [6] [19].
- Data Processing: Convert raw files to .mzML format. Perform peak picking, alignment, and feature detection using software like MZmine or MS-DIAL.
- Molecular Networking: Upload the processed MS/MS data to the GNPS platform (https://gnps.ucsd.edu). Use Classical Molecular Networking workflow with default parameters to cluster MS/MS spectra into molecular families (scaffolds) [6].
Part B: Rational Library Minimization Algorithm
- Data Parsing: Using a custom R script (publicly available from source studies [6]), parse the GNPS output to create a binary matrix where rows are extracts and columns are molecular scaffolds (nodes in the network).
- Iterative Selection:
- Step 1: Identify the single extract containing the highest number of unique scaffolds.
- Step 2: Add this extract to the "Rational Library" list and mark all its scaffolds as "covered."
- Step 3: From the remaining extracts, select the one that contains the largest number of scaffolds not yet covered.
- Step 4: Repeat Step 3 until the desired percentage of total scaffold diversity (e.g., 80%, 95%, 100%) from the full library is achieved [6] [19].
- Output: The final list of selected extract IDs constitutes the rationally minimized library.
Part C: Gold Standard Bioassay Validation
- Blinded Screening: Conduct bioactivity assays (e.g., against a disease target) on both the Full Library and the Rational Minimized Library. Ensure the screening is blinded to sample identity/grouping.
- Hit Rate Calculation: For each library, calculate the hit rate as: (Number of Active Extracts / Total Extracts Screened) * 100. Define activity using a predetermined threshold (e.g., >50% inhibition at test concentration).
- Statistical Comparison: Compare hit rates between the Full and Rational Libraries. Validate that the enhancement is not due to smaller size by comparing the Rational Library hit rate against the distribution of hit rates from 1,000 iterations of randomly selecting the same number of extracts [6] [19].
- Bioactivity Correlation Analysis (Optional but Recommended):
- Perform statistical correlation (e.g., Pearson) between the abundance of all LC-MS features (m/z-RT pairs) in the full library and the bioactivity assay results.
- Identify features with significant positive correlation (p < 0.05, FDR corrected).
- Verify the retention percentage of these bioactivity-correlated features in the rational library [6].
Table 1: Representative Validation Data from a Fungal Extract Library (n=1,439 extracts) [6] [19]
| Activity Assay (Type) | Hit Rate: Full Library | Hit Rate: 80% Diversity Library (50 extracts) | Hit Rate: 100% Diversity Library (216 extracts) | Random Selection Range (50 extracts) |
|---|---|---|---|---|
| P. falciparum (Phenotypic) | 11.26% | 22.00% (1.95x ↑) | 15.74% | 8.00 – 14.00% |
| T. vaginalis (Phenotypic) | 7.64% | 18.00% (2.36x ↑) | 12.50% | 4.00 – 10.00% |
| Neuraminidase (Target-based) | 2.57% | 8.00% (3.11x ↑) | 5.09% | 0.00 – 2.00% |
Table 2: Retention of Bioactivity-Correlated LC-MS Features [6]
| Activity Assay | Significant Features in Full Library | Retained in 80% Diversity Library | Retained in 100% Diversity Library |
|---|---|---|---|
| P. falciparum | 10 | 8 (80%) | 10 (100%) |
| T. vaginalis | 5 | 5 (100%) | 5 (100%) |
| Neuraminidase | 17 | 16 (94%) | 17 (100%) |
Complementary Protocol: Build-Up Library Synthesis for In-Situ Hit-to-Lead
This protocol complements the rational library design by accelerating the optimization of initial hits through a streamlined analogue synthesis and screening approach [75].
Application Notes
- Objective: To rapidly generate and screen a library of natural product analogues directly in assay plates, bypassing compound isolation and purification.
- Principle: A bioactive natural product is deconstructed into a core aldehyde fragment (with key pharmacophore) and a library of accessory hydrazine fragments. Clean, high-yield hydrazone formation in microplates creates a "build-up library" for immediate biological evaluation [75].
- Key Outcome: Rapid structure-activity relationship (SAR) data and identification of optimized lead compounds from a natural product hit.
Materials & Equipment
- Core Fragment: Synthetic or isolated natural product derivative containing a ketone/aldehyde group.
- Accessory Fragment Library: Commercially available or synthesized hydrazides/hydrazines with diverse chemical motifs (e.g., acyl, aryl, amino acid-based) [75].
- Equipment: 96-well or 384-well microplates, centrifugal concentrator, liquid handling robot (optional).
- Assay Plates: Pre-configured enzymatic or cell-based assay plates compatible with DMSO concentrations.
Step-by-Step Procedure
- Fragment Design: Chemically modify a confirmed NP hit to introduce a conjugated aldehyde/ketone moiety while retaining its core binding pharmacophore (e.g., the uridine moiety in MraY inhibitors) [75].
- Library Assembly: In a microplate, combine each well with:
- A fixed volume of core aldehyde fragment solution in DMSO (e.g., 10 mM).
- An equimolar volume of a unique hydrazine fragment solution in DMSO.
- Mix gently and incubate at room temperature for 30-60 minutes.
- Solvent Removal: Centrifugally concentrate the plate under vacuum to remove DMSO, leaving the synthesized hydrazone analogues as residues.
- In-Situ Bioassay: Directly reconstitute the residues in the buffer of the target biological assay (e.g., MraY enzyme assay or bacterial cell viability assay) by adding assay medium directly to the plate. The hydrazone formation reaction produces only water as a by-product, making it compatible with cell-based assays [75].
- SAR Analysis: Evaluate bioactivity results to identify accessory fragments that enhance potency, spectrum, or physicochemical properties. The most promising analogues can then be synthesized at scale for full characterization and advanced testing.
Visual Synthesis of Workflow and Validation Logic
Diagram 1: Workflow for Rational Library Design & Validation
Diagram 2: Logical Pathway to Hit Rate Enhancement
Table 3: Key Research Reagent Solutions for Rational NP Library Workflows
| Category | Item/Reagent | Function in Protocol | Key Reference/Source |
|---|---|---|---|
| LC-MS/MS Analysis | High-purity solvents (Acetonitrile, Water, Formic Acid) | Mobile phase for UHPLC separation and MS ionization. | Standard protocol [6] |
| C18 reversed-phase UHPLC column | Chromatographic separation of complex natural product mixtures. | Standard protocol [6] | |
| Computational Metabolomics | GNPS (Global Natural Products Social Molecular Networking) | Cloud platform for clustering MS/MS spectra into molecular families based on similarity. | Core algorithm component [6] [19] |
| Custom R/Python Scripts for Iterative Selection | Implements the diversity-maximizing algorithm to select extracts. | Available from source data [6] | |
| Bioassay Validation | Target-specific assay kits (e.g., Fluorescent, Luminescent) | Provides standardized, reproducible readout of bioactivity (inhibition, cell death). | Validation benchmark [6] |
| Plasmodium falciparum culture & SYBR Green I dye | For phenotypic anti-malarial screening assays. | Used in validation [6] | |
| Build-Up Library Chemistry | Core Aldehyde Fragments (e.g., derived from MraY inhibitors) | Contains the essential pharmacophore; reacts with hydrazines. | [75] |
| Diverse Hydrazine/Acyl Hydrazide Library | Provides variable chemical space for SAR; reacts with core aldehydes. | [75] | |
| Anhydrous DMSO | Solvent for fragment storage and in-plate reaction. | [75] |
Within the paradigm of LC-MS/MS-driven natural product (NP) discovery, a central challenge is the efficient interrogation of immense chemical diversity. Traditional high-throughput screening (HTS) of full, unrefined extract libraries is resource-intensive, often hampered by the rediscovery of known compounds and the high redundancy of chemical scaffolds across samples [19]. This creates a significant bottleneck, particularly for resource-limited settings or understudied diseases [19]. The thesis that LC-MS/MS metabolomics data can serve as a predictive map to rationally design smaller, more efficient screening libraries is therefore transformative.
Rational library design moves beyond serendipity, using chemical data to maximize the probability of discovering novel bioactive entities [49]. This approach contrasts with two common but less efficient methods: Full-library screening, which assays every available sample, and Random selection, which chooses subsets without chemical guidance. The core hypothesis is that a scaffold diversity-based selection using LC-MS/MS will outperform random selection (achieving equivalent chemical coverage with far fewer samples) and match or exceed the bioactive hit rate of full-library screening, thereby dramatically accelerating the early drug discovery pipeline [6].
Quantitative Performance Benchmark
The following tables synthesize key quantitative findings from recent studies that benchmark rational LC-MS/MS-based selection against random selection and full-library screening.
Table 1: Library Size Efficiency for Achieving Target Chemical Diversity This table compares the number of extracts required by rational selection versus random selection to achieve defined levels of chemical (scaffold) diversity within a parent library of 1,439 fungal extracts [19] [6].
| Target Scaffold Diversity | Extracts Required (Rational Selection) | Extracts Required (Random Selection - Average) | Library Size Reduction vs. Full Library | Fold Reduction vs. Random Selection |
|---|---|---|---|---|
| 80% of Maximum | 50 extracts | 109 extracts | 96.5% (from 1,439) | 2.2-fold |
| 95% of Maximum | 116 extracts | Not Reported | 91.9% | Not Reported |
| 100% (All Scaffolds) | 216 extracts | 755 extracts | 85.0% | 3.5-fold |
Table 2: Bioactivity Hit Rate Comparison Across Screening Strategies This table compares the observed hit rates in phenotypic and target-based assays for libraries constructed via different methods [19] [6]. The random selection range is derived from 1,000 iterations of selecting the same number of extracts as the rational 80% diversity library (n=50).
| Bioassay Target | Hit Rate: Full Library (1,439 extracts) | Hit Rate: Rational 80% Diversity Library (50 extracts) | Hit Rate Range: 50 Random Extracts (Quartiles) | Hit Rate: Rational 100% Diversity Library (216 extracts) |
|---|---|---|---|---|
| Plasmodium falciparum (phenotypic) | 11.26% | 22.00% | 8.00% – 14.00% | 15.74% |
| Trichomonas vaginalis (phenotypic) | 7.64% | 18.00% | 4.00% – 10.00% | 12.50% |
| Neuraminidase (enzyme target) | 2.57% | 8.00% | 0.00% – 2.00% | 5.09% |
Table 3: Retention of Bioactivity-Correlated Chemical Features This table shows the retention rate of MS features statistically correlated with bioactivity in the full library when moving to rationally designed, smaller libraries [6].
| Bioassay Target | # Features Correlated in Full Library | % Retained in 80% Diversity Library | % Retained in 100% Diversity Library |
|---|---|---|---|
| Plasmodium falciparum | 10 | 80% | 100% |
| Trichomonas vaginalis | 5 | 100% | 100% |
| Neuraminidase | 17 | 94% | 100% |
Detailed Experimental Protocols
Protocol A: Untargeted LC-MS/MS Analysis for Molecular Networking
Objective: Generate comprehensive, high-quality MS/MS data for scaffold-based analysis. Materials: Natural product extract library, UHPLC system coupled to a high-resolution Q-TOF or Orbitrap mass spectrometer. Steps:
- Sample Preparation: Reconstitute dried extracts in appropriate solvent (e.g., 80% methanol). Use a standardized concentration (e.g., 1 mg/mL). Include pooled quality control (QC) samples and solvent blanks [76].
- Chromatographic Separation: Employ a reversed-phase C18 column (e.g., 2.1 x 100 mm, 1.7 µm). Use a binary gradient (e.g., water and acetonitrile, both with 0.1% formic acid) over 15-20 minutes [77].
- Mass Spectrometric Acquisition:
- MS1 (Full Scan): Acquire data in positive and/or negative electrospray ionization (ESI) mode with a resolution >35,000 (at m/z 200) and a scan range of m/z 100-1500 [78].
- MS2 (Data-Dependent Acquisition - DDA): Select the top N most intense ions per cycle for fragmentation. Use a dynamic exclusion window. Apply stepped normalized collision energies (e.g., 20, 40, 60 eV) to generate rich, information-dense fragmentation spectra [79].
- Data Conversion: Convert raw instrument files to an open format (.mzML or .mzXML) using vendor software or tools like MSConvert (ProteoWizard).
Protocol B: Molecular Networking & Scaffold-Centric Library Rationalization
Objective: Process MS/MS data to group compounds by structural similarity and select a minimal subset of extracts that captures maximal scaffold diversity. Materials: LC-MS/MS data (.mzML files), access to the GNPS platform, custom R scripting environment. Steps:
- Molecular Networking on GNPS: Upload files to the Global Natural Products Social Molecular Networking (GNPS) platform.
- Create Network: Use the "Classical Molecular Networking" workflow. Set precursor ion mass tolerance to 0.02 Da and fragment ion tolerance to 0.02 Da [19].
- Advanced Parameters: Set
Minimum Cosine Scoreto 0.7 andMinimum Matched Fragment Ionsto 6. Enable the "MS-Cluster" feature to de-replicate spectra before networking [6].
- Extract Scaffold Information: Each molecular family (cluster) in the resulting network is treated as a unique chemical scaffold. Export the cluster information table, which maps each MS/MS spectrum (and its source extract) to a specific cluster ID.
- Execute Rational Selection Algorithm:
- Calculate Scaffold Diversity per Extract: For each extract, count the number of unique scaffold clusters its metabolites belong to.
- Iterative Selection: Implement a greedy algorithm in R:
- Select the single extract with the highest scaffold count.
- Identify all unique scaffolds now represented in the selected subset.
- From the remaining extracts, select the one that adds the greatest number of new, unrepresented scaffolds to the subset.
- Iterate steps 2-3 until a predefined diversity target (e.g., 80% of total scaffolds) is reached or until the addition of new extracts yields diminishing returns [19] [6].
- Output: A ranked list of extract IDs defining the rational, minimal library.
Protocol C: Benchmarking Against Random & Full-Library Screening
Objective: Empirically validate the performance of the rational library. Materials: Rational library extract subset, full extract library, validated bioassay(s). Steps:
- Design Benchmarking Study:
- Test Groups: Rational Library, Randomly Selected Library (multiple iterations, e.g., n=1000), Full Library (positive control).
- Blinding: Ensure bioassay screening is performed blinded to the selection group of each extract.
- High-Throughput Bioassay Screening: Screen all library sets in parallel using one or more relevant bioassays (e.g., anti-parasitic phenotypic assay, enzyme inhibition assay). Use standardized positive and negative controls on each plate [6].
- Data Analysis:
- Calculate Hit Rates: For each library set, calculate the hit rate as (Number of Active Extracts / Total Extracts Screened) * 100.
- Statistical Comparison: Compare the hit rate of the rational library to the distribution of hit rates from the random iterations (e.g., using a one-sample t-test). Compare the rational library's bioactive features to those identified in the full library [6].
Visual Workflow & Integration Diagrams
Diagram 1: Rational Library Design and Benchmarking Workflow
This diagram illustrates the sequential computational and experimental steps from raw LC-MS/MS data to validated library performance.
Diagram 2: Integration into the Drug Discovery Pipeline
This diagram contextualizes the rational library design within the broader natural product drug discovery process.
The Scientist's Toolkit: Essential Research Reagents & Solutions
Table 4: Key Computational Tools and Databases for Rational Design
| Tool/Solution Name | Category | Function in Rational Design | Key Reference/Source |
|---|---|---|---|
| GNPS (Global Natural Products Social Molecular Networking) | Cloud Platform | Performs molecular networking to group MS/MS spectra by structural similarity, forming the basis for scaffold definition. | [19] [6] |
| MetaboAnalystR 4.0 | Software Pipeline | Provides a unified R workflow for LC-MS1 and MS2 data processing, spectral deconvolution, and compound identification, feeding into diversity analysis. | [78] |
| Custom R/Python Scripts for Iterative Selection | Custom Algorithm | Implements the greedy algorithm to select extracts based on cumulative scaffold diversity. Code is often shared alongside publications. | [19] [6] |
| WFSR Food Safety/MS-DIAL Public Spectral Libraries | Reference Database | Used for dereplication of known compounds during analysis, ensuring novelty focus. Spectral matching increases annotation confidence. | [79] [80] |
| XCMS, MZmine, MS-DIAL | Data Processing Software | Alternative open-source tools for peak picking, alignment, and feature quantification from raw LC-MS data before networking. | [78] [80] |
Table 5: Key Analytical Materials and Assay Components
| Material/Solution | Category | Function in Rational Design | Specification Notes | |
|---|---|---|---|---|
| High-Resolution Mass Spectrometer | Instrumentation | Enables accurate mass measurement and data-dependent MS/MS acquisition necessary for molecular networking. | Q-TOF or Orbitrap platform with resolution >35,000 FWHM. | [77] |
| Reversed-Phase UHPLC Column | Consumable | Provides high-resolution separation of complex natural product extracts prior to MS analysis. | C18, 1.7-2.0 µm particle size, 100 mm length. | [76] [77] |
| Standardized Bioassay Kits/Reagents | Assay Components | Enables consistent, high-throughput screening of library subsets for biological activity (benchmarking). | Phenotypic (e.g., parasite growth) or target-based (e.g., enzyme inhibition). | [6] |
| Pooled Quality Control (QC) Sample | Quality Assurance | Monitors instrument stability throughout lengthy LC-MS acquisition sequences. | Created by pooling aliquots of all study extracts. | [76] |
The systematic discovery of bioactive natural products is foundational to pharmaceutical development, with these compounds accounting for a significant proportion of approved drugs [6]. However, high-throughput screening (HTS) campaigns are often impeded by the chemical redundancy present in large natural product extract libraries, leading to inefficient resource use and the frequent re-discovery of known compounds [6] [81]. This creates a critical need for rational strategies to design focused, high-quality screening libraries.
This work is situated within a broader thesis research program, exemplified by NIH-funded projects, which seeks to establish LC-MS/MS-guided bioanalytical approaches for rational natural product library design and optimization [7]. The central paradigm shift moves from serendipitous screening of vast libraries to the intelligent prioritization of extracts based on comprehensive metabolomic profiling. The specific focus here is on a pivotal analytical challenge: ensuring that the bioactive potential of a library is preserved when its size is rationally reduced. We achieve this by developing and applying rigorous protocols to track, correlate, and validate the retention of molecular features statistically linked to biological activity—termed activity-correlated features—within computationally designed minimal libraries [6].
Table 1: Comparison of Bioactivity Hit Rates Between Full and Rationally Designed Minimal Libraries [6]
| Activity Assay (Type) | Hit Rate: Full Library (1,439 extracts) | Hit Rate: 80% Scaffold Diversity Library (50 extracts) | Hit Rate: 100% Scaffold Diversity Library (216 extracts) | Performance vs. Random Selection (50 extracts) |
|---|---|---|---|---|
| P. falciparum (Phenotypic) | 11.26% | 22.00% | 15.74% | Superior (22% vs. 8-14%) |
| T. vaginalis (Phenotypic) | 7.64% | 18.00% | 12.50% | Superior (18% vs. 4-10%) |
| Neuraminidase (Target-based) | 2.57% | 8.00% | 5.09% | Superior (8% vs. 0-2%) |
Core Quantitative Findings: Retention of Activity-Correlated Features
A direct measure of the success of a rational library design is its ability to retain the specific chemical entities responsible for bioactivity. By identifying MS features (unique m/z and retention time pairs) whose abundance correlates significantly with activity in a full library, we can quantify their fate in a downsized library [6].
The data demonstrates that a library designed to capture 80% of chemical scaffold diversity retains the vast majority of bioactive features. Notably, achieving 100% scaffold diversity guarantees the retention of all statistically significant activity-correlated features, proving the method's efficacy in preserving bioactive potential despite a dramatic reduction in physical library size [6].
Table 2: Retention of Statistically Significant Activity-Correlated Features in Rationally Designed Libraries [6]
| Activity Assay | # of Significant Features in Full Library (ρ > 0.5, p<0.05) | # Retained in 80% Diversity Library | # Retained in 95% Diversity Library | # Retained in 100% Diversity Library |
|---|---|---|---|---|
| P. falciparum | 10 | 8 | 10 | 10 |
| T. vaginalis | 5 | 5 | 5 | 5 |
| Neuraminidase | 17 | 16 | 16 | 17 |
Detailed Experimental Protocols
Protocol 3.1: Sample Preparation and Untargeted LC-MS/MS Analysis
Objective: To generate comprehensive, high-quality metabolomic profiles from natural product extracts for downstream computational analysis.
- Extract Preparation: Prepare crude natural product extracts (e.g., fungal, plant) in appropriate solvents (e.g., methanol, ethyl acetate). Pass through a 0.22 µm PTFE filter to remove particulates [82].
- LC Separation:
- Column: Employ a reversed-phase C18 column (e.g., 2.1 x 100 mm, 1.7 µm) for broad metabolite coverage [82].
- Mobile Phase: (A) Water with 0.1% formic acid; (B) Acetonitrile with 0.1% formic acid.
- Gradient: 5% B to 95% B over 20 minutes, hold at 95% B for 3 minutes, re-equilibrate to 5% B.
- Flow Rate: 0.3 mL/min. Column temperature: 40°C.
- MS/MS Data Acquisition:
- Ion Source: Electrospray Ionization (ESI), positive and negative ionization modes [82].
- Mass Analyzer: Q-TOF or Orbitrap for high resolution and accurate mass.
- Scan Mode: Data-Dependent Acquisition (DDA). Full MS scan (e.g., m/z 100-1500) followed by MS/MS fragmentation of the top N most intense ions. Use a dynamic exclusion window.
- Collision Energy: Apply a stepped collision energy (e.g., 20, 40, 60 eV) to generate rich fragmentation spectra.
Protocol 3.2: Molecular Networking and Scaffold-Based Library Design
Objective: To process MS/MS data, visualize chemical diversity, and algorithmically select a minimal set of extracts representing maximal chemical scaffold diversity [6].
- Data Processing & Molecular Networking:
- Convert raw files to open formats (e.g., .mzML) using MSConvert.
- Process data through MZmine or similar software for feature detection, alignment, and gap filling [81].
- Upload processed MS/MS spectra to the Global Natural Products Social Molecular Networking (GNPS) platform.
- Create a classical molecular network using the FEATURE-BASED MOLECULAR NETWORKING workflow. Key parameters: precursor ion mass tolerance 0.02 Da, fragment ion tolerance 0.02 Da, minimum cosine score of 0.7.
- Rational Library Design Algorithm:
- Download the network information (e.g., .graphml file) and feature table.
- Using custom R/Python scripts (as described in [6]), model each extract as a collection of molecular families (scaffolds) from the network.
- Iterative Selection Algorithm:
- Select the single extract containing the highest number of unique molecular scaffolds.
- Add this extract to the rational library. Record all scaffolds now represented.
- From the remaining pool, select the extract that adds the greatest number of new, unrepresented scaffolds.
- Iterate steps 2-3 until a pre-defined threshold of total scaffold diversity (e.g., 80%, 95%, 100%) is achieved.
Protocol 3.3: Correlation Analysis of MS Features with Bioactivity
Objective: To identify specific MS features whose abundance across the extract library correlates with bioactivity data, thereby pinpointing candidate bioactive metabolites [6].
- Data Integration: Align the feature intensity table (from Protocol 3.1) with quantitative bioactivity data (e.g., % inhibition, IC50) for each extract across one or more assays.
- Statistical Correlation:
- For each MS feature (m/z-RT pair), calculate a non-parametric correlation coefficient (e.g., Spearman's ρ) between its logged intensity across all extracts and the corresponding bioactivity values.
- Perform significance testing (p-value) for each correlation.
- Apply False Discovery Rate (FDR) correction (e.g., Benjamini-Hochberg) to account for multiple testing across thousands of features.
- Identification of Activity-Correlated Features: Define a significance threshold (e.g., ρ > |0.5| and FDR-adjusted p-value < 0.05). Features passing this threshold are designated "activity-correlated features."
- Retention Analysis: Cross-reference the list of significant activity-correlated features with the feature table of the rationally designed minimal library. Calculate the percentage of features retained at each scaffold diversity level (80%, 95%, 100%).
Protocol 3.4: Retention Time Modeling for Enhanced Feature Tracking
Objective: To utilize Quantitative Structure-Retention Relationship (QSRR) models to predict retention times, aiding in the confirmation and tracking of activity-correlated features across different chromatographic conditions [83].
- Model Application: For activity-correlated features of interest, use in-silico tools to generate molecular descriptors (e.g., via RDKit) for candidate structures.
- Retention Time Prediction: Input these descriptors into a pre-validated QSRR model calibrated for your chromatographic system (e.g., specific C18 column and gradient) [83]. The model will output a predicted retention time window.
- Data Triangulation: Use the predicted retention time as an additional constraint to filter candidate structures from spectral databases. This strengthens the link between the statistical correlation and a putative chemical identity, enhancing the reliability of tracking this feature in future libraries or fractionation steps.
Visualization of Workflows and Analytical Processes
Experimental Workflow for Rational Library Design & Validation
Activity-Correlated Feature Analysis & Retention Validation
The Scientist's Toolkit: Essential Research Reagent Solutions
Table 3: Key Reagents, Materials, and Software for LC-MS/MS-Based Library Design
| Item | Category | Function & Application in Protocol |
|---|---|---|
| Hypergrade LC-MS Solvents | Reagent | Provide ultra-low background noise for sensitive detection of trace metabolites in complex extracts [82]. |
| Reversed-Phase C18 UHPLC Columns | Consumable | Standard workhorse for separating a wide polarity range of natural products; core to Protocol 3.1 [82]. |
| Commercial Natural Product Extract Libraries | Biological Material | Provide a standardized, diverse starting point for method development and validation (e.g., fungal, plant libraries) [6]. |
| GNPS/MassIVE Public Data Repository | Software/Database | Central platform for performing molecular networking and accessing community reference spectra for dereplication [6]. |
| MZmine 3 | Software | Open-source platform for processing raw LC-MS/MS data: feature detection, alignment, and gap filling [81]. |
R/Python with igraph/tidygraph |
Software | Custom scripting environments for implementing the iterative scaffold-based library selection algorithm [6]. |
| QSRR Model Scripts | Software | Computational tools (e.g., RDKit for descriptors, MLR/ML models) to predict RT and aid feature identification [83]. |
| 96/384-Well Assay Plates | Consumable | Enable high-throughput bioactivity screening, generating the phenotypic/target data needed for correlation analysis [6]. |
This application note details an integrated, assay-agnostic platform that combines LC-MS/MS-based rational natural product library design with functional screening. The core methodology enables an 84.9% reduction in initial library size while increasing bioactivity hit rates across diverse assay formats, from phenotypic models of parasitic infection to target-based enzyme assays [19]. By employing untargeted metabolomics and molecular networking to prioritize scaffold diversity, the approach ensures the retention of bioactive chemical space. The subsequent application of these rationally minimized libraries in target-agnostic cellular screens facilitates the discovery of novel mechanisms, including chemically induced proximity (CIP), while streamlining the critical step of mechanism-of-action (MoA) deconvolution [84]. This workflow provides a general framework for maximizing screening efficiency and hit validation in early drug discovery.
The discovery of novel bioactive molecules from natural sources faces a fundamental bottleneck: the immense size and complexity of extract libraries, which leads to high costs, redundant rediscovery, and low hit rates in high-throughput screening (HTS) [19] [85]. Furthermore, the drug discovery paradigm is increasingly recognizing the limitations of purely target-centric approaches, especially for complex diseases or "undruggable" targets [84]. Target-agnostic (or assay-agnostic) phenotypic screening offers a powerful complementary strategy by directly probing disease-relevant biology without a predefined molecular hypothesis, enabling the discovery of novel mechanisms and therapeutic modalities [84].
This document frames a solution within a broader thesis on LC-MS/MS for rational natural product library design. The central premise is that upfront chemical characterization using LC-MS/MS and molecular networking can create a minimized, diversity-optimized library that performs superiorly in any subsequent screening format—whether phenotypic or target-based. This assay-agnostic utility is demonstrated by increased hit rates in screens against the eukaryotic parasites Plasmodium falciparum and Trincomalee vaginalis (phenotypic) and the influenza virus enzyme neuraminidase (target-based) [19]. The integration of this rationally designed library into a target-agnostic screening framework, which includes strategic assay design and MoA deconvolution pathways, creates a synergistic pipeline for efficient drug discovery [84].
The Assay-Agnostic Screening Framework: From Library Design to MoA
The following diagram outlines the integrated workflow, from the rational design of a natural product library to its deployment in assay-agnostic screening and subsequent hit investigation.
Diagram Title: Integrated Workflow for Rational Library Design and Assay-Agnostic Screening
Core Principles of the Framework
The framework is built on three pillars that confer its assay-agnostic benefit:
- Scaffold-Centric Library Design: Bioactivity is often linked to molecular scaffolds [19]. The LC-MS/MS pipeline groups compounds by structural similarity, allowing the selection algorithm to maximize scaffold diversity rather than the sheer number of molecules. This reduces redundancy and increases the probability that each screened sample represents unique biological activity.
- Functional Screening Readouts: Assays are designed to measure a therapeutically relevant phenotypic change (e.g., cell death, morphological alteration, reporter signal) or a specific biomolecular activity (e.g., enzyme inhibition) [84]. This direct link to function makes the screen agnostic to the specific target, allowing novel mechanisms to emerge.
- Integrated Deconvolution Pathway: The framework anticipates MoA deconvolution by leveraging the existing LC-MS/MS data from the library design phase. For covalent hits, chemoproteomics can rapidly identify targets [84]. For non-covalent hits, the chemical similarity data from molecular networks can guide dereplication and isolation.
Application Notes & Quantitative Performance
The utility of the rationally minimized library was quantitatively assessed across distinct assay types. The performance metrics, summarized in the table below, demonstrate the assay-agnostic benefit.
Table 1: Bioactivity Hit Rates of Full vs. Rationally Minimized Libraries Across Different Assay Formats [19]
| Activity Assay (Type) | Hit Rate in Full Library (1439 extracts) | Hit Rate in 80% Diversity Library (50 extracts) | Hit Rate in 100% Diversity Library (216 extracts) | Performance vs. Random Selection (50 extracts) |
|---|---|---|---|---|
| P. falciparum (Phenotypic) | 11.26% | 22.00% | 15.74% | Outperformed 1000 random iterations (8-14% hit rate) |
| T. vaginalis (Phenotypic) | 7.64% | 18.00% | 12.50% | Outperformed 1000 random iterations (4-10% hit rate) |
| Neuraminidase (Target-Based) | 2.57% | 8.00% | 5.09% | Outperformed 1000 random iterations (0-2% hit rate) |
Key Findings:
- Increased Hit Rate: The rational library designed for 80% scaffold diversity (50 extracts) consistently showed a substantially higher hit rate than the full 1439-extract library across all assay types [19].
- Assay-Agnostic Benefit: The hit rate enhancement was observed in both phenotypic assays (against whole parasites) and a target-based enzyme assay, validating the utility of the library design across screening paradigms.
- Efficiency: The method achieved an 84.9% reduction in library size to reach maximal scaffold diversity, drastically cutting screening costs and time without sacrificing bioactive content [19].
- Retention of Bioactives: In the P. falciparum assay, 84% of mass features correlated with bioactivity in the full library were retained in the 80% diversity library, and 98% in the 100% diversity library [19].
Detailed Experimental Protocols
Protocol I: Rational Natural Product Library Design via LC-MS/MS and Molecular Networking
This protocol details the creation of a minimized, diversity-optimized screening library from a larger natural product extract collection [19].
I. Sample Preparation & LC-MS/MS Analysis
- Extract Preparation: Prepare crude natural product extracts (e.g., from microbial, plant, or marine sources) using standardized organic solvent extraction (e.g., 1:1 methanol:dichloromethane). Dry extracts and reconstitute in an appropriate solvent (e.g., methanol) to a consistent concentration for LC-MS injection.
- LC-MS/MS Data Acquisition: Analyze all library extracts using an untargeted LC-MS/MS method.
- Chromatography: Use a reversed-phase C18 column with a water/acetonitrile gradient (both modified with 0.1% formic acid).
- Mass Spectrometry: Operate the mass spectrometer in data-dependent acquisition (DDA) mode. Acquire full-scan MS1 spectra (e.g., m/z 100-1500) followed by fragmentation (MS2) of the most intense ions.
II. Data Processing & Molecular Networking
- Data Conversion: Convert raw LC-MS/MS files to an open format (e.g., .mzML) using conversion software like MSConvert (ProteoWizard).
- Molecular Networking: Upload processed data to the Global Natural Products Social Molecular Networking (GNPS) platform .
- Create a Classical Molecular Network using default or optimized parameters (precursor ion mass tolerance, fragment ion tolerance, minimum cosine score for spectral similarity).
- The network clusters MS/MS spectra into molecular families (nodes), where edges represent significant spectral similarity, indicating shared scaffolds or structural motifs.
III. Diversity-Based Library Minimization
- Scaffold Identification: Define each molecular family (cluster) in the network as a unique "scaffold" for the purpose of diversity calculation.
- Iterative Selection Algorithm: a. Rank all extracts by the number of unique scaffolds they contain. b. Select the extract with the highest number of scaffolds. This is the first member of the rational library. c. Remove all scaffolds found in the selected extract from the total pool. d. Re-calculate the unique scaffold count for the remaining extracts based on the remaining scaffold pool. e. Select the next extract that adds the greatest number of new, unrepresented scaffolds to the library. f. Iterate steps c-e until a pre-defined threshold of total scaffold diversity is captured (e.g., 80%, 95%, 100%).
- Library Validation: The output is a minimized subset of extracts. Validate by comparing its theoretical scaffold diversity coverage and its performance in bioassays (as in Table 1) against randomly selected subsets of equal size.
Protocol II: Target-Agnostic Cellular Screening for Novel Mechanisms
This protocol outlines a generalized cellular screening approach designed to identify hits with novel mechanisms, such as Chemically Induced Proximity (CIP), and incorporates principles for subsequent MoA deconvolution [84].
I. Assay Design & Execution
- Cell Model Selection: Choose a disease-relevant cell line with a robust, measurable phenotype (e.g., cancer cell proliferation, reporter gene activation under a disease pathway, specific protein aggregation).
- Assay Readout: Design or adopt a readout directly linked to the therapeutic function. Examples include:
- Viability/Proliferation: ATP-based (CellTiter-Glo) or resazurin reduction assays.
- Protein Level/Modification: Immunofluorescence, TR-FRET, or luciferase-based protein complementation assays for target proteins or pathway biomarkers.
- Morphological Change: High-content imaging and analysis.
- Screen Execution: Plate cells in 384-well plates. Using the rational minimal library from Protocol I, add compounds/extracts at a single concentration (e.g., 10 µM for pure compounds, 10 µg/mL for extracts). Include controls (vehicle, positive inhibition/activation). Incubate for a predetermined, relatively short time (e.g., 6-24h) to prioritize primary effects and minimize complex secondary phenotypes [84]. Measure the readout.
II. Hit Triage & Validation
- Primary Hit Selection: Identify hits that significantly modulate the assay signal (e.g., >3 standard deviations from the vehicle mean, or >30% effect [84]).
- Counter-Screening: Eliminate false positives and nuisance compounds by testing hits in orthogonal assays.
- Test for general cytotoxicity in a non-disease relevant cell line.
- Screen for assay interference (fluorescence, quenching, aggregation).
- Dose-Response Confirmation: Re-test confirmed primary hits in a dose-response format (e.g., 8-point serial dilution) to calculate potency (IC50/EC50).
Protocol III: Mechanism-of-Action Deconvolution Strategies
This protocol provides pathways for investigating the MoA of validated hits from a target-agnostic screen, with a focus on identifying novel mechanisms like CIP [84].
I. Leverage Prior LC-MS/MS Data
- Chemical Dereplication: For natural product hits, query the existing LC-MS/MS data and molecular network from Protocol I. Identify the hit's molecular family and search spectral databases (within GNPS, MassBank) to determine if it is a known compound.
- Isolation & Structure Elucidation: If novel, use the LC-MS data to guide the isolation of the pure compound from the source extract via preparative HPLC. Determine structure using NMR and high-resolution MS.
II. Target Identification Approaches
- Chemoproteomics (For Covalent Hits): If the compound contains a reactive warhead (e.g., cysteine-targeting electrophile), use activity-based protein profiling (ABPP). Incubate cell lysates or live cells with the hit compound, often in competition with a broad cysteine-reactive probe. Enrich labeled proteins and identify them via LC-MS/MS to map direct binding targets [84].
- Affinity-Based Pull-Down: For non-covalent hits, create a functionalized derivative (biotin- or agarose-tag) for affinity purification. Incubate with cell lysates, pull down interacting proteins, and identify them by mass spectrometry.
- Genetic/Genomic Screens: Utilize CRISPR knockout or RNAi libraries to identify genes whose loss confers resistance or hypersensitivity to the compound, pointing to its target or pathway.
III. Functional Validation of Novel Mechanisms (e.g., CIP)
- Proteomic Profiling: Conduct global proteomic analysis (e.g., TMT or label-free LC-MS/MS) on treated vs. untreated cells to identify proteins that are selectively degraded or stabilized, a hallmark of molecular glues or PROTACs.
- Ternary Complex Assays: If a protein degrader is suspected, develop biochemical (e.g., AlphaLISA, SPR) or cellular (e.g., NanoBRET) assays to confirm that the compound simultaneously engages both the E3 ligase and the target protein, inducing ternary complex formation.
The Scientist's Toolkit: Essential Research Reagent Solutions
Table 2: Key Reagents and Materials for the Integrated Pipeline
| Item | Function & Application in the Workflow | Key Considerations |
|---|---|---|
| LC-MS/MS System (High-resolution Q-TOF or Orbitrap) | Enables untargeted metabolomic profiling for molecular networking. The cornerstone of the rational library design phase [19]. | High mass accuracy and resolution are critical for confident spectral interpretation and networking. |
| Global Natural Products Social Molecular Networking (GNPS) Platform | A free, cloud-based platform for processing LC-MS/MS data to create molecular networks, enabling scaffold-based analysis and dereplication [19]. | Requires data in open formats (.mzML, .mzXML). Parameter tuning (cosine score, min pairs) affects network quality. |
| Diversity Selection Algorithm (Custom R/Python Script) | Automates the iterative selection of extracts to maximize scaffold diversity in the minimized library [19]. | The algorithm must integrate output from GNPS (cluster information per sample). Code is made publicly available for adaptation [19]. |
| Disease-Relevant Cell Lines & Assay Kits | Form the basis of the target-agnostic functional screen. Phenotypic (viability, imaging) or pathway-specific (luciferase reporter, TR-FRET) readouts are used [84] [19]. | Assay robustness (Z'>0.5) and relevance to disease biology are paramount. Short incubation times can help isolate primary effects [84]. |
| Covalent Compound Library | A specialized collection of compounds with reactive warheads (e.g., targeting cysteine). Serves as an excellent screening library as the warhead provides a built-in handle for rapid target deconvolution via chemoproteomics [84]. | Requires careful handling and controlled screening conditions to avoid non-specific reactivity. |
| Mass Spectrometry-Compatible Viability Assay Reagents (e.g., CellTiter-Glo) | Allows for sequential measurement of cell viability and subsequent LC-MS analysis of the same well, directly linking phenotype to chemistry in screening campaigns. | The reagent must not interfere with downstream chromatographic separation or ion suppression in MS. |
The integration of LC-MS/MS-driven rational library design with assay-agnostic screening principles creates a powerful, efficient discovery engine. This approach directly addresses the major costs and inefficiencies of natural product screening by drastically reducing the library size while increasing the probability of identifying bioactive leads [19]. Its demonstrated success across phenotypic and target-based assays makes it a universally applicable strategy. Furthermore, by designing the screening and deconvolution pathway in tandem—especially through the use of compound libraries with intrinsic handles for target ID—the historically daunting challenge of MoA deconvolution becomes a structured, manageable process [84]. This pipeline is particularly well-suited for uncovering novel therapeutic modalities, such as chemically induced proximity, offering a coherent path from complex natural product mixtures to validated hits with understood mechanisms.
Within the broader thesis on Liquid Chromatography-Tandem Mass Spectrometry (LC-MS/MS) for rational natural product (NP) library design, the phase of independent validation is a critical, non-negotiable checkpoint. Rational design focuses on curating libraries with maximized chemical diversity through strategies like prefractionation and metabolomic-guided selection [85] [49]. However, the true test of this design's value occurs when these libraries—or any externally sourced data—are deployed in a novel experimental context. Independent validation is the systematic process of verifying the identity, purity, and biological relevance of screening hits derived from such external resources [86]. It transitions a "putative hit" from an initial screen into a validated lead with a defined chemical structure and a plausible mechanism of action. This process mitigates risks from false positives, assay artifacts, and misidentification, which are prevalent when working with complex natural product mixtures [85]. In essence, it answers two fundamental questions: "Is the compound what the data says it is?" and "Does it engage the intended biological target?" [87] [86].
Table 1: Key Metadata for Externally Sourced Library Validation
| Validation Parameter | Description | Typical Threshold / Requirement | Primary Analytical Tool |
|---|---|---|---|
| Sample Provenance | Collection agreements, taxonomic ID, geographic origin [85]. | CBD/Nagoya Protocol compliance; voucher specimens [85]. | Database audit, documentation. |
| Chemical Complexity | Extracts vs. prefractionated libraries [85]. | Defined separation method (e.g., HPLC, SFC) [85]. | LC-MS chromatogram review. |
| Data Integrity | Completeness of LC-MS/MS metadata (m/z, RT, fragmentation) [87]. | RAW files with MS1 & MS2 spectra available. | Data audit software. |
| Dereplication Status | Prior identification efforts and known nuisance compounds [85]. | Annotated list of known metabolites. | In-house & public NP databases. |
Core Validation Strategies for External Libraries and Data
Validation is a multi-tiered process, progressing from chemical to biological confirmation. The first tier involves chemical identity validation to ensure the annotated compound is present. Diagnostic Fragmentation Filtering (DFF) is a powerful LC-MS/MS technique for this purpose. It screens data-dependent acquisition (DDA) files for class-specific product ions or neutral losses, enabling the discovery of both known and novel analogues within a compound family in a complex extract [87]. This is particularly vital for validating externally sourced data where compound identities may be preliminary.
The second tier is biological target validation, confirming the hypothesized mechanism of action. Label-free methodologies have become indispensable here, as they study drug-target interactions without requiring chemical modification of the often complex and synthetically challenging natural product [86]. Key methods include:
- Cellular Thermal Shift Assay (CETSA): Measures ligand-induced thermal stabilization of target proteins directly in cells or lysates [86].
- Drug Affinity Responsive Target Stability (DARTS): Exploits increased resistance to proteolysis upon ligand binding [86].
- Stability of Proteins from Rates of Oxidation (SPROX): Tracks changes in methionine oxidation rates as a function of denaturant in the presence of a ligand [86].
These methods provide orthogonal evidence of direct target engagement within a physiologically relevant context.
Diagram: A Two-Tiered Independent Validation Workflow for External NP Data
Application Notes and Detailed Experimental Protocols
Protocol 1: Chemical Validation via Diagnostic Fragmentation Filtering (DFF)
This protocol validates the presence of a specific natural product class in an external LC-MS/MS dataset [87].
Materials: High-resolution LC-MS/MS system (Q-TOF or Orbitrap); RAW data files from external source; MZmine software with DFF module; list of diagnostic fragments/neutral losses for target compound class.
Procedure:
- Data Import and Preprocessing: Import external vendor RAW files into MZmine. Perform mass detection, chromatogram building, deconvolution, isotopic peak grouping, and alignment.
- DFF Parameter Definition: In the DFF module, define the diagnostic filter. For a microcystin validation example [87], key fragments include the
Addaside chain fragment (m/z135.0804) and theMdha-derived neutral loss (123.0582 Da). - Filter Application: Apply the DFF filter to the aligned peak list. The algorithm will screen all MS2 spectra, retaining only those containing the defined diagnostic ions/neutral losses.
- Validation and Annotation: Review filtered spectra. A true positive will show the diagnostic ions with correct mass accuracy (e.g., < 5 ppm) and a plausible isotopic pattern. Annotate the precursor ion and related analogues based on shared fragmentation.
- Reporting: Document the precursor
m/z, retention time, diagnostic ions found, and mass error. Compare these to any annotations provided by the external source to confirm or challenge the initial identification.
Table 2: Example DFF Validation Results for a Hypothetical External Dataset
| External Sample ID | Reported Annotation | Precursor m/z (Found) | Retention Time (Min) | Key Diagnostic Ions (m/z) | Validation Status |
|---|---|---|---|---|---|
| NP-Lib-5421 | Microcystin-LR | 995.5558 (995.5562) | 12.7 | 135.0805, 213.1120, 375.1910 | Confirmed |
| NP-Lib-2187 | "Novel Congener" | 1045.5801 (1045.5795) | 14.3 | 135.0803, 375.1908 | Class Confirmed |
| NP-Lib-8873 | Microcystin-RR | 1038.5350 (1038.5890) | 13.1 | Absent | Rejected |
Protocol 2: Biological Validation via a Label-Free CETSA Workflow
This protocol validates direct target engagement of a screening hit from an external library in a cellular context [86].
Materials: Cell line expressing target protein; compound of interest (validated via DFF); cell culture reagents; thermal cycler or heat block; lysis buffer; centrifuge; SDS-PAGE or quantitative proteomics setup (e.g., LC-MS/MS with TMT labeling).
Procedure:
- Cell Treatment: Harvest and aliquot cells (~2e6 cells/tube). Treat aliquots with vehicle (DMSO) or the validated compound at a relevant concentration (e.g., 10 µM) for 30-60 minutes at 37°C.
- Heat Challenge: Subject each aliquot to a gradient of temperatures (e.g., 37°C to 65°C) for 3 minutes in a thermal cycler. Include an unheated control.
- Cell Lysis and Soluble Protein Isolation: Lyse cells with a non-denaturing buffer. Centrifuge at high speed (20,000 x g) to separate soluble (folded) protein from precipitated aggregates.
- Target Protein Quantification:
- Western Blot Path: Analyze soluble fractions by Western blot for the protein of interest. Quantify band intensity.
- MS-Based Proteomics Path (ITDR-CETSA): For unbiased discovery, digest soluble fractions from vehicle and compound-treated sets, label with TMT isobaric tags, pool, and analyze by LC-MS/MS.
- Data Analysis: Plot the fraction of soluble protein remaining versus temperature to generate melting curves. A positive shift in the melting curve (
ΔTm) in the compound-treated sample indicates thermal stabilization and direct target engagement. - Validation: Confirm the
ΔTmis concentration-dependent (perform Isothermal Dose-Response, ITDR). Use a known inactive analogue as a negative control to confirm specificity.
Diagram: Label-Free CETSA Target Validation Protocol Workflow
The Scientist's Toolkit: Essential Reagents and Materials
Table 3: Key Research Reagent Solutions for Independent Validation
| Reagent / Material | Function / Purpose | Key Considerations for Validation |
|---|---|---|
| High-Res LC-MS/MS System (Q-TOF, Orbitrap) | Core instrument for DFF and proteomic analysis in CETSA [87] [86]. | Resolution > 30,000 FWHM; data-dependent MS2 acquisition capability. |
| MZmine / GNPS Software | Open-source platforms for DFF analysis and molecular networking [87]. | Must be compatible with external vendor data formats. |
| Authentic Natural Product Standards | Gold-standard reference for validating compound identity via RT and MS2 match. | Sourcing can be difficult; use from reputable suppliers. |
| TMT or iTRAQ Isobaric Tags | For multiplexed, quantitative proteomics in MS-based CETSA (ITDR) [86]. | Enables simultaneous analysis of multiple temperature/ dose points. |
| Thermostable Cell Lysis Buffer | For CETSA, maintains protein native state during heating and lysis [86]. | Must be non-denaturing, with protease/phosphatase inhibitors. |
| Citizen-Science Sourced Libraries [85] [49] | Externally sourced libraries with high genetic and potential chemical diversity. | Require strict validation of provenance and IP agreements [85]. |
Thesis Context: This work is framed within a broader research thesis investigating Liquid Chromatography-Tandem Mass Spectrometry (LC-MS/MS) as a primary tool for the rational design of natural product (NP) screening libraries. The central hypothesis is that untargeted metabolomics can generate specific, evidence-based rules for NP library construction, moving beyond traditional, often serendipitous, collection methods to improve the efficiency and success rate of drug discovery campaigns [7].
Natural products remain an indispensable source of novel chemotypes, accounting for a significant proportion of newly approved drugs [6]. However, high-throughput screening (HTS) of NP libraries is frequently hampered by structural redundancy, leading to the costly re-discovery of known bioactives and inefficient use of resources [6]. This has spurred the development of rational methods to prioritize and select library constituents. Two dominant paradigms have emerged: (1) Genomics/Phylogenetics-Based Selection, which leverages genetic data to predict biosynthetic potential, and (2) LC-MS/MS-Based Metabolomics Selection, which directly profiles the expressed chemical landscape. This article provides a comparative analysis of these approaches, detailing their application notes, protocols, and positioning within a rational NP library design workflow.
Core Approaches: Comparative Analysis
The following table summarizes the fundamental principles, strengths, and limitations of the two primary selection strategies.
Table 1: Comparison of Genomics-Based and LC-MS/MS-Based Selection Approaches for NP Library Design
| Feature | Genomics/Phylogenetics-Based Selection | LC-MS/MS Metabolomics-Based Selection (Thesis Context) |
|---|---|---|
| Primary Data | DNA/RNA sequences (Biosynthetic Gene Clusters - BGCs), phylogenetic relationships [88] [89] [90]. | MS1 and MS2 spectral data of expressed metabolites [6] [90]. |
| Core Principle | Selection based on predicted potential to produce diverse or novel NPs, inferred from genetic blueprints. | Selection based on observed chemical diversity and structural redundancy in the extracted metabolome [6]. |
| Key Strength | Identifies silent or lowly expressed BGCs. Can guide genetic engineering. Provides evolutionary context (e.g., allopatric speciation influencing chemotype [88]). | Directly measures the actual chemical output under given conditions. Captures post-biosynthetic modifications. Faster, agnostic to genetic knowledge [6]. |
| Primary Limitation | Gene presence does not guarantee compound expression or detection. Poor correlation between BGC abundance and metabolome complexity [90]. | Misses compounds not expressed under the profiling conditions. Requires high-quality spectral libraries for annotation. |
| Typical Output | Prioritized list of strains or species with high BGC richness or unique clusters [88]. | A minimized library of extracts that maximizes scaffold diversity, often achieving >80% of the full library's chemical space with <15% of the samples [6]. |
| Impact on HTS | May increase the chance of novel discoveries but does not necessarily reduce redundancy or improve immediate hit rates. | Dramatically increases bioassay hit rate by removing redundant chemical profiles. Demonstrated increase from 2.57% to 8.00% hit rate in a neuraminidase assay [6]. |
| Downstream Utility | Essential for genome mining and heterologous expression campaigns. | Provides an annotated, chemically diverse starting point for isolation. Spectra can be used for rapid dereplication [6]. |
Detailed Methodologies and Protocols
Protocol 1: LC-MS/MS-Based Rational Library Minimization
This protocol forms the experimental core of the referenced thesis work [6] [7].
1. Sample Preparation & Data Acquisition:
- Culture & Extraction: Generate crude organic extracts from your microbial or plant library (e.g., 948 Actinomycete strains cultured in multiple media [90]).
- LC-MS/MS Analysis: Perform untargeted LC-MS/MS on all extracts using a standardized method. Use a high-resolution Q-TOF or Orbitrap mass spectrometer.
- Data Conversion: Convert raw files to open formats (e.g., .mzML).
2. Molecular Networking & Spectral Analysis:
- Create a Molecular Network: Process all MS/MS data through the GNPS (Global Natural Products Social Molecular Networking) platform [6] [90].
- Parameters: Use classical molecular networking workflow. Merge spectra with MS-Cluster, create connections where cosine score > 0.7 and minimum matched peaks > 6.
- Output: A network where nodes are consensus MS/MS spectra and edges represent spectral similarity. Each connected cluster corresponds to a molecular scaffold family [6].
3. Rational Library Selection Algorithm:
- Scaffold Census: For each extract, calculate the number of unique molecular network clusters (scaffold families) it contains.
- Iterative Selection:
- Select the extract with the highest number of unique scaffolds.
- Add this extract to the "rational library" list and record all its scaffolds as "covered."
- From the remaining extracts, select the one that adds the largest number of new, uncovered scaffolds to the library.
- Repeat step 3 until a predefined threshold (e.g., 80%, 95%, 100%) of the total unique scaffolds in the full library is covered [6].
- Validation: Test the bioactivity hit rate of the minimized rational library against target assays (e.g., Plasmodium falciparum, enzyme targets) and compare to the full library and randomly selected subsets [6].
Workflow: LC-MS/MS Library Minimization
Protocol 2: Phylogenetically Guided Library Selection via Comparative Genomics
This protocol is derived from studies on meliaceous plants and Hevea species [88] [89].
1. Genome Sequencing & Assembly:
- Sample Selection: Choose taxa based on phylogenetic breadth or specific traits.
- Sequencing: Generate long-read (PacBio, Nanopore) and Hi-C data for chromosome-level, haplotype-resolved assemblies. Aim for Telomere-to-Telomere (T2T) quality where possible [88].
- Assembly & Annotation: Assemble with HiFiasm, annotate genes using BRAKER/Maker pipelines. Identify BGCs with antiSMASH.
2. Comparative & Phylogenomic Analysis:
- Ortholog Identification: Use OrthoFinder to identify single-copy orthologs across target and outgroup species.
- Phylogenetics: Construct a robust species phylogeny from ortholog alignments (e.g., using RAxML/IQ-TREE).
- Synteny & Divergence: Perform whole-genome alignment (e.g., with MUMmer) to identify syntenic blocks, inversions (key in speciation [88]), and calculate divergence times.
- BGC Family Analysis: Classify BGCs into gene cluster families (GCFs) using BiG-SCAPE. Map GCF distribution onto the phylogeny.
3. Selection Criteria for Library Inclusion:
- Clade-Specific BGCs: Prioritize species or strains harboring BGCs unique to a phylogenetic clade.
- Expanded Gene Families: Identify lineages with significant expansion of key biosynthetic genes (e.g., BAHD-acetyltransferases in Meliaceae [88] or specific CPTs in Hevea [89]).
- Correlation with Trait: Use genomic data to explain observed chemical diversity (e.g., specific inversions linked to limonoid acetylation patterns [88]).
Workflow: Phylogenomics for NP Library Design
Integration with Downstream Drug Discovery Workflows
Rational library design is the first step. The selected extracts or prioritized organisms feed into optimization and validation pipelines, where other comparative methods excel.
Pharmacophore-Based Virtual Screening: This structure-based computational method screens compound libraries against a 3D model of essential interactions (pharmacophore) required for biological activity [91]. It is highly effective for scaffold hopping and identifying novel NP leads from digital libraries [92] [93]. A pharmacophore model generated from a known MraY inhibitor or PD-L1 binder can virtually screen millions of compounds, including marine NP databases, to identify promising candidates for experimental testing [75] [93].
Build-Up Library Synthesis for Optimization: For promising NP hits with complex structures, chemical optimization is challenging. The "build-up library" strategy streamlines this: a core NP fragment (e.g., the uridine moiety of MraY inhibitors) is ligated chemoselectively (e.g., via hydrazone formation) with a diverse array of accessory fragments directly in assay plates. This allows for the rapid generation and in situ biological evaluation of hundreds of analogues to establish structure-activity relationships (SAR) and improve drug-like properties [75] [94].
Logical Relationship: From Library Design to Lead
The Scientist's Toolkit: Essential Research Reagents & Materials
Table 2: Key Reagents and Materials for Featured Methods
| Item | Function/Application | Example/Notes |
|---|---|---|
| HiFi & ONT Sequencing Kits | Generation of long-read genomic data for high-quality, haplotype-resolved assemblies of NP-producing organisms [88] [89]. | PacBio HiFi, Oxford Nanopore Ultra-long. |
| antiSMASH Software | Standard platform for the automated identification and annotation of Biosynthetic Gene Clusters (BGCs) in genomic data [90]. | Critical for genomics-based prioritization. |
| LC-MS/MS Grade Solvents | Essential for reproducible metabolite extraction and chromatographic separation in untargeted metabolomics. | Acetonitrile, methanol, water with 0.1% formic acid. |
| GNPS Platform | Cloud-based ecosystem for processing tandem mass spectrometry data, performing molecular networking, and spectral library matching [6] [90]. | Enables scaffold-centric diversity analysis. |
| 96/384-Well Assay Plates | For high-throughput biological screening and for conducting in situ "build-up" library synthesis and testing [75]. | Used in library validation and optimization steps. |
| Core Aldehyde Fragments | Chemically synthesized cores of complex NPs (e.g., MraY inhibitors) for fragment-based library construction [75]. | Contains key pharmacophore (e.g., uridine for MraY binding). |
| Diverse Hydrazide Libraries | Collections of accessory fragments for ligation with core aldehydes via chemoselective hydrazone formation to create analogue libraries [75]. | Includes acyl, amino acyl, and lipidic hydrazides. |
| Pharmacophore Modeling Software | To generate 3D query models from protein-ligand structures or active compounds for virtual screening [91] [93]. | MOE, Discovery Studio, LigandScout. |
| Curated Natural Product Databases | Digital libraries for virtual screening campaigns to identify novel scaffolds matching a pharmacophore [92] [93]. | CMNPD (Marine), NPAtlas. |
Conclusion
The integration of LC-MS/MS-based metabolomics with rational selection algorithms represents a paradigm shift in natural product library design. This approach successfully transforms large, redundant extract collections into compact, chemically diverse libraries that not only retain but often enhance bioactive potential, as evidenced by significantly increased hit rates. The method directly addresses the critical economic and logistical bottlenecks in early drug discovery, enabling more efficient resource allocation, especially for underfunded disease areas. By providing a reproducible pipeline from chemical analysis to validated library construction, it empowers researchers to prioritize quality and diversity over sheer quantity. Future directions include deeper integration with genomic data, automated structure annotation, and the application of machine learning to predict scaffold-bioactivity relationships, further solidifying the role of rational, data-driven design in unlocking the therapeutic promise of natural products.
References
- 1. Revitalizing natural products for sustainable drug Discovery [https://www.sciencedirect.com/science/article/abs/pii/S2352554125001809]
- 2. Natural products in drug discovery: advances and ... [https://www.nature.com/articles/s41573-020-00114-z]
- 3. Natural Products as a Foundation for Drug Discovery - PMC [https://pmc.ncbi.nlm.nih.gov/articles/PMC2813068/]
- 4. The latest advances with natural products in drug discovery ... [https://pubmed.ncbi.nlm.nih.gov/40391763/]
- 5. advances in metabolomics for natural product drug discovery [https://www.sciencedirect.com/science/article/pii/S095816692500117X?via%3Dihub]
- 6. Rationally minimizing natural product libraries using mass ... [https://pmc.ncbi.nlm.nih.gov/articles/PMC11915828/]
- 7. Award Information | HHS TAGGS [https://taggs.hhs.gov/Detail/AwardDetail?arg_AwardNum=R01GM145649&arg_ProgOfficeCode=127]
- 8. Fragment Libraries from Large and Novel Synthetic ... [https://pmc.ncbi.nlm.nih.gov/articles/PMC12044453/]
- 9. The evolution of chemical collections and drug-like diversity [https://www.ddw-online.com/the-evolution-of-chemical-collections-and-drug-like-diversity-36277-202509/]
- 10. Quantitative high-throughput screening data analysis [https://pmc.ncbi.nlm.nih.gov/articles/PMC4375054/]
- 11. Structure-Based Virtual Screening for Drug Discovery [https://pmc.ncbi.nlm.nih.gov/articles/PMC4443793/]
- 12. Untargeted metabolomics approach and molecular ... [https://www.frontiersin.org/journals/molecular-biosciences/articles/10.3389/fmolb.2023.1192088/full]
- 13. Measurement - Marburg - iGEM 2025 [https://2025.igem.wiki/marburg/measurement]
- 14. Guide to Metabolomics Analysis: A Bioinformatics Workflow [https://pmc.ncbi.nlm.nih.gov/articles/PMC9032224/]
- 15. Untargeted Metabolomics for Quality Control [https://www.ometalabs.net/application-notes/metabolomics-qc]
- 16. MetaboAnalyst [https://www.metaboanalyst.ca/]
- 17. Structural and Activity Profile Relationships Between Drug ... [https://pmc.ncbi.nlm.nih.gov/articles/PMC4406972/]
- 18. Systematic assessment of scaffold hopping versus activity ... [https://www.sciencedirect.com/science/article/abs/pii/S0968089615003752]
- 19. Rationally Minimizing Natural Product Libraries Using Mass ... [https://pmc.ncbi.nlm.nih.gov/articles/PMC11142144/]
- 20. Scaffold-Based Drug Design [https://www.biosolveit.de/drug-discovery-solutions/scaffold-based-drug-design/]
- 21. Application of Scaffold-Based Drug Delivery in Oral Cancer ... [https://pmc.ncbi.nlm.nih.gov/articles/PMC11207321/]
- 22. Scaffolds for drug delivery and tissue engineering: The role ... [https://www.sciencedirect.com/science/article/abs/pii/S0168365923003553]
- 23. The development and inter-laboratory verification of LC ... [https://www.sciencedirect.com/science/article/abs/pii/S0039914009003786]
- 24. Unifying principles for the design and evaluation of natural ... [https://pmc.ncbi.nlm.nih.gov/articles/PMC11788825/]
- 25. Current Practices in LC-MS Untargeted Metabolomics [https://pmc.ncbi.nlm.nih.gov/articles/PMC10753522/]
- 26. Optimization of sample preparation and LC-MS analysis ... [https://researchfestival.nih.gov/2024/posters/optimization-sample-preparation-and-lc-ms-analysis-high-throughput]
- 27. Protocol for dual metabolomics and proteomics using ... [https://www.sciencedirect.com/science/article/pii/S2666166725001510]
- 28. mass spectrometry based- untargeted metabolomics ... [https://www.sciencedirect.com/science/article/pii/S2001037025002090]
- 29. Streaming visualisation of quantitative mass spectrometry data ... [https://pmc.ncbi.nlm.nih.gov/articles/PMC4405052/]
- 30. An open-source toolkit to visualize mass spectrometer data [https://www.sciencedirect.com/science/article/pii/S2667145X21000328]
- 31. Molecular Networking - GNPS Documentation - GitHub Pages [https://ccms-ucsd.github.io/GNPSDocumentation/networking/]
- 32. Reproducible molecular networking of untargeted mass ... [https://www.nature.com/articles/s41596-020-0317-5]
- 33. GNPS File Upload - GNPS Documentation - GitHub Pages [https://ccms-ucsd.github.io/GNPSDocumentation/fileupload/]
- 34. Quickstart Create MassIVE/GNPS Public Datasets [https://gnps-quickstart.ucsd.edu/massivesubmission]
- 35. GNPS - Analyze, Connect, and Network with your Mass ... [https://gnps.ucsd.edu/]
- 36. GNPS Dashboard: Collaborative Exploration of Mass ... [https://pmc.ncbi.nlm.nih.gov/articles/PMC8831450/]
- 37. Incorporating LC-MS/MS Analysis and the Dereplication of ... [https://pmc.ncbi.nlm.nih.gov/articles/PMC10468906/]
- 38. LC-MS-based proteomics: insights into natural product- ... [https://www.sciencedirect.com/science/article/pii/S1359644625002478]
- 39. An expanded database of high-resolution MS/MS spectra ... [https://www.nature.com/articles/s41597-025-04488-w]
- 40. Classification of Scaffold Hopping Approaches - PMC [https://pmc.ncbi.nlm.nih.gov/articles/PMC3328312/]
- 41. Iterative computational design and crystallographic screening ... [https://pmc.ncbi.nlm.nih.gov/articles/PMC9258288/]
- 42. Building in molecular diversity for targeted libraries [https://www.sciencedirect.com/science/article/abs/pii/S1740674912000959]
- 43. Scaffold Diversity of Fungal Metabolites - PMC [https://pmc.ncbi.nlm.nih.gov/articles/PMC5376591/]
- 44. Annotation of natural product compound families using ... [https://www.nature.com/articles/s41467-022-35734-z]
- 45. Miniaturized high-throughput conversion of fungal strain ... [https://www.frontiersin.org/journals/chemistry/articles/10.3389/fchem.2025.1630332/full]
- 46. Miniaturized high-throughput conversion of fungal strain ... [https://pmc.ncbi.nlm.nih.gov/articles/PMC12263559/]
- 47. BMDMS-NP: A comprehensive ESI-MS/MS spectral library ... [https://www.sciencedirect.com/science/article/abs/pii/S0031942220302004]
- 48. Enhanced dereplication of fungal cultures via use of mass ... [https://www.nature.com/articles/ja2016145]
- 49. Building Natural Product Libraries Using Quantitative ... [https://pmc.ncbi.nlm.nih.gov/articles/PMC8547436/]
- 50. Mass Spectrometry-Based Approaches in Natural Products ... [https://www.mdpi.com/journal/plants/special_issues/22EM1RIL90]
- 51. Affinity selection mass spectrometry (AS-MS) for ... [https://www.frontiersin.org/journals/natural-products/articles/10.3389/fntpr.2025.1562501/full]
- 52. Mass Spectrometry for Natural Products Research [https://www.chromatographyonline.com/view/mass-spectrometry-natural-products-research-challenges-pitfalls-and-opportunities]
- 53. Tips for Optimizing Key Parameters in LC–MS [https://www.chromatographyonline.com/view/tips-optimizing-key-parameters-lc-ms]
- 54. Optimizing LC–MS and LC–MS-MS Methods [https://www.chromatographyonline.com/view/optimizing-lc-ms-and-lc-ms-ms-methods]
- 55. Learn with Lin about LC–MS bioanalysis: part III tune ... [https://www.bioanalysis-zone.com/learn-with-lin-about-lc-ms-bioanalysis-part-iii-tune-the-triple-quadrupole-system_covance/]
- 56. Optimization and validation of a rapid LC-MS/MS method ... [https://www.sciencedirect.com/science/article/abs/pii/S0308814625021752]
- 57. Ion Suppression: A Major Concern in Mass Spectrometry [https://www.chromatographyonline.com/view/ion-suppression-major-concern-mass-spectrometry]
- 58. Ion suppression correction and normalization for non-targeted ... [https://pmc.ncbi.nlm.nih.gov/articles/PMC11794426/]
- 59. Two Distinct Sample Prep Approaches to Overcome Matrix ... [https://www.sigmaaldrich.com/US/en/technical-documents/technical-article/analytical-chemistry/solid-phase-extraction/sample-prep-overcome-matrix-effect?srsltid=AfmBOord9O1IqQ3EzLgDg_lQ7IeRY6IoBgbIZciIf_W1UvF3hXkAHULY]
- 60. Study of Metabolite Detectability in Simultaneous Profiling ... [https://pmc.ncbi.nlm.nih.gov/articles/PMC12388855/]
- 61. Optimize LC‑MS/MS Sensitivity: Ion Suppression in ... [https://amsbiopharma.com/lc-ms-ms-sensitivity/]
- 62. The effect of sample preparation and data processing [https://www.sciencedirect.com/science/article/abs/pii/S0039914024010373]
- 63. A suggested standard for validation of LC-MS/MS based ... [https://pmc.ncbi.nlm.nih.gov/articles/PMC8600988/]
- 64. Quantitative Data Quality Assurance, Analysis and Presentation [https://pmc.ncbi.nlm.nih.gov/articles/PMC12056448/]
- 65. An automatic LC-MS/MS data analysis workflow for herbal ... [https://www.sciencedirect.com/science/article/abs/pii/S094471132400850X]
- 66. Using System Suitability Tests to Create a Robust Clinical ... [https://myadlm.org/cln/articles/2018/august/using-system-suitability-tests-to-create-a-robust-clinical-mass-spectrometry-service]
- 67. Sensitivity analysis [https://en.wikipedia.org/wiki/Sensitivity_analysis]
- 68. A simplified optimization approach for sample preparation ... [https://pubmed.ncbi.nlm.nih.gov/40038882/]
- 69. Optimizing the affinity selection mass spectrometry ... [https://www.sciencedirect.com/science/article/pii/S2472630324000566]
- 70. Proteomics LC/MS: How to Maximize Sensitivity, Depth of ... [https://www.chromatographyonline.com/view/proteomics-lc-ms-how-to-maximize-sensitivity-depth-of-analysis-throughput-and-robustness]
- 71. Acquisition and Analysis of DIA-Based Proteomic Data [https://www.sciencedirect.com/science/article/pii/S1535947624000021]
- 72. A New Deep Field Scan Liquid Chromatography–Mass ... [https://www.sciencedirect.com/science/article/abs/pii/S0731708525005059]
- 73. Optimizing MS Parameters for Data-Independent ... [https://pubmed.ncbi.nlm.nih.gov/41220336/]
- 74. Advanced Methods for Natural Products Discovery [https://www.mdpi.com/1660-3397/21/5/308]
- 75. Development of a natural product optimization strategy for ... [https://www.nature.com/articles/s41467-024-49484-7]
- 76. Tips and tricks for LC–MS-based metabolomics and ... [https://www.sciencedirect.com/science/article/pii/S0165993624004230]
- 77. Advanced techniques and applications of LC-MS in small ... [https://www.drugtargetreview.com/article/12291/advanced-techniques-applications-lc-ms-small-molecule-drug-discovery/]
- 78. MetaboAnalystR 4.0: a unified LC-MS workflow for global ... [https://www.nature.com/articles/s41467-024-48009-6]
- 79. Accelerating Food Safety Analysis with an Open-Access ... [https://www.chromatographyonline.com/view/accelerating-food-safety-analysis-with-an-open-access-lc-hrms-ms-spectral-library]
- 80. Software Tools and Approaches for Compound ... [https://www.mdpi.com/2218-1989/8/2/31]
- 81. Scalability of mass spectrometry-based metabolomics for ... [https://pubs.rsc.org/en/content/articlehtml/2025/np/d5np00034c]
- 82. The Role of LC-MS in Profiling Bioactive Compounds from ... [https://pmc.ncbi.nlm.nih.gov/articles/PMC12348853/]
- 83. QSRR Models Sharpen Retention Time Predictions for ... [https://www.chromatographyonline.com/view/qsrr-models-sharpen-retention-time-predictions-for-plant-based-bioactives-in-chromatographic-analysis]
- 84. Target agnostic cellular screening in the era of chemically ... [https://pmc.ncbi.nlm.nih.gov/articles/PMC12314798/]
- 85. Creating and screening natural product libraries - PMC [https://pmc.ncbi.nlm.nih.gov/articles/PMC8494140/]
- 86. Target identification and validation of natural products with ... [https://www.sciencedirect.com/science/article/abs/pii/S0163725820302205]
- 87. Natural Product Discovery with LC-MS/MS Diagnostic ... [https://pubmed.ncbi.nlm.nih.gov/31205310/]
- 88. Comparative genomics provides insights into the ... [https://www.nature.com/articles/s41467-025-57722-9]
- 89. Comparative genomics and multiomics analyses reveal the ... [https://pmc.ncbi.nlm.nih.gov/articles/PMC12512020/]
- 90. The undiscovered natural product potential of Actinomycetes [https://www.nature.com/articles/s41429-025-00876-x]
- 91. Applications of the Pharmacophore Concept in Natural ... [https://pmc.ncbi.nlm.nih.gov/articles/PMC7685156/]
- 92. Pharmacophore-based approach for the identification of ... [https://www.sciencedirect.com/science/article/pii/S266702242500012X]
- 93. Structure-Based Pharmacophore Modeling, Virtual ... [https://www.mdpi.com/1660-3397/20/1/29]
- 94. Development of a natural product optimization strategy for ... [https://pubmed.ncbi.nlm.nih.gov/38877016/]