Scaffold Hopping with 3D Pharmacophore Models: A Strategic Guide for Modern Drug Discovery
This article provides a comprehensive guide to 3D pharmacophore modeling for scaffold hopping, a critical technique in computer-aided drug design.
Scaffold Hopping with 3D Pharmacophore Models: A Strategic Guide for Modern Drug Discovery
Abstract
This article provides a comprehensive guide to 3D pharmacophore modeling for scaffold hopping, a critical technique in computer-aided drug design. It begins with foundational principles, explaining the core concepts of pharmacophores and scaffold hopping, and their role in overcoming intellectual property barriers and improving drug properties. The guide then details methodological workflows, from query generation and database screening to hit evaluation. Practical sections address common troubleshooting scenarios and optimization strategies for improving success rates. Finally, the article explores validation techniques and comparative analyses with other structure-based methods, concluding with future directions integrating AI and machine learning for enhanced virtual screening and novel bioactive molecule discovery.
What is 3D Pharmacophore Modeling and How Does It Enable Scaffold Hopping?
Application Notes
This document details the core concepts underpinning modern structure-based drug design, with a specific focus on enabling scaffold hopping through 3D pharmacophore modeling. Within our broader thesis, these concepts form the theoretical and practical foundation for discovering novel chemotypes while maintaining or improving biological activity.
Pharmacophore: The Essential Interaction Blueprint
A pharmacophore is an abstract description of the molecular features necessary for biological activity. It is defined not by specific chemical structures but by the spatial arrangement of Features capable of forming non-covalent interactions with a biological target. The IUPAC definition emphasizes it as "an ensemble of steric and electronic features."
Key Features and Their Typical Chemical Moieties:
- Hydrogen Bond Acceptor (HBA): Carbonyl oxygen, ether oxygen.
- Hydrogen Bond Donor (HBD): Amine, hydroxyl, amide NH.
- Positive Ionizable (PI): Protonated amine, guanidine.
- Negative Ionizable (NI): Carboxylate, phosphate, tetrazole.
- Hydrophobic (H): Alkyl chains, aromatic rings.
- Aromatic Ring (AR): Phenyl, pyridine, other aromatic systems.
Table 1: Common Pharmacophore Feature Types and Tolerances
| Feature Type | Interaction Type | Common Chemical Moieties | Default Tolerance (Å) |
|---|---|---|---|
| Hydrogen Bond Acceptor (HBA) | Electrostatic | O, N in C=O, ethers, etc. | 1.0 - 1.5 |
| Hydrogen Bond Donor (HBD) | Electrostatic | OH, NH, NH2 | 1.0 - 1.5 |
| Positive Ionizable (PI) | Electrostatic | Protonated amines | 1.5 - 2.0 |
| Negative Ionizable (NI) | Electrostatic | COO-, PO4- | 1.5 - 2.0 |
| Hydrophobic (H) | Van der Waals | Alkyl chains, aryl rings | 1.5 - 2.0 |
| Aromatic Ring (AR) | Stacking/Electrostatic | Phenyl, heteroaryl | 1.5 - 2.0 |
Bioisosteres: Functional Molecular Replacements
Bioisosteres are atoms, groups, or molecules that possess similar physical or chemical properties, which produce broadly similar biological effects. The application of bioisosteres is a primary tactic for lead optimization and scaffold hopping. Modern classifications extend beyond classic definitions.
Table 2: Classification of Bioisosteres with Contemporary Examples
| Class | Description | Classic Example | Contemporary Example (Application) |
|---|---|---|---|
| Classical | Similar size, shape, & valence electrons. | -OH / -NH2 | -COOH / -tetrazole (inhibitors of metalloenzymes) |
| Non-Classical | Differ in electronic/structural properties but retain similar biological function. | Benzene / Thiophene | Amide / 1,2,3-Triazole (as protease-resistant backbone) |
| Ring Equivalents | Replacement of an aromatic/cyclic system. | Phenyl / Cyclohexyl | Benzene / Bicyclo[1.1.1]pentane (as sp3-rich phenyl substitute) |
| Functional Mimics | Different groups mimicking a key interaction. | Carboxylic acid / Acyl sulfonamide | Phosphate / Carboxylate isostere (e.g., in nucleotide analogs) |
The Scaffold Hop: Achieving Novelty
A scaffold hop is the successful replacement of the central core structure of an active molecule with a novel, chemically distinct scaffold while retaining affinity for the target. This is the ultimate practical application of pharmacophore and bioisostere concepts. Success is measured by maintaining pharmacophore feature overlap with the new scaffold.
Key Outcomes of a Successful Scaffold Hop:
- Improved intellectual property (IP) position.
- Enhanced physicochemical or ADMET properties.
- Circumvention of pre-existing toxicity or metabolism issues.
- Validation of a target pharmacophore model.
Experimental Protocols
Protocol 1: Generation of a Ligand-Based 3D Pharmacophore Model
Objective: To create a predictive 3D pharmacophore hypothesis from a set of known active ligands for use in virtual screening.
Materials (Research Reagent Solutions Toolkit):
- Software Suite: Molecular Operating Environment (MOE), Phase (Schrödinger), or Catalyst/LigandScout.
- Ligand Set: 15-30 structurally diverse molecules with known IC50/Ki values (min. 4 orders of magnitude potency range).
- Conformational Sampling: Rule-based (e.g., Boltzmann-weighted) or systematic search algorithm.
- Molecular Alignment: Pharmacophore-based or property-field based alignment method.
- Activity Data: pIC50/pKi values for model validation.
Procedure:
- Ligand Preparation: For each active compound, generate a set of low-energy 3D conformations using a conformational search algorithm (e.g., Monte Carlo, LowModeMD) with an energy cutoff of 7-10 kcal/mol above the global minimum.
- Feature Assignment: Define common pharmacophore features (HBA, HBD, H, PI, NI, AR) on all conformers of all active ligands using program-specific definitions.
- Hypothesis Generation: Use the software's built-in algorithm (e.g., common feature identification in Catalyst/Phase) to find spatial arrangements of features common to the most active compounds.
- Model Scoring & Selection: Rank generated hypotheses using a scoring function (e.g., survival score, vector score, cost function). Select the model with the best statistical significance (e.g., lowest cost, highest survival score) and ability to discriminate actives from inactives in a test set.
- Validation: Validate the selected pharmacophore model by screening a decoy set containing known actives and inactives. Calculate enrichment factors (EF) and area under the ROC curve (AUC-ROC) to assess predictive power.
Protocol 2: Implementing a Pharmacophore-Guided Scaffold Hop
Objective: To identify novel chemical scaffolds from a virtual compound library that match the essential pharmacophore of a known active.
Materials (Research Reagent Solutions Toolkit):
- Validated Pharmacophore Model: From Protocol 1 or a target-based method.
- Screening Database: Large (1M+ compounds) commercially available or in-house virtual library in a searchable 3D format (e.g., multi-conformer database).
- Screening Software: Phase, MOE, UNITY/Catalyst, or LigandScout.
- Pre-Filters: Drug-like property filters (e.g., Lipinski's Rule of Five, molecular weight 200-500 Da).
- Post-Processing Tools: Docking software (e.g., Glide, GOLD) and visual inspection interface.
Procedure:
- Database Preparation: Prepare the screening database by generating a representative set of conformers for each molecule (e.g., using OMEGA or CONFGEN). Apply broad property filters to remove undesirable compounds.
- Pharmacophore Screening: Perform a 3D flexible search against the pharmacophore model. Allow features to map with defined tolerance (e.g., 1.5 Å). Set the search to require matching of all or a critical subset of features (e.g., 4 out of 5).
- Hit Retrieval & Clustering: Retrieve all matching compounds. Cluster results based on chemical scaffolds (e.g., using Murcko scaffolds) to group chemically similar hits.
- Visual Inspection & Priority Ranking: Visually inspect top hits from each cluster to ensure sensible chemistry and feature mapping. Rank based on fit value, chemical novelty, and synthetic accessibility.
- Docking Validation (Optional but Recommended): Dock the highest-ranking novel scaffolds into the target's binding site (if a structure is available) to confirm the proposed binding mode and check for steric clashes not captured by the pharmacophore.
- Selection for Synthesis/Purchase: Select 10-50 diverse, high-ranking scaffold-hop candidates for biological testing.
Title: Workflow for Ligand-Based Pharmacophore Modeling
Title: Workflow for Pharmacophore-Guided Scaffold Hopping
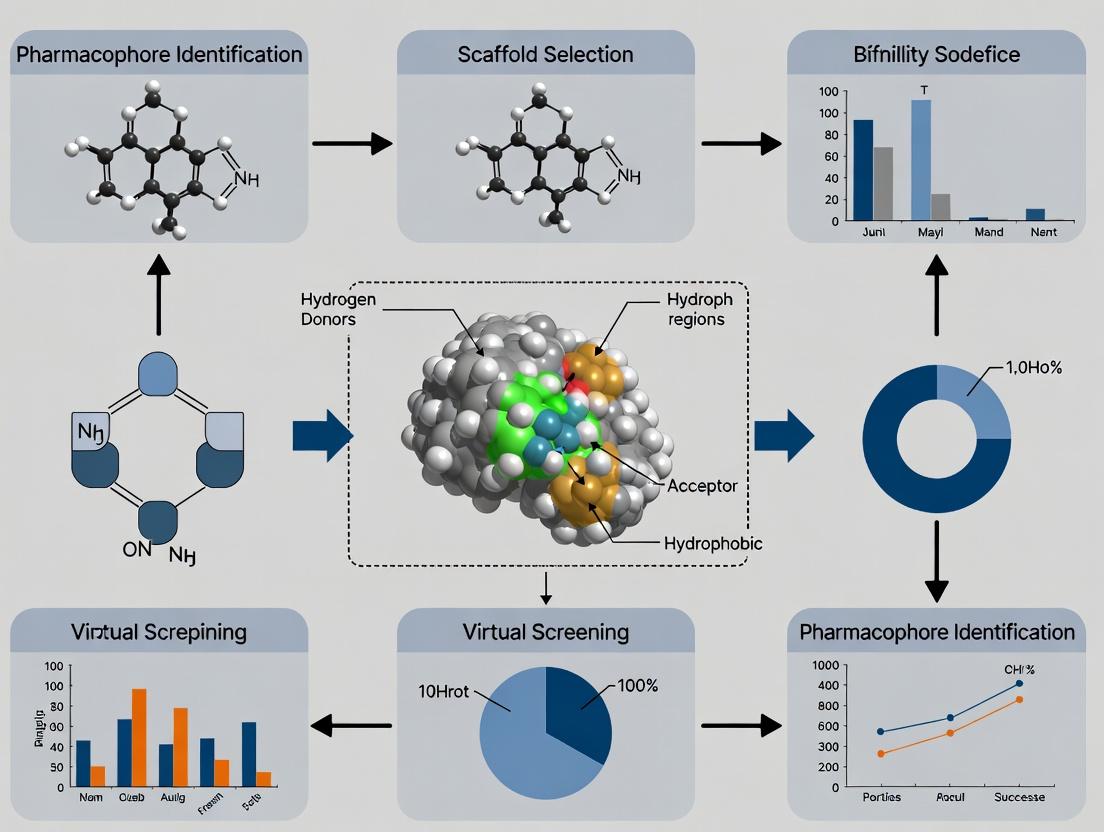
Within the paradigm of modern drug discovery, the identification of novel chemical scaffolds that retain biological efficacy while improving properties like patentability, synthetic feasibility, or ADMET (Absorption, Distribution, Metabolism, Excretion, and Toxicity) is a critical objective. This article, framed within a broader thesis on 3D pharmacophore modeling, posits that scaffold hopping is not merely a useful technique but a strategic imperative. It leverages the core principle that biological activity is encoded in the 3D arrangement of essential pharmacophoric features (e.g., hydrogen bond donors/acceptors, hydrophobic regions, charged groups), which can be transferred between chemically distinct core structures. The protocols herein detail the application of 3D pharmacophore modeling to enable rational and successful scaffold hops.
Application Note 1: Virtual Screening for Scaffold Hopping Using a 3D Pharmacophore Query
Objective: To identify novel chemotypes from a large compound library that match the essential 3D pharmacophore of a known active molecule, enabling scaffold hops.
Background: A pharmacophore model abstracts a known active ligand into a set of steric and electronic features necessary for molecular recognition. Screening databases with this model identifies hits based on feature overlap, not structural similarity.
Protocol:
Pharmacophore Model Generation:
- Input: A high-resolution co-crystal structure of the target protein with a potent ligand (from PDB) OR a conformationally expanded set of a known active ligand.
- Software: Use tools like MOE (Molecular Operating Environment), Phase (Schrödinger), or Catalyst (BIOVIA).
- Steps: a. For structure-based generation, analyze ligand-protein interactions. Define key features: H-bond donors/acceptors (from ligand or protein complementary features), hydrophobic contacts, aromatic rings, ionic interactions. b. For ligand-based generation, align multiple active compounds and derive common feature hypotheses. c. Define excluded volumes from the protein binding site to penalize steric clashes. d. Generate a validated pharmacophore model (e.g., with 4-6 features). Validate using a decoy set containing known actives and inactives.
Database Screening:
- Database: Prepare a searchable 3D database (e.g., ZINC, Enamine REAL, in-house collections) with pre-computed conformers.
- Screening: Execute the pharmacophore query against the database. Set tolerance for feature matching (typically 1.0-2.0 Å).
- Output: A hit list ranked by fit value or RMSD to the query.
Post-Screening Analysis:
- Docking: Subject top pharmacophore hits to molecular docking into the target's binding site to assess predicted binding poses and scores.
- Cluster Analysis: Cluster hits by chemical scaffold to identify promising novel chemotypes for the scaffold hop.
- Visual Inspection: Manually inspect top representatives of each cluster for synthetic accessibility and drug-like properties.
Key Quantitative Outputs (Example):
Table 1: Virtual Screening Results Using a 4-Point Pharmacophore Query
| Metric | Value | Description |
|---|---|---|
| Database Size | 1,000,000 compounds | Pre-filtered for drug-like properties |
| Pharmacophore Features | 1 HBA, 1 HBD, 2 Hy (Hydrophobic) | Derived from known EGFR inhibitors |
| Hit Count (Fit Value ≥ 2.0) | 2,450 compounds | Initial pharmacophore matches |
| After Docking (GlideScore ≤ -8.0) | 127 compounds | Filtered for plausible binding poses |
| Unique Scaffolds Identified | 18 chemotypes | Cluster analysis (Tanimoto coefficient < 0.4) |
Diagram: 3D Pharmacophore Screening Workflow
Title: Workflow for Pharmacophore-Based Scaffold Hopping
Application Note 2: Structure-Based Scaffold Replacement via Core Morphing
Objective: To systematically replace a central core in a lead compound while conserving critical binding interactions, guided by a protein structure-derived pharmacophore.
Background: Given a lead compound with a problematic scaffold (e.g., toxicophore, poor solubility), this protocol uses the target binding site to design a new core that maintains the vectorial orientation of key substituents.
Protocol:
Binding Site & Lead Analysis:
- Load the protein-ligand complex. Identify and map:
- Anchor Points: Strong, directional interactions (e.g., hydrogen bonds to protein backbone).
- Occupied Subpockets: Hydrophobic clefts, solvent-exposed regions.
- Fragment the lead molecule into: Core (to be replaced), R-groups (critical substituents to retain).
- Load the protein-ligand complex. Identify and map:
Pharmacophore-Constrained Core Search:
- Constraint Definition: Define the 3D spatial positions where the new core must connect the R-group vectors. These become pharmacophore points (e.g., vector constraints for bond formation).
- Database Search: Use a ring/cyclic fragment database (e.g., eMolecules). Search for fragments that can span the distance and angle between the defined connection points.
- Shape Filtering: Apply a shape filter based on the excluded volume spheres from the original binding site to ensure the new core fits sterically.
Linking & Elaboration:
- Connect the highest-ranking new core fragment to the retained R-groups using appropriate linkers.
- Perform geometry optimization and conformational search on the newly assembled molecule in the context of the binding site.
Binding Affinity Prediction:
- Use free energy perturbation (FEP+) or MM/GBSA calculations on a shortlist of designs to rank-order them by predicted ΔG binding.
The Scientist's Toolkit: Key Reagents & Software
| Item | Category | Function in Scaffold Hopping |
|---|---|---|
| Protein Data Bank (PDB) | Database | Source of high-resolution target-ligand complexes for structure-based modeling. |
| ZINC/Enamine REAL | Compound Database | Large libraries of commercially available, synthesizable compounds for virtual screening. |
| MOE or Schrödinger Suite | Software Platform | Integrated environment for pharmacophore modeling, docking, and molecular mechanics calculations. |
| FEP+ Module | Software Tool | Provides high-accuracy relative binding free energy predictions for ranking designed analogs. |
| Fragment Library (e.g., EFF) | Chemical Database | Curated collection of small, 3D-shaped fragments for core replacement and growing. |
Diagram: Structure-Based Core Replacement Logic
Title: Logic of Structure-Based Core Morphing
Experimental Protocol: Validation via Biochemical Assay
Objective: To experimentally validate the activity of scaffold-hopped compounds identified through 3D pharmacophore modeling.
Materials:
- Purified target protein (e.g., kinase, protease).
- Scaffold-hopped compounds (synthesized or sourced).
- Reference/control inhibitor.
- Assay-specific reagents (substrate, co-factors, detection reagents).
- 384-well assay plates.
- Plate reader (fluorescence, luminescence, or absorbance).
Methodology (For a Generic Kinase Assay):
Compound Preparation:
- Prepare 10 mM DMSO stock solutions of test compounds.
- Generate 11-point, 1:3 serial dilutions in DMSO in a separate dilution plate.
- Transfer 0.1 µL of each dilution to the assay plate using a nanoliter dispenser. Include DMSO-only wells for positive control (0% inhibition) and a well-saturating concentration of reference inhibitor for negative control (100% inhibition).
Enzyme Reaction:
- Prepare reaction mix: 50 nM kinase, appropriate ATP concentration (near Km), and substrate (e.g., peptide) in assay buffer.
- Dispense 5 µL of reaction mix to each well of the assay plate. Pre-incubate for 15 minutes at room temperature.
Detection:
- Initiate reaction by adding 5 µL of ATP solution (if not already in mix).
- Incubate for 60 minutes at RT.
- Stop reaction and develop signal using a coupled detection system (e.g., ADP-Glo Kinase Assay).
- Measure luminescence on a plate reader.
Data Analysis:
- Calculate % Inhibition:
100 * (1 - (Signal_compound - Signal_100%Inh)/(Signal_0%Inh - Signal_100%Inh)). - Fit dose-response curves using a 4-parameter logistic model in software like GraphPad Prism to determine IC₅₀ values.
- Calculate % Inhibition:
Table 2: Example Biochemical Validation Data for Scaffold-Hopped Hits
| Compound ID | Original Scaffold? | Pharmacophore Fit Value | Predicted ΔG (kcal/mol) | Experimental IC₅₀ (nM) | Fold-Change vs. Lead |
|---|---|---|---|---|---|
| Lead-A | Yes (Reference) | 2.95 | -10.2 | 12.5 ± 1.8 | 1.0 |
| SH-001 | No (Pyrazole) | 2.87 | -9.8 | 45.3 ± 5.2 | 3.6 |
| SH-012 | No (Quinazoline) | 2.91 | -10.5 | 8.7 ± 0.9 | 0.7 |
| SH-043 | No (Aminopyrimidine) | 2.78 | -9.5 | 210 ± 25 | 16.8 |
3D pharmacophore modeling is a cornerstone of modern ligand-based drug design, enabling the transition from concrete molecular structures to an abstract representation of essential interactions necessary for biological activity. Within the broader thesis of enabling scaffold hops in drug discovery, pharmacophores serve as the conceptual bridge. A scaffold hop replaces the core structure of an active compound while retaining its ability to interact with the biological target, necessitating a focus on critical interaction points rather than the scaffold itself. This document details the application notes and protocols for constructing and validating 3D pharmacophore models with the explicit goal of facilitating successful scaffold hops.
Pharmacophore Model Creation: A Two-Stage Protocol
The creation of a robust, query-ready pharmacophore model follows a defined, two-stage process: 1) Hypothesis Generation and 2) Refinement & Validation.
Stage 1: Hypothesis Generation Protocol
Objective: To derive an initial 3D pharmacophore hypothesis from a set of known active molecules.
Materials & Pre-processing:
- Active Ligand Set: A minimum of 3-5 structurally diverse molecules with confirmed activity (IC50/Ki < 10 µM) against the target.
- Software: Molecular modeling suite (e.g., MOE, Discovery Studio, Phase).
- Preparative Steps:
- Conformer Generation: For each ligand, generate an ensemble of low-energy conformers (protocol: MMFF94s force field, energy cutoff: 10-15 kcal/mol above global minimum, max conformers: 250).
- Structural Alignment: Align molecules based on a common substructure or using flexible alignment methods to maximize 3D similarity of pharmacophoric features.
Procedure:
- Feature Mapping: Define the chemical features present in each aligned active molecule. Common features include: Hydrogen Bond Donor (HBD), Hydrogen Bond Acceptor (HBA), Hydrophobic (H), Positive Ionizable (PI), Negative Ionizable (NI), and Aromatic Ring (AR).
- Common Feature Identification: The software algorithm identifies features that are spatially conserved across the set of aligned active molecules.
- Hypothesis Output: The algorithm generates multiple pharmacophore hypotheses, each consisting of a 3D arrangement of features with distance and angle constraints.
Deliverable: A ranked list of initial pharmacophore hypotheses.
Workflow Diagram:
Title: Workflow for Initial Pharmacophore Hypothesis Generation
Stage 2: Refinement & Validation Protocol
Objective: To select the most discriminative hypothesis and validate its ability to identify actives and reject inactives.
Materials:
- Validation Database: A prepared database containing:
- Known active molecules (decoys + actives not used in generation).
- Known inactive molecules or presumed inactives (e.g., property-matched decoys from DUD-E or DEKOIS).
- Software: As in Stage 1.
Procedure:
- Hypothesis Screening: Use each initial hypothesis as a 3D query to screen the validation database.
- Performance Metrics Calculation: For each hypothesis, calculate:
- Enrichment Factor (EF) at 1% of the database:
EF = (Hitssampled / Nsampled) / (Hitstotal / Ntotal) - Area Under the ROC Curve (AUC-ROC): Measures the model's ability to rank actives above inactives.
- Güner-Henry (GH) Score: Combines yield of actives, false positives, and false negatives.
- Enrichment Factor (EF) at 1% of the database:
- Hypothesis Selection: Select the hypothesis with the highest EF, AUC-ROC, and GH Score.
- Feature Tolerance Adjustment: Manually or automatically refine the spatial tolerances (radius of spheres) of each feature to optimize selectivity.
- Exclusion Volume Addition (Optional): Add exclusion spheres in regions occupied by the aligned actives to penalize molecules that clash with the target's receptor wall, enhancing selectivity.
Deliverable: A validated, refined 3D pharmacophore query ready for virtual screening.
Validation Logic Diagram:
Title: Pharmacophore Hypothesis Validation & Refinement Logic
Quantitative Performance Metrics for Pharmacophore Models
Table 1: Typical performance benchmarks for a pharmacophore model intended for scaffold hopping.
| Metric | Excellent | Good | Acceptable | Calculation Formula |
|---|---|---|---|---|
| EF (1%) | >30 | 20-30 | 10-20 | EF = (Hitssampled / Nsampled) / (Hitstotal / Ntotal) |
| AUC-ROC | >0.90 | 0.80-0.90 | 0.70-0.80 | Area under the Receiver Operating Characteristic curve |
| GH Score | >0.70 | 0.50-0.70 | 0.30-0.50 | GH = (Ha / (Ht * A)) * (1 - ((Ht - Ha) / (D - A))) |
EF: Enrichment Factor; AUC: Area Under the Curve; GH: Güner-Henry; Ha: Hits active (true positives); Ht: Total hits; A: Total actives in DB; D: Total compounds in DB.
The Scientist's Toolkit: Key Research Reagents & Materials
Table 2: Essential components for a 3D pharmacophore modeling project.
| Item / Solution | Function / Purpose |
|---|---|
| Curated Active Ligand Set | Provides the structural basis for feature extraction. Must be diverse and have confirmed, potent biological activity. |
| Validated Inactive/Decoy Set | Critical for model validation. Decoys should have similar physicochemical properties but dissimilar 2D topology to actives. |
| Molecular Modeling Software | Platform for conformational analysis, alignment, feature identification, and 3D search (e.g., Schrödinger Phase, MOE, Discovery Studio). |
| High-Performance Computing Cluster | Enables computationally intensive steps like multi-molecule conformational analysis and large-scale database screening. |
| Public/Proprietary Compound Database | The screening target for the validated query (e.g., ZINC, Enamine REAL, in-house corporate library). |
Application Note: Enabling a Scaffold Hop
Scenario: Identifying novel kinase inhibitors via a pharmacophore derived from known adenine-mimetic scaffolds.
Protocol:
- Template Selection: Use three known ATP-competitive inhibitors with different hinge-binding motifs (e.g., purine, pyrazole, aminopyrimidine).
- Generate Hypothesis: Follow Stage 1 protocol. The resulting model will abstract key features: a hydrogen bond acceptor/donor pair for the hinge, a hydrophobic feature for the gatekeeper region, and a donor/acceptor for the kinase front pocket.
- Validate: Screen a database containing known actives and inactives for the same kinase. A successful model will retrieve diverse chemotypes, not just analogues of the training set.
- Screen & Prioritize: Use the validated query to screen a large vendor library. Prioritize hits that match the pharmacophore but contain entirely novel core rings.
- Experimental Testing: Synthesize or procure top-ranked novel scaffolds and test for kinase inhibition.
This process exemplifies the core philosophy: moving from active molecules (concrete) to an abstract query (the pharmacophore) to discover new active molecules with novel scaffolds, completing the scaffold hop cycle.
In the pursuit of novel therapeutics, scaffold hopping—identifying new chemotypes that maintain or improve biological activity—is a critical strategy to overcome patent limitations and improve drug-like properties. This article, framed within a broader thesis on 3D pharmacophore modeling for scaffold hops research, provides detailed application notes and protocols for major computational platforms. 3D pharmacophore models abstract essential steric and electronic features responsible for molecular recognition, providing a powerful template for virtual screening across diverse chemical libraries to identify novel scaffolds.
The following table summarizes the core capabilities of three leading commercial software suites for pharmacophore modeling and scaffold hopping.
Table 1: Comparative Overview of Key Pharmacophore Modeling Platforms
| Feature / Platform | MOE (Molecular Operating Environment) | Discovery Studio (BIOVIA) | Schrödinger Phase |
|---|---|---|---|
| Primary Developer | Chemical Computing Group (CCG) | Dassault Systèmes BIOVIA | Schrödinger, Inc. |
| Core Pharmacophore Method | Pharmacophore Query Editor | Catalyst/HipHop algorithm | Common Pharmacophore Identification (CPH) |
| Key Strengths | Integrated suite with molecular modeling, QSAR, and structure-based design. Robust scripting (SVL). | Intuitive workflow-driven interface. Strong legacy from Accelrys Catalyst. | Tight integration with Glide docking & FEP+. Advanced scoring & constraint handling. |
| Typical Scaffold Hop Workflow | 1. Conformational ensemble generation.2. Pharmacophore feature perception from aligned actives or protein site.3. Database screening with 3D query.4. Scoring and visualization of hits. | 1. Feature mapping of ligands.2. Generate hypotheses (HipHop for alignments, HypoGen for QSAR).3. Validate hypothesis (cost analysis, test set prediction).4. Screen databases (e.g., Catalyst DB). | 1. Create pharmacophore from receptor site or ligand set.2. Screen pre-aligned multi-conformer libraries (e.g., Phase DB).3. Rank hits by fitness score and vector terms.4. Seamless follow-up with docking (Glide). |
| Database Screening | In-house & corporate DBs via MOE-DB. Supports 3D shape/feature searches. | Integrated Catalyst Database format. Can screen corporate DBs. | Pre-aligned, multi-conformer Phase databases; integrated with Schrödinger's broader library. |
| Recent Update (as of 2024) | Enhanced pharmacophore fingerprinting for similarity searches and machine learning integrations. | Continued development of "Protein Pharmacophore" features for cryo-EM derived models. | Improved handling of macrocycles and covalent inhibitors in pharmacophore generation. |
Detailed Application Notes & Protocols
Protocol: Structure-Based Pharmacophore Generation & Screening using Discovery Studio
Objective: To generate a pharmacophore model from a protein-ligand complex and use it for scaffold hopping.
Materials & Reagents:
- Protein Data Bank (PDB) Structure: e.g., 1M17 (CDK2 with inhibitor).
- Software: BIOVIA Discovery Studio (v2024 or later).
- Ligand Database: Pre-prepared 3D multi-conformer database (e.g., ZINC20 subset, Enamine REAL).
Procedure:
- Prepare the Protein-Ligand Complex:
- Load the PDB file (
1M17.pdb). - Run the "Prepare Protein" protocol: add missing hydrogens, assign correct ionization states at pH 7.4, remove water molecules beyond 5.0 Å from the ligand.
- Isolate the original co-crystallized ligand.
- Load the PDB file (
Generate the Receptor-Ligand Pharmacophore:
- Navigate to the "Pharmacophore" module. Select "Create Pharmacophore Features from Receptor-Ligand Complex".
- Set parameters: Feature set to "Common features" (H-bond Donor/Acceptor, Hydrophobic, Ionic, etc.). Interaction distance tolerance: 1.0 Å.
- Execute. The protocol maps features onto the ligand based on potential interactions with the receptor, creating features like
HBA_1,HBD_2,HY_3.
Refine and Validate the Model:
- Manually edit features: Remove redundant or unclear features. Adjust feature radii based on binding site flexibility (default 1.0-1.2 Å).
- Validate by screening a small set of known actives and decoys. Calculate the enrichment factor (EF) and Güner-Henry (GH) score.
Database Screening for Scaffold Hops:
- Use the "Search 3D Database" protocol. Load the refined pharmacophore query and the 3D ligand database.
- Set screening parameters: Maximum omitted features = 1; Conformation generation method = "Best".
- Run the screening. Output is a list of hits ranked by "FitValue" (0.0 to 3.0).
Analysis of Hits:
- Visually inspect top-ranking hits overlaid on the pharmacophore model.
- Cluster hits by chemical scaffold using the "Find Diverse Molecules" or "Cluster Molecules" protocol.
- Select representatives from novel scaffold clusters for further in silico assessment (e.g., docking, ADMET prediction).
Protocol: Ligand-Based Pharmacophore Modeling using Schrödinger Phase
Objective: To derive a common pharmacophore hypothesis (CPH) from a set of active ligands and identify novel scaffolds.
Materials & Reagents:
- Ligand Set: 15-30 known active compounds with diverse scaffolds but similar activity (pIC50 range: 6.0-9.0).
- Software: Schrödinger Suite (Maestro GUI) with Phase module.
- Database: Phase-compatible 3D multi-conformer database.
Procedure:
- Prepare Ligands and Generate Conformers:
- Input 2D structures (SD file) of active ligands. Use the "LigPrep" module to generate realistic 3D geometries, tautomers, and ionization states at pH 7.0 ± 2.0.
- In Phase, use the "Develop Pharmacophore Model" workflow. Select the prepared ligands and run "Conformer Generation" (energy window: 10 kcal/mol, max conformers per ligand: 100).
Identify Common Pharmacophores:
- Run the "Find Common Pharmacophores" step. Select variant atoms for feature mapping (e.g., Hydrogen Bond Acceptor (A), Donor (D), Hydrophobic (H), Aromatic Ring (R)).
- Set minimum number of sites to match (e.g., 4 out of 5). Run the search.
- The output is a list of ranked CPHs based on survival scores (weighted combination of vector, volume, selectivity scores).
Select and Score the Best Hypothesis:
- Choose the top-ranked CPH with a balanced survival score and good geometric arrangement. Visualize the alignment of active ligands on the hypothesis.
- Validate by scoring a set of actives and inactives. A good hypothesis should clearly separate the two sets using the Phase screening score.
Screen for Novel Scaffolds:
- Use the "Screen Databases" panel. Load the selected CPH and the target Phase database.
- Set screening constraints: Require matches to all critical sites (e.g., 3 specific sites must match, 1 optional).
- Execute the screen. Hits are ranked by the "Phase HypoScore".
- Apply a shape screening filter (van der Waals scoring) to prioritize hits that fit the excluded volume of the active site.
Post-Screening Analysis:
- Export top 500 hits. Perform scaffold analysis (e.g., using RDKit in a Python script or Maestro's analysis tools) to identify Bemis-Murcko frameworks not present in the original training set.
- Subject these novel scaffold hits to induced-fit docking (IFD) for detailed binding mode analysis.
Visualizations
Pharmacophore-Based Scaffold Hop Workflow
Title: Generalized Workflow for Pharmacophore-Based Scaffold Hopping
Key Features in a 3D Pharmacophore Model
Title: Core Pharmacophore Features and Their Molecular Origins
The Scientist's Toolkit: Essential Research Reagent Solutions
Table 2: Key Reagents & Materials for Pharmacophore Modeling & Validation
| Item | Function in Scaffold Hop Research | Example/Notes |
|---|---|---|
| High-Quality Protein Structures | Source for structure-based pharmacophore generation. Essential for defining excluded volumes. | PDB entries, in-house crystal structures, or high-resolution AlphaFold2 models. |
| Curated Ligand Activity Data | Foundation for ligand-based model training and validation (QSAR). | ChEMBL database extracts, in-house bioassay results (IC50, Ki). Requires careful curation for consistent units and conditions. |
| 3D Multi-Conformer Databases | Pre-computed compound libraries for high-throughput pharmacophore screening. | ZINC, Enamine REAL, MCULE, or corporate libraries processed with OMEGA (OpenEye) or CONFGEN (Schrödinger). |
| Decoy Sets | For validating model selectivity and calculating enrichment metrics. | Directory of Useful Decoys (DUD-E) or generated decoys matched on physicochemical properties but not activity. |
| Scripting & Automation Tools | For customizing workflows, batch analysis, and integrating different software outputs. | Python/R scripts with RDKit, Knime, Pipeline Pilot, or vendor-specific languages (SVL for MOE). |
| Visualization & Analysis Software | Critical for interpreting screening results, inspecting overlays, and communicating findings. | Maestro (Schrödinger), Discovery Studio Visualizer, PyMOL, ChimeraX. |
Step-by-Step Workflow: Building and Applying 3D Pharmacophore Models for Virtual Screening
Within the broader research on 3D pharmacophore modeling for scaffold hopping, the initial and critical step is the rigorous preparation and conformational analysis of known active ligands. This phase establishes the foundational dataset from which common pharmacophoric features are abstracted. The quality of this input directly dictates the success of subsequent virtual screening in identifying novel chemotypes (scaffold hops) that satisfy the same three-dimensional arrangement of physicochemical features.
The objective is to curate a set of experimentally validated, structurally diverse active compounds against the target of interest. Conformational analysis explores the accessible 3D space of each molecule to ensure the bioactive conformation is representable within the generated ensemble. Key considerations include:
- Source Database Selection: Reliable bioactivity databases are essential.
- Activity Criteria: Defining a potency cut-off (e.g., IC50 < 100 nM) ensures ligand quality.
- Chemical Diversity: A diverse set reduces bias towards a specific scaffold.
- Conformer Generation: Balancing computational cost with conformational coverage is crucial.
Table 1: Common Public Bioactivity Data Sources for Input Curation
| Data Source | Primary Focus | Typical Activity Metrics Provided | Key Utility in Pharmacophore Modeling |
|---|---|---|---|
| ChEMBL | Curated bioactivity data from literature | IC50, Ki, EC50, Inhibition % | Primary source for validated actives with structured data. |
| PubChem BioAssay | Results from HTS campaigns | Activity Score, AC50, Inhibition | Useful for finding actives from large-scale screens. |
| BindingDB | Measured binding affinities | Kd, Ki, IC50 | Focus on protein-ligand binding constants. |
| PDBbind | Complexed structures in PDB | Kd, Ki, IC50 | Links 3D structure with binding affinity for key ligands. |
Table 2: Quantitative Comparison of Conformer Generation Algorithms
| Method (Software Example) | Typical Max Conformers Generated | Computational Speed | Handling of Macrocycles | Key Parameter for Coverage |
|---|---|---|---|---|
| Systematic Search (RDKit) | 10 - 50 (pruned) | Fast | Poor | Rotatable bond increment (e.g., 15° or 30°) |
| Random Search (OMEGA) | 100 - 500 | Medium | Good | Energy window (e.g., 10-15 kcal/mol) and RMSD cutoff (e.g., 0.5 Å) |
| Genetic Algorithm (MOE) | 100 - 250 | Medium | Fair | Population size, iteration count |
| Boltzmann Jump (ConfGen) | 50 - 200 | Medium-High | Good | Energy window and RMS threshold |
Experimental Protocols
Protocol 3.1: Input Ligand Curation and Preparation
Objective: To compile and prepare a clean, standardized set of active ligands from public databases.
- Data Retrieval: Query ChEMBL/BindingDB for target (e.g., "GSK-3β") with a potency filter (e.g., "IC50 < 100 nM").
- Deduplication: Remove duplicates by canonical SMILES. Retain the most potent instance for duplicate structures.
- Structural Standardization (Using RDKit or KNIME): a. Neutralize charges (e.g., remove protonation from carboxylates). b. Generate canonical tautomer. c. Add explicit hydrogens. d. Generate 3D coordinates (using ETKDG method). e. Apply a brief energy minimization (MMFF94, 200 iterations).
- Dataset Finalization: Export the prepared molecules in a common format (e.g., .sdf, .mol2) for conformational analysis.
Protocol 3.2: Multi-Algorithm Conformational Ensemble Generation
Objective: To generate a representative ensemble of low-energy conformers for each active ligand.
- Software Setup: Utilize two complementary tools: OpenEye OMEGA (for broad coverage) and Schrödinger's MacroModel (for precise low-energy sampling).
- OMEGA Protocol:
a. Input: Prepared .sdf file from Protocol 3.1.
b. Parameters: Set
-maxconf 300,-ewindow 15.0(kcal/mol),-rms 0.5(Å). Enable-strictStereo. c. Execution: Run from command line:omega2 -in input.sdf -out omega_confs.sdf. - MacroModel Protocol (Alternative/Validation): a. Import ligands into Maestro. b. Use Mixed Torsional/Low-Mode sampling (MMFFs force field). c. Parameters: Max steps: 5000, energy window: 10 kcal/mol, max conformers: 100. d. Minimize all output conformers (Polak-Ribière conjugate gradient, 500 iterations).
- Ensemble Merging and Clustering (Using RDKit): a. Merge conformer sets from both methods. b. Cluster conformers based on heavy-atom RMSD (cutoff = 1.0 Å). c. Select the lowest-energy conformer from each significant cluster to create a final, diverse, and energy-refined conformational library for pharmacophore generation.
The Scientist's Toolkit
Table 3: Essential Research Reagent Solutions for Input Preparation & Conformational Analysis
| Item | Function/Description |
|---|---|
| Cheminformatics Toolkit (RDKit) | Open-source toolkit for molecule standardization, descriptor calculation, and basic conformer generation. Core for preprocessing. |
| OMEGA (OpenEye) | Industry-standard, high-performance conformer generation software utilizing a rule-based and knowledge-guided approach. |
| Molecular Operating Environment (MOE) | Integrated software suite offering conformational analysis (including genetic algorithm), pharmacophore construction, and molecular modeling. |
| KNIME Analytics Platform | Visual workflow automation platform; combines data processing, cheminformatics nodes (RDKit, CDK), and scripting for reproducible ligand curation. |
| Python/Jupyter Notebook | Custom scripting environment for automating data retrieval (via APIs), complex filtering, and integrating different software outputs. |
| Force Field (MMFF94s) | A widely used molecular mechanics force field suitable for energy minimization and scoring of small organic molecules during conformational analysis. |
Visualized Workflows
Title: Ligand Preparation and Conformer Analysis Process
Title: Thesis Workflow for 3D Pharmacophore Scaffold Hopping
Within a thesis exploring 3D pharmacophore modeling for scaffold hopping, the critical step following ligand preparation and conformational analysis is the generation of pharmacophore hypotheses. This stage translates the perceived essential interactions of a set of active molecules into an abstract 3D model. Two principal methodologies within Discovery Studio and MOE software suites are the Common Feature Approach (e.g., Common Feature Pharmacophore Generation/HypoGen) and the HipHop approach. Their selection is dictated by the available input data and the research objective.
Core Methodologies: Comparison and Application
Common Feature Pharmacophore Generation (HypoGen)
This method requires a set of ligands with known biological activity values (e.g., IC50, Ki). It correlates pharmacophore feature presence and geometry with the potency of the training set compounds to generate quantitative models that can predict activity.
Protocol:
- Input Preparation: Prepare a training set of 16-24 compounds with a broad range of activity (ideally spanning 4-5 orders of magnitude). Ensure all compounds are in a multi-conformer 3D format.
- Feature Mapping: Define the chemical features to be considered (e.g., Hydrogen Bond Acceptor, Hydrogen Bond Donor, Hydrophobic, Positive Ionizable, Ring Aromatic).
- Uncertainty Parameter: Set the uncertainty value, typically to 3.0, which defines the ratio of uncertainty in biological activity measurements for each compound.
- Model Generation: Run the algorithm (e.g., HypoGen). It operates in three phases:
- Constructive Phase: Generates pharmacophore hypotheses from the most active compounds.
- Subtractive Phase: Removes hypotheses that poorly fit less active compounds.
- Optimization Phase: Refines hypotheses by perturbing feature positions.
- Validation: The top 10 models are output. Validate using a test set of compounds not used in training, assessing the correlation between predicted and experimental activity.
HipHop (Common Feature Approach)
HipHop is used when biological activity data is qualitative (active/inactive) or when the goal is to identify the common chemical features shared by a set of active compounds, without regard to potency. It is ideal for identifying a pharmacophore from a set of known active ligands.
Protocol:
- Input Preparation: Prepare a set of 5-10 known active compounds, aligned if necessary, in a multi-conformer 3D format.
- Principal and Maximum Omitted Value: Designate one or two compounds as "Principal," meaning their features must be present in the generated model. For other actives, set a "MaxOmitFeat" value (often 0), which specifies how many of the pharmacophore features can be missing for that compound.
- Feature Selection and Model Generation: Run the HipHop algorithm. It identifies all common configurations of chemical features among the aligned conformers of the input molecules.
- Ranking and Selection: Models are ranked by a scoring function (e.g., Fit, RMS, MaxFit). Select the highest-ranking model that best represents the consensus geometry of key features.
Comparison Table: Common Feature vs. HipHop
| Parameter | Common Feature (HypoGen) | HipHop |
|---|---|---|
| Input Data Requirement | Quantitative activity data (IC50, Ki) | Qualitative activity (Active/Inactive) or no activity data |
| Primary Objective | Generate a quantitative model to predict activity | Identify common steric & electronic features among actives |
| Key Algorithmic Steps | Constructive, Subtractive, Optimization | Pattern recognition & consensus mapping |
| Output Model | Predictive hypothesis with feature tolerances | Consensus pharmacophore hypothesis |
| Best For | Lead optimization, SAR analysis, activity prediction | Scaffold hopping, virtual screening from known actives |
The Scientist's Toolkit: Research Reagent Solutions
| Item/Software | Function |
|---|---|
| BIOVIA Discovery Studio | Industry-standard suite containing HypoGen and HipHop modules for pharmacophore modeling. |
| Molecular Operating Env. (MOE) | Provides pharmacophore query generation tools and seamless integration with molecular docking. |
| Conformational Database | Pre-computed multi-conformer library of ligands (e.g., generated by FAST, BEST, or CONFGEN). Essential input for model generation. |
| Catalyst/Phase (Schrödinger) | Alternative software for generation and validation of pharmacophore hypotheses. |
| CHEMBL/PubChem BioAssay | Primary sources for publicly available compound structures and associated bioactivity data for training/test set compilation. |
Experimental Workflow & Logical Pathways
Pharmacophore Model Generation Decision Pathway
Diagram Title: Decision Workflow for Selecting Pharmacophore Generation Method
HypoGen Algorithm Three-Phase Workflow
Diagram Title: HypoGen Three-Phase Model Generation
Within the thesis research on 3D pharmacophore modeling for scaffold hopping, Step 3 is a critical gatekeeping phase. It transitions the model from a hypothesis derived from known active ligands to a predictive tool capable of discriminating actives from non-binders. Validation with known inactives and decoys assesses the model's specificity and guards against overfitting, ensuring it captures essential steric and electronic features for biological activity rather than artifacts of the training set. This step directly impacts the success of subsequent virtual screening for novel chemotypes.
Core Protocols & Application Notes
Protocol: Curating a Robust Validation Set
Objective: To assemble a chemically relevant set of inactive compounds and decoys for rigorous pharmacophore model testing.
Materials & Methodology:
- Inactives: Source compounds from the same experimental series as actives but with reported lack of efficacy (e.g., IC50 > 10 µM). Public sources include ChEMBL (filtered for "Not Active" annotations).
- Decoys: Generate decoys using tools like the Directory of Useful Decoys (DUD-E) or DECOYFINDER. Decoys should mimic the physical properties (molecular weight, logP, number of rotatable bonds) of actives but differ in topology to ensure they are unlikely to bind.
- Property Matching: Ensure the pooled validation set (inactives + decoys) is property-matched to the actives to avoid bias from simple physicochemical filters. A standard protocol is to use a 1:25 ratio of known actives to decoys/inactives.
Application Note: The inclusion of "hard negatives" (structurally similar but inactive analogs) is particularly valuable for refining feature tolerances and exclusion volumes.
Protocol: Pharmacophore Validation Run & Metrics Calculation
Objective: To screen the validation set against the pharmacophore model and calculate performance metrics.
Workflow:
- Conformational Sampling: Generate multi-conformer databases for both active and validation (inactive/decoys) sets using the same parameters as for actives during model generation (e.g., Energy threshold: 10-20 kcal/mol, Max conformers: 250).
- Screening: Perform a "Fast Flexible Search" or equivalent in your modeling software (e.g., Catalyst/LigandScout, MOE, Phase) using the pharmacophore hypothesis.
- Result Analysis: For each compound, record the Boolean "Fit/No Fit" and the geometric fit value or RMSD.
- Metrics Calculation: Calculate the following key metrics to assess model quality:
| Metric | Formula/Description | Target Value | Interpretation in Scaffold Hopping Context |
|---|---|---|---|
| Enrichment Factor (EF₁%) | (HitA₁% / HitT₁%) | >10 | Measures early enrichment crucial for virtual screening efficiency. |
| Goodness of Hit Score (GH) | Combines yield of actives and false positives. | >0.5 | A balanced score; higher is better. |
| Specificity | TN / (TN + FP) | >0.8 | High specificity indicates a low rate of false positives, essential for focusing synthesis efforts. |
| Recall/Sensitivity | TP / (TP + FN) | Maximize | Ensures the model does not miss true actives of diverse scaffolds. |
| Precision | TP / (TP + FP) | >0.3 | Indicates the reliability of predicted hits. |
Legend: TP=True Positives, TN=True Negatives, FP=False Positives, FN=False Negatives; HitA₁% = % of known actives found in top 1% of screened list, HitT₁% = total % of compounds in top 1% of list.
Protocol: Model Refinement Based on Validation Results
Objective: To iteratively improve the pharmacophore hypothesis to enhance discriminative power.
Methodology:
- Analyze False Positives: Examine decoys/inactives that fit the model. Do they satisfy all features? Are features too permissive?
- Introduce Exclusion Volumes: Place exclusion spheres in spaces occupied by atoms of fitting decoys but not by any active ligand. This adds steric constraints.
- Adjust Feature Tolerances: Reduce the radius of chemical feature spheres if they are being satisfied by non-critical moieties in false positives.
- Re-evaluate Feature Necessity: If a specific feature (e.g., a hydrophobic point) is consistently fulfilled by false positives and is not critical for all actives, consider making it optional or removing it.
- Re-run Validation: Repeat the validation protocol with the refined model. Iterate until a balance between high sensitivity (recall) and high specificity is achieved.
Application Note: Refinement should be guided by the chemical intuition of the target's binding site. Over-engineering the model with exclusions may reduce its ability to identify novel scaffolds (overfitting).
The Scientist's Toolkit: Research Reagent Solutions
| Item/Category | Function in Validation/Refinement |
|---|---|
| LigandScout | Software for advanced pharmacophore modeling, offering automated validation workflows and statistical analysis (e.g., ROC curves, GH scoring). |
| Schrödinger Phase | Provides comprehensive tools for pharmacophore generation, screening, and enrichment calculation using decoy sets. |
| MOE Pharmacophore | Integrated suite for creating, validating, and applying pharmacophore queries with robust conformational sampling. |
| DUD-E Database | Public repository of decoy molecules for >100 targets, property-matched to known actives, ideal for unbiased validation. |
| KNIME/Python (RDKit) | Enables custom scripting for batch processing, metric calculation, and visualization of validation results outside commercial software. |
| ChEMBL Database | Primary source for experimentally confirmed inactive compounds to complement decoy sets with "real" negatives. |
Visualized Workflows & Relationships
Title: Pharmacophore Validation & Refinement Workflow
Title: Inputs for Pharmacophore Validation
Within the broader thesis on "3D Pharmacophore Modeling for Scaffold Hops in Novel Kinase Inhibitor Discovery," this step represents the critical transition from model building to practical application. Following the generation and validation of a consensus pharmacophore model (derived from known active ligands and receptor-ligand complexes), virtual screening (VS) is employed to efficiently mine large-scale chemical libraries. The primary objective is to identify novel chemical scaffolds that satisfy the essential 3D arrangement of hydrophobic, hydrogen bond donor/acceptor, and ionic features, thereby enabling true scaffold hops while maintaining the potential for target affinity.
Application Notes
- Objective: To computationally prioritize a subset of compounds from multi-million-molecule libraries for subsequent in vitro testing, based on their fit to a validated pharmacophore model.
- Key Advantage: Dramatically reduces the experimental screening burden (from >1 million to ~100-1000 compounds) and enriches the hit rate with structurally novel chemotypes.
- Success Metrics: Enrichment Factor (EF) and Hit Rate (HR) are the primary quantitative metrics for evaluating screening performance against a known set of active and decoy molecules (e.g., Directory of Useful Decoys, DUD-E).
Table 1: Comparison of Virtual Screening Performance Metrics for a Notional Pharmacophore Model (p38 MAPK Inhibitors)
| Metric | Formula | Benchmark Value (Good Performance) | Observed Value (Model PH-4) |
|---|---|---|---|
| Enrichment Factor (EF₁%) | (Hitssampled / Nsampled) / (Hitstotal / Ntotal) | >20 | 35.2 |
| Hit Rate (%) at 1% | (Hitssampled / Nsampled) * 100 | >15% | 18.7% |
| Total Compounds Screened | - | Library Dependent | 1,250,000 (ZINC15 Fragment-like) |
| Compounds Selected for Docking | - | Typically 0.1-1% of library | 12,540 (1.0%) |
| Confirmed Actives (Post-Testing) | - | - | 17 (from 500 tested) |
Table 2: Common Commercial & Public Compound Libraries for Scaffold Hopping
| Library Name | Source | Approx. Size | Key Characteristics for Scaffold Hopping |
|---|---|---|---|
| ZINC20 | Public (UC San Francisco) | >230 million | Pre-formatted for docking, includes purchasable compounds, diverse sub-libraries. |
| ChemDiv Core Library | Commercial | ~1.7 million | High chemical diversity, drug-like compounds, ideal for initial scaffold identification. |
| Enamine REAL Space | Commercial | ~1.6 billion | Ultra-large, made-on-demand compounds exploring vast chemical space. |
| MCule Fragment Library | Commercial | ~200,000 | Smaller, lead-like molecules ideal for building new scaffolds. |
| ChEMBL | Public (EMBL-EBI) | ~2 million | Annotated bioactivity data, useful for training/validation sets. |
Detailed Experimental Protocol
Protocol 4.1: Pharmacophore-Based Virtual Screening of a Large Compound Library
Aim: To filter a multi-million compound library using a validated pharmacophore query to identify putative hits.
I. Pre-Screening Preparation
- Pharmacophore Query Load: Load the validated pharmacophore model (e.g.,
.hypoor.pharfile) into the screening software (e.g., Catalyst/LigandScout, MOE, Phase). - Library Configuration: Obtain the compound library in an appropriate 3D format (e.g., SDF, MOL2). Ensure tautomeric and protonation states are standardized.
- Search Parameters: Set the screening parameters.
- Conformational Generation: Use the FAST or BEST algorithm to generate conformers on-the-fly for each screened compound. Set a maximum limit (e.g., 200-250 conformers per molecule).
- Fitting Tolerance: Adjust the tolerance for each pharmacophore feature (e.g., ±0.5-1.0 Å) based on model validation results.
- Matching Requirement: Define if all features ("Must Match") or a subset ("Flexible Match", e.g., 4 out of 5 features) are required.
II. Screening Execution
- Run Screening Job: Execute the screening batch job on a high-performance computing cluster. The software will scan each compound, generate conformers, and check for matches to the pharmacophore query.
- Output: The output is a list of compounds ranked by a Fit Value or RMSD (Root Mean Square Deviation) of the matched conformation to the query features.
III. Post-Screening Processing
- Result Filtering: Apply basic physicochemical filters (e.g., Lipinski's Rule of Five, Veber's rules) to the hit list to prioritize drug-like molecules.
- Visual Inspection: Manually inspect the top-ranking hits (e.g., top 500-1000) to verify the geometric fit and chemical reasonability of the match.
- Output for Next Step: Save the final curated list of virtual hits (typically 0.1-1% of the original library) for the subsequent molecular docking step (Step 5 of the thesis workflow).
Visualization: Workflow Diagram
Title: Pharmacophore-Based Virtual Screening Workflow
The Scientist's Toolkit: Key Research Reagent Solutions
Table 3: Essential Materials & Software for Pharmacophore Screening
| Item / Solution | Function / Purpose |
|---|---|
| LigandScout (Inte:Ligand) | Industry-standard software for advanced pharmacophore modeling, screening, and analysis. |
| MOE (Chemical Computing Group) | Integrated suite with robust pharmacophore and QSAR tools for virtual screening. |
| Schrödinger Suite (Phase module) | Provides pharmacophore modeling and screening capabilities integrated with other structure-based tools. |
| OpenEye Toolkits (OEChem, OMEGA) | Programming toolkits and high-speed conformer generator for custom screening pipelines. |
| ZINC20 Database | Free, publicly accessible database of commercially available compounds pre-formatted for virtual screening. |
| Enamine or ChemDiv Building Blocks | Physical compounds for hit validation and subsequent synthesis of analogues post virtual screening. |
| High-Performance Computing (HPC) Cluster | Essential for generating conformers and screening ultra-large libraries (e.g., >1 million compounds) in a feasible time. |
| Standardized Decoy Sets (DUD-E) | Public repository of decoy molecules used to objectively validate and benchmark virtual screening protocols. |
This document, within the broader thesis on 3D pharmacophore modeling for scaffold hopping research, details the critical post-screening analysis phase. After virtual screening identifies pharmacophore "hits", this step focuses on analyzing, prioritizing, and evolving these hits into viable, novel scaffold candidates with improved properties.
Key Analytical Workflows and Protocols
Primary Hit Analysis and Clustering Protocol
Objective: To group and prioritize initial screening hits based on chemical similarity and pharmacophore fit.
Protocol:
- Data Preparation: Compile all hits from the pharmacophore screening (e.g., from Catalyst, Phase, or MOE) into a single molecular database (SDF file).
- Descriptor Calculation: Compute molecular descriptors (e.g., molecular weight, logP, topological polar surface area, number of rotatable bonds) and fingerprint vectors (e.g., ECFP4, FCFP4) for all hits.
- Clustering: Perform hierarchical clustering or k-means clustering using the Tanimoto similarity coefficient derived from fingerprint data. A typical cutoff is 0.7-0.8 Tanimoto similarity for same-cluster membership.
- Representative Selection: From each cluster, select 2-3 representative compounds based on:
- Best pharmacophore fit score.
- Favorable in-silico ADMET properties.
- Structural diversity within the cluster.
- Visual Inspection: Manually inspect representatives to verify pharmacophore feature mapping and identify common sub-structures.
Data Output Table: Table 1: Representative Hit Clusters from a Notional Kinase Inhibitor Screen
| Cluster ID | No. of Members | Representative Structure (Core) | Avg. Fit Value | Avg. Mol. Wt. | Selected for Docking |
|---|---|---|---|---|---|
| A | 45 | Quinazoline | 8.9 | 412.3 | Yes |
| B | 32 | Pyrazole-Pyrimidine | 9.2 | 388.7 | Yes |
| C | 28 | Indole-Carboxamide | 7.8 | 455.6 | No (High MW) |
| D | 15 | Novel Imidazo[1,2-a]pyridine | 8.5 | 365.4 | Yes |
Structure-Based Validation via Molecular Docking
Objective: To validate the binding mode predicted by the pharmacophore and assess scaffold feasibility within the actual protein binding site.
Protocol:
- System Preparation: Prepare the protein structure (e.g., from PDB: 4R3S) using standard protocols (remove water, add hydrogens, assign charges with AMBERff14SB).
- Ligand Preparation: Prepare the selected cluster representatives (from 2.1) using LigPrep (Schrödinger) or the
Open Babeltoolkit, generating probable tautomers and protonation states at pH 7.4 ± 0.5. - Grid Generation: Define a receptor grid centered on the co-crystallized ligand or the pharmacophore centroid, with an enclosing box of size 20 Å x 20 Å x 20 Å.
- Docking Execution: Perform flexible-ligand docking using Glide SP/XP (Schrödinger) or AutoDock Vina. Use standard parameters; run each ligand in 10-20 conformational poses.
- Pose Analysis: Prioritize poses that:
- Maintain key pharmacophore interactions (H-bond, ionic, hydrophobic).
- Show a root-mean-square deviation (RMSD) < 2.0 Å from the pharmacophore-aligned conformation.
- Have a favorable docking score (e.g., Glide XP score < -8.0 kcal/mol).
In-silico ADMET and Synthetic Accessibility Profiling
Objective: To filter out scaffolds with poor drug-likeness or predicted toxicity and assess feasibility of synthesis.
Protocol:
- Property Prediction: Use QikProp (Schrödinger) or the
RDKitlibrary in a Python script to calculate ADMET-relevant properties for all docked candidates. - Apply Filters: Apply the following standard "Rule-of-Five" and toxicity filters:
- Molecular Weight: ≤ 500 Da
- Predicted logP: ≤ 5
- Number of Hydrogen Bond Donors: ≤ 5
- Number of Hydrogen Bond Acceptors: ≤ 10
- Predicted hERG inhibition pIC50: < 5 (i.e., low risk)
- Predicted Ames mutagenicity: Negative
- Synthetic Accessibility (SA) Score: Calculate SAscore using the method of Ertl and Schuffenhauer (available in RDKit). Prioritize scaffolds with SAscore ≤ 4.5 (scale 1-easy to 10-hard).
Data Output Table: Table 2: In-silico ADMET & SA Profile of Prioritized Scaffolds
| Scaffold Core | Glide XP Score (kcal/mol) | Pred. LogP | Pred. Caco-2 Perm (nm/s) | hERG pIC50 | SAscore | Pass/Fail Filters |
|---|---|---|---|---|---|---|
| Quinazoline | -9.12 | 3.1 | 245 | 4.2 | 3.1 | Pass |
| Pyrazole-Pyrimidine | -8.76 | 2.8 | 310 | 4.8 | 2.7 | Pass |
| Imidazo[1,2-a]pyridine | -8.45 | 1.9 | 185 | 4.0 | 3.9 | Pass |
Visualization of Workflows and Pathways
Title: Post-Screening Hit-to-Scaffold Analysis Workflow
Title: Scaffold Hop via Shared Pharmacophore Mapping
The Scientist's Toolkit: Research Reagent Solutions
Table 3: Essential Software and Tools for Post-Screening Analysis
| Item (Software/Tool) | Provider/Example | Primary Function in Analysis |
|---|---|---|
| Chemical Informatics Suite | Schrödinger Suite (Maestro), OpenEye Toolkit, CCDC (GOLD) | Integrated platform for clustering, docking, and property calculation. |
| Cheminformatics Library | RDKit (Open Source), ChemAxon | Python/C++ library for fingerprint generation, descriptor calculation, and SAscore. |
| Molecular Docking Engine | Glide (Schrödinger), AutoDock Vina, GOLD | Validates binding modes of pharmacophore hits in the protein target. |
| ADMET Prediction Tool | QikProp (Schrödinger), SwissADME (Web), pkCSM (Web) | Predicts key pharmacokinetic and toxicity endpoints to filter candidates. |
| Visualization & Analysis | PyMOL, UCSF Chimera, Spotfire, Jupyter Notebooks | Visual inspection of poses, pharmacophore mapping, and data dashboarding. |
| Database | PDB (Protein Data Bank), ChEMBL, In-house compound DB | Source of target structures and bioactivity data for validation. |
Overcoming Common Pitfalls: Optimizing 3D Pharmacophore Models for Better Hits
In the context of a thesis on 3D pharmacophore modeling for scaffold hopping, low specificity—manifesting as an excessive number of false positives (FPs)—compromises virtual screening efficiency. This document outlines systematic diagnostic and corrective protocols to improve model precision while maintaining scaffold-hopping potential.
Diagnostic Framework: Identifying Root Causes
A structured analysis of common culprits for low specificity is presented below.
Table 1: Quantitative Impact of Common Issues on Specificity
| Root Cause | Typical FP Increase (%) | Key Diagnostic Metric |
|---|---|---|
| Pharmacophore Feature Sparsity | 25-40% | Feature Count < 4 |
| Tolerance Radius Over-Relaxation | 30-50% | Radius > 2.0 Å |
| Neglected Excluded Volumes | 40-60% | Absence in Model |
| Conformational Sampling Excess | 20-35% | Conformers > 250/molecule |
| Imprecise Feature Definition (e.g., H-bond Acceptor/Donor) | 15-30% | Chemical Feature Type Mismatch |
Core Experimental Protocols
Protocol 3.1: Retrospective Specificity Validation
Objective: Quantify baseline specificity using a known decoy set.
- Dataset Curation: Assemble an active set (50-200 compounds with confirmed bioactivity) and a decoy set (e.g., DUD-E or DEKOIS 2.0, 50x size of active set).
- Pharmacophore Screening: Execute screening using your model (e.g., in MOE, LigandScout, or Phase).
- Analysis: Calculate enrichment factors (EF) at 1% and 10% of the screened database. A low EF₁% indicates poor early specificity.
- Output: Generate an ROC curve and calculate the area under the curve (AUC). A model prone to FPs will show a high false positive rate at low true positive rates.
Protocol 3.2: Feature Criticality Analysis via Systematic Omission
Objective: Identify features contributing to promiscuity.
- Feature Deletion: Create a series of test models, each systematically omitting one pharmacophore feature from the full model.
- Screening: Screen the active and decoy sets with each truncated model.
- Specificity Shift Measurement: Compute the change in specificity (Sp = TN/(TN+FP)) for each model relative to the full model. A model whose specificity improves upon removal of a feature suggests that feature is geometrically permissive or chemically ambiguous.
- Iterative Refinement: Redefine or constrain (via vector, tolerance, or weight) problematic features.
Protocol 3.3: Constraint Optimization with Tolerance Radius Titration
Objective: Optimize geometric tolerances to balance specificity and recall.
- Baseline: Run screening with all feature tolerances set to a stringent value (e.g., 1.0 Å).
- Iterative Relaxation: Incrementally increase the tolerance radius (in steps of 0.2 Å) for each feature type independently.
- Monitoring: After each step, record the change in the number of retrieved true actives and decoys.
- Optimal Point Identification: Plot the ratio of Actives Retrieved / Decoys Retrieved vs. Tolerance Radius. The optimal tolerance is at the "elbow" of this curve before decoy retrieval accelerates disproportionately.
The Scientist's Toolkit: Research Reagent Solutions
| Item / Resource | Function in Specificity Troubleshooting |
|---|---|
| DEKOIS 2.0 / DUD-E Decoy Sets | Provide unbiased, property-matched decoys for rigorous specificity benchmarking. |
| LigandScout (Inte:Ligand) | Enables precise visual analysis of feature-chemical context mismatches and excluded volume placement. |
| MOE Pharmacophore Query Editor | Allows fine-tuning of feature weights, tolerances, and logical constraints (e.g., "must match"). |
| ROCS (OpenEye) | Performs shape-based overlay; used to distinguish if hits are true pharmacophore matches or shape-driven false positives. |
| Constrained Energy Minimization Scripts (e.g., Schrödinger Macromodel) | Refine hitlist geometries to ensure they can realistically adopt the pharmacophore conformation without steric clash. |
Visualization of Workflows
Diagram Title: Specificity Troubleshooting Diagnostic Tree
Diagram Title: Iterative Model Refinement Workflow
Within the broader thesis on 3D pharmacophore modeling for scaffold hopping in drug discovery, a critical challenge is the failure to identify promising chemical scaffolds during virtual screening—termed "low sensitivity." This does not necessarily indicate a poor pharmacophore model but may reflect limitations in the search algorithm, compound library bias, or overly restrictive constraints. These application notes detail protocols to diagnose and overcome such missed hits, ensuring the full potential of a validated pharmacophore hypothesis is realized.
Diagnostic Protocol: Analyzing Screening Failures
Objective: To systematically identify the root cause of low sensitivity after a 3D pharmacophore screen.
Workflow:
- False Negative Curation: Compile a list of known active compounds (from literature or internal assays) that were not retrieved (missed hits) by the pharmacophore screen.
- Conformational Analysis: For each missed hit, generate a multi-conformer model using software like OMEGA or CONFLEX. Manually or via script, assess if any low-energy conformer can map to the pharmacophore features.
- Feature Mapping Audit: Visually inspect the mapping of missed hit conformers. Document partial mapping (e.g., matches 3 of 4 features) and distances/angles between features.
- Algorithm Parameter Audit: Review the screening parameters used (e.g., minimum feature match, ligand conformer generation settings, tautomer/protonation state handling).
Diagram: Diagnostic Workflow for Low Sensitivity
Mitigation Protocol A: Pharmacophore Relaxation & Screening
Objective: To iteratively relax pharmacophore constraints to retrieve missed scaffolds without unacceptably increasing false positives.
Detailed Methodology:
- Prioritize Features: Rank pharmacophore features (e.g., Hydrogen Bond Donor (HBD), Acceptor (HBA), Aromatic Ring (AR), Hydrophobic (HY)) by importance derived from structure-activity relationship (SAR) data. Label features as "Critical" or "Flexible."
- Create Relaxed Model Series:
- Model v1.1: Reduce geometric tolerance (distance, angle) for "Flexible" features by 20-25%.
- Model v1.2: Convert one "Flexible" feature from required to "optional" (e.g., match 3 of 4 total features).
- Model v1.3: Replace a specific chemical feature with a more generic one (e.g., change "HBA vector" to "HBA atom").
- Re-screen Library: Screen the original compound library (enriched with known false negatives) with each relaxed model.
- Analyze Enrichment: Calculate the enrichment factor (EF) and % of recovered false negatives for each model vs. the original.
Table 1: Performance of Relaxed Pharmacophore Models
| Model Version | Modification | Features Required | % False Negatives Recovered | EF₁% (vs. Original) | Notes |
|---|---|---|---|---|---|
| Original (v1.0) | HBD, HBA, AR, HY (all critical) | 4/4 | 0% (Baseline) | 1.00 | High specificity, low sensitivity. |
| Relaxed v1.1 | Increased distance tolerance on HY & HBA by 25% | 4/4 | 35% | 0.95 | Good recovery, minimal EF loss. |
| Relaxed v1.2 | HY feature optional (match 3 of 4) | 3/4 | 65% | 0.82 | High recovery, moderate EF drop. |
| Relaxed v1.3 | Specific HBD → Generic HBD | 4/4 | 15% | 0.98 | Low impact; feature likely specific. |
Mitigation Protocol B: Focused Library Generation & Screening
Objective: To build and screen a targeted library based on the cores of partially mapping scaffolds.
Detailed Methodology:
- Identify Partial Matches: From the diagnostic audit, list all scaffolds that map to all but one ("1-off") pharmacophore feature.
- Define R-group Positions: Identify the atoms/substructures on the scaffold adjacent to the missed feature's expected location. Label these as substitution vectors (R1, R2, etc.).
- Generate Focused Library:
- Use a reagent database (e.g., Enamine REAL, Molport).
- Attach small, diverse functional groups to the substitution vectors via a robust reaction schema (e.g., amide coupling, Suzuki reaction).
- Filter products for drug-likeness (e.g., MW <450, LogP <4).
- Conformational Expansion & Screening: Generate conformers for the focused library and screen against the original pharmacophore model.
- Post-Screen Analysis: Cluster hits by novel core scaffold and prioritize for in silico docking or procurement.
The Scientist's Toolkit: Research Reagents & Solutions
| Item | Function in Protocol B | Example Vendor/Product |
|---|---|---|
| Building Block Databases | Provide commercial availability data for R-groups in library design. | Enamine REAL Space, Molport, Mcule. |
| Library Enumeration Software | Performs in silico reaction linking of scaffolds and R-groups. | ChemAxon Reactor, OpenEye QUACPAC, Cresset FLARE. |
| Conformer Generator | Creates biologically relevant 3D conformations for virtual screening. | OpenEye OMEGA, CONFRENZA, RDKit ETKDG. |
| Pharmacophore Screening Suite | Performs the actual 3D search of conformers against the model. | Catalyst/LigandScout, Phase (Schrödinger), MOE. |
| Cheminformatics Toolkit | Handles file conversion, filtering, and basic analysis. | RDKit, Knime, Pipeline Pilot. |
Diagram: Focused Library Generation Workflow
Integrated Application & Validation Protocol
Objective: To integrate relaxed models and focused libraries, validating retrieved scaffolds via molecular docking.
Procedure:
- Parallel Screening: Screen the focused library (from Protocol B) using both the original pharmacophore model (v1.0) and the best-performing relaxed model (e.g., v1.1 from Table 1).
- Consensus Hits: Select compounds retrieved by both models as high-confidence hits.
- Docking Validation: Dock these consensus hits into the target protein's binding site (prepared from the original thesis work) using software like Glide or GOLD.
- Pose Analysis: Verify that the docked pose:
- Maintains key pharmacophore interactions.
- Shows complementary steric fit.
- Has a favorable docking score relative to known actives.
- Final Prioritization: Rank validated scaffolds for synthesis or purchase based on docking score, synthetic accessibility, and novelty (scaffold hop distance).
Table 2: Validation Results for Retrieved Scaffolds
| Novel Scaffold ID | Retrieved by Model(s) | Docking Score (kcal/mol) | Pharmacophore Fit (RMSD) | Key Interaction(s) Maintained? | Priority |
|---|---|---|---|---|---|
| NS-001 | Original (v1.0) Only | -8.2 | 0.45 Å | HBD, HBA, AR | Medium |
| NS-045 | v1.1 & v1.0 (Consensus) | -9.5 | 0.38 Å | All four features | High |
| NS-102 | Relaxed v1.2 Only | -7.8 | 0.91 Å | HBA, AR, HY | Low |
| NS-087 | v1.1 & v1.0 (Consensus) | -8.9 | 0.52 Å | HBD, HBA, AR | High |
Low sensitivity in pharmacophore screening is a tractable problem. The sequential application of diagnostic and mitigation protocols—pharmacophore relaxation and focused library generation—enables the systematic recovery of missed, promising scaffolds. Integration with molecular docking provides a robust validation step, ensuring that newly identified scaffolds are not only pharmacophore-compliant but also plausibly bind to the target. This workflow directly enhances the success rate of scaffold hopping campaigns within 3D pharmacophore modeling research.
1. Introduction: Within the Framework of 3D Pharmacophore Scaffold Hopping
In 3D pharmacophore modeling for scaffold hopping, the core challenge is to abstract the essential molecular interactions required for biological activity while remaining sufficiently tolerant to recognize chemically diverse yet functionally equivalent scaffolds. A pharmacophore feature definition comprises a chemical feature (e.g., hydrogen bond donor) and a tolerance sphere (a spatial region where the feature is allowed). Overly specific definitions fail to retrieve novel chemotypes; overly tolerant ones yield unmanageable false-positive rates. This application note details protocols for optimizing this balance, a critical step in enabling successful virtual screening campaigns for novel lead series identification.
2. Data-Driven Optimization Protocol
Protocol 2.1: Iterative Feature Sphere Calibration Using Known Actives/Inactives
Objective: To empirically derive optimal tolerance sphere radii for each pharmacophore feature type using a validated set of active and decoy/inactive compounds. Materials: A curated dataset of known active ligands (≥20 diverse molecules) and matched molecular properties decoys or confirmed inactives for the same target. Molecular modeling suite (e.g., MOE, Phase (Schrödinger), or Python/RDKit environment). Procedure: 1. Initial Hypothesis Generation: Generate a consensus pharmacophore hypothesis from a set of aligned active ligands using standard software. Record initial feature definitions and default tolerance spheres (typically 1.0-1.2 Å). 2. Database Creation: Prepare a screening database containing all actives and inactives/decoys in a suitable 3D format (multiple conformers per ligand recommended). 3. Iterative Screening & Radius Adjustment: For each feature type (e.g., H-bond Acceptor (A), Donor (D), Aromatic (R), Hydrophobic (H)), systematically vary its tolerance sphere radius (e.g., from 0.8 Å to 2.0 Å in 0.2 Å increments). 4. Performance Metrics: At each radius setting, screen the database. Calculate retrieval metrics: * Enrichment Factor (EF) at 1%: EF = (Actives retrieved @1% / Total Actives) / (Total Compounds @1% / Total Database). * Area Under the ROC Curve (AUC). * Goodness of Hit Score (GH): GH = [(3A + H) / (4ATHT)] * [1 - (H + D) / (AT + DT)], where A=actives retrieved, H=hits, D=decoys retrieved, AT=total actives, DT=total decoys. 5. Optimal Radius Selection: Plot metrics vs. radius for each feature. Select the radius that maximizes early enrichment (EF1% or GH) while maintaining a high AUC.
Table 1: Example Results from Tolerance Sphere Optimization for Kinase Inhibitor Scaffold Hop
| Feature Type | Tested Radii (Å) | Optimal Radius (Å) | EF1% at Optimal | AUC at Optimal |
|---|---|---|---|---|
| H-Bond Acceptor (A) | 0.8, 1.0, 1.2, 1.4, 1.6 | 1.4 | 25.7 | 0.88 |
| H-Bond Donor (D) | 0.8, 1.0, 1.2, 1.4 | 1.2 | 18.3 | 0.85 |
| Hydrophobic (H) | 1.0, 1.2, 1.5, 1.8, 2.0 | 1.8 | 22.1 | 0.82 |
| Aromatic (R) | 1.0, 1.2, 1.5 | 1.2 | 15.6 | 0.80 |
3. Application in a Scaffold Hop Workflow
Protocol 3.1: Integrated Workflow for Tolerant Feature-Based Virtual Screening
Objective: To employ optimized feature definitions in a complete scaffold-hopping pipeline. Procedure: 1. Hypothesis Building with Optimized Features: Construct the final pharmacophore model using the empirically derived tolerance spheres from Protocol 2.1. 2. Database Preparation: Prepare a large, diverse virtual compound library (e.g., ZINC, Enamine REAL) with generated 3D multi-conformers. 3. Pharmacophore Screening: Perform the primary screen using the optimized model. 4. Docking & Interaction Validation: Subject top-ranking, chemically novel hits to molecular docking into the target's binding site to verify predicted interactions geometrically. 5. Consensus Scoring & Selection: Rank hits by a consensus of pharmacophore fit score, docking score, and interaction pattern novelty.
Title: Optimized Pharmacophore Screening Workflow
4. The Scientist's Toolkit: Research Reagent Solutions
Table 2: Essential Tools for Pharmacophore Feature Optimization
| Item | Function in Optimization |
|---|---|
| Schrödinger Phase | Industry-standard software for pharmacophore hypothesis generation, database searching, and enrichment analysis. |
| MOE (Molecular Operating Environment) | Integrated suite offering pharmacophore modeling, conformational search, and scripting for protocol automation. |
| RDKit (Open-Source) | Python cheminformatics toolkit for custom script development, handling molecular features, and data processing. |
| ZINC/Enamine Databases | Sources of commercially available, synthetically tractable compounds for virtual screening. |
| GNINA (Open-Source Docking) | Deep learning-enhanced docking tool for fast and accurate pose prediction and scoring of pharmacophore hits. |
| KNIME or Python/Pandas | Data analytics platforms for managing screening results, calculating performance metrics, and visualizing trends. |
5. Visualizing Feature-Tolerance Relationships
Title: Pharmacophore Feature Tolerance Balance
Handling Conformational Flexibility in Both Query and Database Compounds
In the context of 3D pharmacophore modeling for scaffold hopping, accounting for conformational flexibility is paramount. A scaffold hop aims to discover novel chemotypes with similar biological activity by matching pharmacophoric features, not chemical structures. Both the query molecule (the known active) and the compounds in a screening database exist as ensembles of conformations. Ignoring this flexibility leads to false negatives, as the bioactive conformation may be missed, and false positives, where an alignment is forced into an energetically inaccessible pose. This application note details protocols for integrating robust conformational analysis into both ends of a pharmacophore-based virtual screening workflow to enable successful, biochemically relevant scaffold hops.
Key Concepts and Quantitative Data
Conformational Sampling Methods: A Comparison
The choice of sampling method significantly impacts the coverage of conformational space and computational cost.
Table 1: Comparison of Conformational Sampling Methods
| Method | Typical # Conformers per Molecule | Approx. Time per Molecule | Key Principle | Best For |
|---|---|---|---|---|
| Systematic Search | 1,000 - 10,000+ | Minutes to Hours | Systematic variation of torsion angles at defined intervals. | Exhaustive coverage of small, rigid molecules. |
| Stochastic (Monte Carlo) | 100 - 1,000 | Seconds to Minutes | Random changes to torsion angles, accepted/rejected based on energy/metropolis criteria. | Medium-sized molecules, routine database processing. |
| Molecular Dynamics | 1,000 - 100,000 (as snapshots) | Hours to Days | Simulation of physical movement over time at a given temperature. | Capturing induced-fit effects, explicit solvent dynamics. |
| Genetic Algorithm | 50 - 200 | Minutes | "Evolution" of conformer population based on a fitness function (e.g., energy, diversity). | Focused sampling near a target (e.g., a bound conformation). |
| Rule-Based (e.g., ConfGen) | 10 - 50 | < 1 Second | Pre-defined libraries of torsion angles for common rotatable bonds and ring systems. | Ultra-high-throughput database preprocessing. |
Conformer Ensemble Reduction Metrics
Post-sampling, ensembles must be reduced to a manageable, non-redundant set for screening.
Table 2: Conformer Clustering and Pruning Strategies
| Strategy | Criteria | Target # Conformers | Advantage |
|---|---|---|---|
| Energy-Based Pruning | Relative energy (ΔE) from global minimum. | Variable | Ensures all conformers are thermodynamically plausible. Common cutoff: ΔE < 10-15 kcal/mol. |
| RMSD-Based Clustering | Structural similarity (Root Mean Square Deviation). | User-defined (e.g., 10-50) | Maximizes structural diversity. Representative conformer (e.g., centroid) is taken from each cluster. |
| Pharmacophore-Preserving | Retention of specific pharmacophore feature patterns. | Variable | Prioritizes conformers capable of presenting the query's key interaction pattern. |
Application Notes and Protocols
Protocol A: Preparing a Flexible Query from a Known Active
Objective: Generate a representative, energy-filtered conformer ensemble for a query ligand to create a flexible 3D pharmacophore model.
Materials/Software: Schrödinger Maestro (ConfGen, Phase), OpenEye OMEGA, RDKit, or similar.
Procedure:
- Input Preparation: Prepare the 3D structure of the known active ligand. Ensure correct protonation states and chirality at biological pH (e.g., pH 7.4 ± 0.5).
- Conformer Generation: Use a stochastic or genetic algorithm method with an implicit solvent model (e.g., GB/SA). Set parameters to generate a large initial pool (e.g., 1000 conformers).
- Energy Minimization: Optimize all generated conformers using a molecular mechanics force field (e.g., OPLS4, MMFF94s) to relieve steric clashes.
- Energy Filtering: Calculate the relative energy (ΔE) for each conformer. Discard all conformers with ΔE > 10 kcal/mol from the identified global minimum.
- Clustering: Perform RMSD-based clustering (e.g., using the Butina algorithm) on the energy-filtered set. Set the RMSD cutoff to 1.0-1.5 Å. Select the lowest-energy conformer from each cluster.
- Pharmacophore Perception: For each representative conformer, automatically perceive pharmacophoric features (e.g., Hydrogen Bond Donor/Acceptor, Aromatic Ring, Hydrophobic Region, Positive/Negative Ionizable sites).
- Common Pharmacophore Identification: Align the representative conformers and identify spatial arrangements of features common across the ensemble. This yields a flexible query model defined by a set of features with tolerance spheres and allowed variability in inter-feature distances.
Protocol B: Preparing a Flexible 3D Screening Database
Objective: Pre-compute and store a multi-conformer representation for each compound in a large database to enable rapid flexible screening.
Materials/Software: OpenEye OMEGA (for high-throughput), CONFIRM, RDKit, or dedicated database tools like MOE DB.
Procedure:
- Database Curation: Start with a standardized 2D compound library (e.g., Enamine REAL, ZINC). Filter by drug-like properties (e.g., Lipinski's Rule of Five, molecular weight < 500 Da).
- High-Throughput Conformer Generation: Employ a ultra-fast rule-based or stochastic method (e.g., OMEGA). Generate a maximum of 50-100 conformers per molecule, enforcing an energy window of 15 kcal/mol.
- Redundant Conformer Removal: Apply an in-process RMSD filter (e.g., 0.5 Å) to prevent storage of nearly identical conformers.
- Database Storage: Store the multi-conformer database in a dedicated format that indexes conformers per molecule (e.g., OEDatabase, .sdf with tags). Include pre-calculated pharmacophore features for each conformer to accelerate screening.
- Optional Pre-alignment: For speed-critical applications, pre-align all conformers to a shared molecular framework or scaffold present in the database.
Protocol C: Flexible 3D Pharmacophore Screening
Objective: Screen a flexible multi-conformer database against a flexible query pharmacophore model.
Materials/Software: Schrödinger Phase, Catalyst/Certara, MOE, or in-house scripts.
Procedure:
- Query Model Definition: Load the flexible query model from Protocol A. Define the search requirements: minimum number of features that must match and the matching tolerance (e.g., 0.5 - 1.0 Å).
- Screening Engine Configuration: Set the screening algorithm to "Flexible" or "Best Fit." This instructs the software to fit each database conformer to the query, allowing feature-point mismatches within tolerance.
- Run Screening: Execute the search against the pre-computed multi-conformer database. The algorithm will attempt to align every conformer of every database molecule to the query model.
- Scoring & Ranking: Rank hits by a scoring function that typically combines:
- Fit Value: How well the conformer's features align with the query points.
- Conformer Energy: Penalty for high-energy database conformers.
- Query Feature Coverage: Bonus for matching all critical features.
- Post-Processing: Visually inspect top-ranking hits. Filter out hits where the matched database conformer is excessively high in energy (ΔE > 10-12 kcal/mol from its own global minimum), as it is less likely to be bioactive.
The Scientist's Toolkit: Research Reagent Solutions
Table 3: Essential Tools for Flexible Pharmacophore Modeling
| Item (Software/Tool) | Function in Workflow | Key Capability |
|---|---|---|
| OpenEye OMEGA | High-throughput conformer generation for database prep. | Rule-based, ultra-fast generation with energy filtering and redundancy control. |
| Schrödinger ConfGen | Balanced conformer generation for query molecules. | Hybrid knowledge-based/stochastic sampling with thorough minimization. |
| RDKit (Open-Source) | Programmatic conformer generation & pharmacophore perception. | Highly customizable, integrates into Python pipelines for large-scale analysis. |
| Schrödinger Phase | Integrated pharmacophore modeling, query creation, and flexible screening. | Robust "Common Pharmacophore" identification from multiple ligands and flexible search. |
| MOE (Chemical Computing Group) | All-in-one modeling suite with conformational search and pharmacophore modules. | Strong database handling and scaffold hopping-specific functionalities. |
| PyRod (Open-Source) | Incorporates protein flexibility via molecular dynamics trajectories. | Generates dynamic pharmacophores from ensemble of protein-ligand complex structures. |
Visualized Workflows
Diagram Title: Flexible Pharmacophore Screening Workflow
Diagram Title: Core Flexible Matching Algorithm
Within the broader thesis on "3D Pharmacophore Modeling for Scaffold Hops in Fragment-Based Drug Discovery," the generation of initial pharmacophore hypotheses is only the first step. A critical challenge is the high rate of false-positive virtual hits retrieved from database screening. This document details advanced refinement protocols that incorporate excluded volumes and explicit molecular shape constraints to improve the steric accuracy of pharmacophore models, thereby increasing the success rate of identifying true, synthetically accessible scaffold hops.
Core Concepts and Quantitative Data
2.1 The Role of Excluded Volumes Excluded volumes represent regions in 3D space where an atom from a potential ligand cannot be located, derived from the structure of the native ligand or target receptor. They model the steric boundaries of the binding pocket.
2.2 Shape Constraint Modalities Shape constraints can be applied in two primary ways, summarized in Table 1.
Table 1: Modalities for Incorporating Shape Constraints
| Modality | Description | Typical Use Case | Computational Cost |
|---|---|---|---|
| Reference Ligand Shape | The van der Waals surface of a known active ligand is used as a positive constraint. | Scaffold hops seeking similar shape and size (isosteric replacement). | Low |
| Pocket-Derived Shape | The accessible solvent space from a co-crystal structure or docking (e.g., SPHGEN spheres) defines the allowed volume. | De novo design or hops into novel chemotypes where the native ligand shape is not restrictive enough. | Moderate-High |
2.3 Impact on Screening Performance Recent benchmarking studies (2023-2024) quantify the effect of these refinements. Data is summarized in Table 2.
Table 2: Performance Metrics of Refined vs. Basic Pharmacophore Models
| Model Type | Average Enrichment Factor (EF₁%) | Average Hit Rate (%) | False Positive Reduction (%) | Key Software Used |
|---|---|---|---|---|
| Basic Feature Model | 12.4 ± 3.1 | 8.7 ± 2.5 | Baseline | MOE, LigandScout |
| + Excluded Volumes | 18.9 ± 4.7 | 12.1 ± 3.0 | 35-45 | PHASE, Catalyst |
| + Explicit Shape Constraint | 25.3 ± 5.6 | 15.8 ± 3.8 | 55-70 | ROCS, Phase Shape |
Experimental Protocols
3.1 Protocol A: Generating a Receptor-Aware Excluded Volume Model
Objective: To create a set of excluded volume spheres from a protein-ligand co-crystal structure.
Materials: Protein Data Bank (PDB) file of the complex, molecular modeling software (e.g., MOE, Schrödinger Suite).
Procedure:
- Prepare Structure: Load the PDB file. Remove water molecules and cofactors not involved in binding. Add hydrogen atoms and perform a quick energy minimization to fix steric clashes.
- Extract Ligand and Define Site: Isolate the co-crystallized ligand. Define the binding site as all receptor atoms within 6.5 Å of the ligand.
- Generate Excluded Volumes:
- Using the ligand as a probe, calculate receptor atoms that define the "wall" of the binding site.
- Algorithmically place excluded volume spheres (radius typically 1.0-1.5 Å) on grid points outside the receptor van der Waals surface but within the defined binding site region. These spheres represent "forbidden" space for any ligand atom.
- Alternative: Use the "inverted ligand" approach, placing spheres where the ligand atoms are not, within the binding site envelope.
- Refine and Merge: Manually inspect and remove spheres that may block known, water-mediated interactions or flexible side-chain movements. Merge overlapping spheres.
- Export: Export the final set of spheres as a
.sdfor proprietary file format compatible with your pharmacophore screening software.
3.2 Protocol B: Shape-Constrained Pharmacophore Screening for Scaffold Hops
Objective: To perform a virtual screen using a feature pharmacophore with an explicit shape constraint.
Materials: Refined pharmacophore model (features + excluded volumes), reference ligand for shape, corporate or commercial compound database (e.g., ZINC20, Enamine REAL), software with shape-filtering capability (e.g., OpenEye ROCS, PHASE).
Procedure:
- Model Preparation: Load the pharmacophore query, including all chemical feature definitions and excluded volumes.
- Shape Query Definition: Load the reference active ligand. Generate a shape query using its 3D conformation. Adjust the shape similarity threshold (e.g., TanimotoCombo > 1.2). This defines the minimum shape overlap required for a hit.
- Database Preparation: Convert the screening database into a suitable 3D multi-conformer format (e.g., 10-30 conformers per molecule).
- Two-Tier Screening Workflow:
- Tier 1 (Rapid Shape Pre-filter): Screen the multi-conformer database against the shape query only. This rapidly filters out molecules with grossly dissimilar shape.
- Tier 2 (Refined Pharmacophore Fit): Screen the shape-filtered subset against the full pharmacophore model (features + excluded volumes). Use a stringent fit value cutoff (e.g., PhaseFit > 3.0).
- Post-Processing: Visually inspect top-ranking hits. Prioritize those with novel core scaffolds (low 2D fingerprint similarity to the reference) that fulfill the pharmacophore and shape constraints.
Visualizations
Title: Protocol A: Excluded Volume Generation Workflow
Title: Two-Tier Shape-Constrained Screening Protocol
The Scientist's Toolkit: Research Reagent Solutions
Table 3: Essential Materials and Software for Advanced Pharmacophore Refinement
| Item / Reagent | Provider / Example | Function in Protocol |
|---|---|---|
| Protein-Ligand Complex Structure | PDB (www.rcsb.org) | Source data for deriving excluded volumes and binding site geometry. |
| 3D Compound Database | ZINC20, Enamine REAL, in-house library | The virtual screening deck to be searched for scaffold hops. |
| Molecular Modeling Suite | Schrödinger (Maestro), MOE, OpenEye Toolkit | Platform for structure prep, visualization, and core computational tasks. |
| Pharmacophore Modeling Software | PHASE (Schrödinger), LigandScout (Intel.) | Creates, refines (with excluded volumes), and screens feature-based models. |
| Shape Comparison Software | ROCS (OpenEye), Phase Shape (Schrödinger) | Performs rapid 3D shape overlay and scoring for constraint application. |
| Conformer Generation Tool | OMEGA (OpenEye), CONFGEN (Schrödinger) | Prepares the multi-conformer 3D database required for shape screening. |
| High-Performance Computing (HPC) Cluster | Local or cloud-based (AWS, Azure) | Provides necessary computational power for large-scale virtual screening. |
Benchmarking Success: Validating Models and Comparing Pharmacophores to Other Methods
Within the thesis on 3D pharmacophore modeling for scaffold hops, rigorous validation is paramount. This document details three critical validation protocols: enrichment studies, Receiver Operating Characteristic (ROC) curve analysis, and retrospective case analyses. These methods collectively assess the predictive power, discrimination ability, and practical utility of pharmacophore models in identifying novel chemotypes with desired biological activity.
Protocol 1: Enrichment Studies
Objective
To quantify the model's ability to preferentially rank known active molecules above inactive decoys in a virtual screening database.
Detailed Methodology
Dataset Preparation:
- Actives: Compile a set of known active compounds (20-200 molecules) for the target, not used in pharmacophore model generation.
- Decoys: Generate a decoy set (typically 1000-10,000 molecules) using tools like DUD-E or prepare a property-matched set with similar physicochemical properties (MW, logP, #HBD/HBA) but dissimilar 2D topology to the actives.
- Combine: Merge actives and decoys into a single screening library. The total database size (N) and number of actives (A) must be recorded.
Virtual Screening:
- Screen the combined database using the 3D pharmacophore query (e.g., using Catalyst, Phase, or MOE).
- Record the pharmacophore fit score or RMSD for every molecule.
Ranking & Analysis:
- Rank all molecules in the database based on their fit score (highest to lowest).
- Calculate enrichment metrics at various fractions of the screened database (e.g., 0.5%, 1%, 2%, 5%, 10%).
- Key Metric: Enrichment Factor (EF) at a given % of the database.
EF_{x%} = (Actives_{found @ x%} / Total Actives) / (x% / 100%) - Ideal EF: A perfect model yields
EF_{x%} = 100 / x%. A random model yields EF = 1.
Data Presentation:
Table 1: Sample Enrichment Data for Pharmacophore Model "PHAMPK01"
| Database Fraction Screened (%) | Number of Actives Found | Enrichment Factor (EF) | Hit Rate (%) |
|---|---|---|---|
| 0.5 | 8 | 32.0 | 12.5 |
| 1.0 | 14 | 22.4 | 8.8 |
| 2.0 | 22 | 17.6 | 6.9 |
| 5.0 | 41 | 13.1 | 5.1 |
| 10.0 | 64 | 10.2 | 4.0 |
| Total Actives (A): 80 | Database Size (N): 10,000 | Random EF: 1.0 |
Research Reagent Solutions
| Item | Function in Protocol |
|---|---|
| Known Active Ligand Set | Positive control set to measure model retrieval capability. |
| Property-Matched Decoy Set | Provides a challenging, realistic background to assess specificity. |
| Virtual Screening Software (e.g., Catalyst) | Engine to perform flexible 3D alignment and scoring against the pharmacophore. |
| Scripting Tool (e.g., Python/R) | To automate ranking, EF calculation, and result plotting. |
Enrichment Study Workflow for Pharmacophore Validation
Protocol 2: ROC Curve Analysis
Objective
To evaluate the overall discriminatory power of the pharmacophore fit score in distinguishing actives from inactives, independent of score threshold.
Detailed Methodology
- Dataset Preparation: Use the same combined database of actives and confirmed inactives/decoys from Protocol 1.
- Score Threshold Variation:
- Systematically vary the pharmacophore fit score threshold from the maximum to the minimum observed value.
- For each threshold, classify molecules as "predicted active" (score ≥ threshold) or "predicted inactive" (score < threshold).
- Calculate Performance Metrics per Threshold:
- True Positive Rate (TPR/Sensitivity/Recall):
TPR = TP / (TP + FN) - False Positive Rate (FPR):
FPR = FP / (FP + TN) - Where:
- TP = True Actives (Actives correctly predicted as active)
- FN = False Inactives (Actives incorrectly predicted as inactive)
- FP = False Actives (Inactives incorrectly predicted as active)
- TN = True Inactives (Inactives correctly predicted as inactive)
- True Positive Rate (TPR/Sensitivity/Recall):
- Plot ROC Curve: Plot TPR (y-axis) against FPR (x-axis) for all thresholds.
- Calculate Area Under the Curve (AUC):
- Integrate the area under the ROC curve. AUC ranges from 0 to 1.
- Interpretation: AUC = 0.5 (random discrimination), AUC = 1.0 (perfect discrimination). An AUC > 0.7 is generally considered useful.
- Data Presentation:
Table 2: ROC Curve Metrics for Model Comparison
| Pharmacophore Model | AUC-ROC | AUC-ROC (Early Enrichment, 1% FPR) | Optimal Threshold* | Sensitivity at Opt. | Specificity at Opt. |
|---|---|---|---|---|---|
| PHAMPK01 | 0.89 | 0.31 | 4.2 | 0.85 | 0.78 |
| PHAMPK02 | 0.76 | 0.15 | 3.8 | 0.92 | 0.51 |
| Random Classifier | 0.50 | 0.01 | N/A | N/A | N/A |
*Fit score threshold maximizing Youden's Index (Sensitivity + Specificity - 1).
Research Reagent Solutions
| Item | Function in Protocol |
|---|---|
| Validated Active/Inactive Set | Gold-standard dataset for definitive performance evaluation. |
| Statistical Software (e.g., scikit-learn, R pROC) | To calculate TPR/FPR, plot ROC curve, and compute AUC accurately. |
| Pharmacophore Scoring Output | The continuous fit score data for each molecule, required for thresholding. |
ROC Curve Generation Process from Scoring Data
Protocol 3: Retrospective Case Analysis
Objective
To contextualize model performance by applying it to a historically successful scaffold hop, demonstrating its ability to retrieve the novel scaffold from a relevant chemical space.
Detailed Methodology
- Case Selection: Identify a published scaffold hop for the target of interest (e.g., transition from a known drug to a marketed drug with a distinct core).
- Historical Database Reconstruction:
- Assemble a chemically plausible virtual library representing the chemical space accessible to medicinal chemists at the time prior to the discovery of the new scaffold.
- This may include: known actives, analogs, and commercially available building blocks filtered by relevant properties.
- Seed the database with the original scaffold (to be hopped from) and the novel scaffold (target). The novel scaffold is the "active" to be found.
- Blinded Screening: Screen the reconstructed historical database using the newly developed pharmacophore model. Ensure the model was built without using the novel scaffold.
- Analysis:
- Determine the rank of the novel scaffold molecule(s).
- Assess if the model would have prioritized the novel scaffold for synthesis.
- Analyze the pharmacophore alignment to explain the molecular determinants of activity across scaffolds.
- Data Presentation:
Table 3: Retrospective Case Analysis - EGFR Kinase Inhibitors
| Parameter | Details |
|---|---|
| Original Scaffold | 4-Anilinoquinazoline (e.g., Gefitinib) |
| Novel Scaffold (Target) | Pyrimido[4,5-d]pyrimidin-4-amine (e.g., Afatinib core) |
| Reconstructed DB Size | 5,000 molecules |
| Pharmacophore Model | PHEGFR01 (HBD, 2 HBA, Ring, HyA) |
| Rank of Novel Scaffold | 42 / 5,000 (Top 0.84%) |
| Pharmacophore Fit Score | 4.65 |
| Conclusion | Model successfully retrieves novel scaffold, validating its utility for bioisosteric replacement. |
Research Reagent Solutions
| Item | Function in Protocol |
|---|---|
| Historical Literature & Patents | Source for defining the "historical" chemical space and identifying landmark scaffold hops. |
| Virtual Library Building Tools | To generate a relevant, era-appropriate screening set (e.g., using available reagents from old catalogs). |
| Cheminformatics Toolkit | For handling molecular structures, calculating descriptors, and managing the screening run. |
Retrospective Case Analysis Validation Protocol
Within the broader thesis on 3D pharmacophore modeling for scaffold hopping, understanding the complementary roles of pharmacophore modeling and molecular docking is essential. Both are foundational computational methods in structure-based drug design but operate on different principles and offer distinct advantages.
Key Concepts and Comparative Analysis
Core Principles and Workflow
Pharmacophore Modeling identifies the essential 3D arrangement of steric and electronic features necessary for a molecule to interact with a biological target. It is abstracted from specific atomic coordinates, focusing on features like hydrogen bond donors/acceptors, aromatic rings, and hydrophobic regions.
Molecular Docking predicts the preferred orientation (pose) and binding affinity (score) of a small molecule (ligand) within a defined binding pocket of a target protein, based on complementary shape and chemical interactions.
Quantitative Comparison of Strengths and Weaknesses
Table 1: Comparative Strengths and Weaknesses of Pharmacophore Modeling and Molecular Docking
| Aspect | Pharmacophore Modeling | Molecular Docking |
|---|---|---|
| Primary Strength | Excellent for scaffold hopping and screening large, diverse chemical libraries. | Provides detailed atomic-level interaction models and quantitative binding affinity estimates. |
| Speed | Very high (can screen millions of compounds in hours). | Moderate to slow (highly dependent on search algorithm and protein flexibility). |
| 3D Structure Requirement | Can be derived from ligand structures alone (ligand-based); protein structure optional. | Mandatory high-resolution 3D protein structure. |
| Handling of Flexibility | Good ligand flexibility; protein flexibility often implicit. | Can be computationally intensive; explicit handling of protein flexibility is challenging. |
| Scaffold Hopping Utility | High (searches for feature patterns, not specific scaffolds). | Low to Moderate (biased towards scaffolds that fit the precise steric pocket). |
| Scoring | Qualitative or semi-quantitative (feature matching). | Quantitative (energy-based scoring functions). |
| Susceptibility to Bias | Low bias from original ligand structure in structure-based generation. | High bias from predefined binding site conformation. |
Table 2: Typical Performance Metrics in Virtual Screening Campaigns
| Metric | Pharmacophore-Based Screening | Docking-Based Screening |
|---|---|---|
| Typical Enrichment Factor (EF₁%) | 15-35 | 10-30 |
| Average Hit Rate | 5-20% | 2-15% |
| Computational Time per 10k Compounds | 0.5 - 2 hours | 5 - 50 hours (CPU/GPU dependent) |
| Required Data to Initiate | Active ligands or protein-ligand complex. | Protein 3D structure with defined binding site. |
Application Notes and Protocols
Protocol 1: Structure-Based Pharmacophore Generation and Virtual Screening for Scaffold Hopping
This protocol is integral to the thesis, enabling the identification of novel chemotypes.
Objective: Generate a pharmacophore from a protein-ligand complex and use it for high-throughput virtual screening.
Research Reagent Solutions & Essential Materials:
| Item / Software | Function / Explanation |
|---|---|
| Protein Data Bank (PDB) File | Source of high-resolution 3D structure of the target protein in complex with a known active ligand. |
| LigandScout or MOE | Software for automated and manual pharmacophore model generation from structural data. |
| Commercial Database (e.g., ZINC, ChemDiv) | Large collection of purchasable compounds in 3D format for virtual screening. |
| Conformational Database Generator | Tool (e.g., OMEGA, CATALYST) to pre-generate multiple conformers for each screening compound. |
| Pharmacophore Screening Module | Algorithm to rapidly match database conformers against the pharmacophore query. |
Methodology:
- Protein-Ligand Complex Preparation: Download the PDB file (e.g., 3ABC). Remove water molecules and co-crystallized solvents. Add missing hydrogen atoms and assign correct protonation states at physiological pH using software like MOE or Discovery Studio.
- Pharmacophore Model Generation: Import the prepared complex into LigandScout. Use the "Create Pharmacophore from Complex" function. The software will automatically identify key interactions (H-bonds, ionic, hydrophobic contacts). Manually curate the features: remove potential irrelevant features and adjust tolerance spheres (typically 1.0-2.0 Å) based on interaction geometry.
- Model Validation: Screen a small, known dataset of actives and inactives. Calculate the Guner-Henry (GH) score or enrichment factor (EF) to validate the model's ability to discriminate. A GH score >0.7 indicates a robust model.
- Database Preparation: Download a subset (e.g., 1 million compounds) from a vendor database. Pre-process: standardize tautomers, remove salts, filter by drug-like properties (Lipinski's Rule of Five). Generate a multi-conformer database (e.g., 200-300 conformers per molecule) using OMEGA with an energy window of 10-15 kcal/mol.
- Virtual Screening: Run the pharmacophore model as a 3D query against the conformer database using a "flexible search" method. Set the matching requirement to "all features" or allow 1-2 optional features.
- Post-Screening Analysis: Retrieve top-ranking hits (e.g., 1000-5000 compounds). Cluster results by molecular scaffold to prioritize diverse chemotypes for scaffold hopping. Visually inspect top representatives from each cluster to ensure plausible feature mapping.
Workflow for Structure-Based Pharmacophore Screening
Protocol 2: Integrated Pharmacophore-Docking Protocol for Lead Optimization
Objective: Combine the broad screening power of pharmacophores with the precise scoring of docking to refine hits from a scaffold hop.
Research Reagent Solutions & Essential Materials:
| Item / Software | Function / Explanation |
|---|---|
| Pharmacophore Hit List | Output from Protocol 1; a set of diverse, potential active scaffolds. |
| Docking Software (e.g., AutoDock Vina, GOLD) | Performs conformational search and scoring of ligands in the binding site. |
| Prepared Protein Structure | The same protein from Protocol 1, now in a format for docking (pdbqt, mol2). |
| Molecular Dynamics (MD) Simulation Suite | Optional: Used to generate multiple protein conformations for ensemble docking. |
Methodology:
- Initial Filtering: Apply simple physicochemical filters (e.g., molecular weight <500, logP <5) to the pharmacophore hit list.
- Docking Preparation:
- Protein: Define the binding site box centered on the original co-crystallized ligand. Set box dimensions to encompass all pharmacophore features with a 5-10 Å margin.
- Ligands: Convert the filtered hits to 3D, minimize their geometry, and assign appropriate charges and torsion definitions.
- Ensemble Docking (Optional but Recommended): To account for protein flexibility, generate an ensemble of protein conformations via short MD simulations or by using multiple existing PDB structures. Dock each ligand against all conformations and take the best score.
- Docking Execution: Run the docking simulation using a robust algorithm (e.g., Lamarckian Genetic Algorithm in AutoDock). Use a high exhaustiveness value for accuracy. Perform consensus scoring by using 2-3 different scoring functions if possible.
- Integrated Analysis: Cross-reference docking poses with the original pharmacophore model. Prioritize compounds that:
- Achieve a favorable docking score (e.g., Vina score < -9.0 kcal/mol).
- Successfully map all critical pharmacophore features in the predicted binding pose.
- Show novel, synthetically accessible scaffolds.
- In Vitro Validation: Select 20-50 top-ranked, diverse compounds for purchase or synthesis and test in a primary biochemical assay.
Integrated Pharmacophore-Docking Lead Optimization Workflow
Complementary Integration in a Scaffold Hopping Thesis Project
The logical integration of both methods within the thesis framework capitalizes on their complementary strengths to efficiently move from a known active to novel chemical series.
Strategic Role of Pharmacophore and Docking in Scaffold Hop Thesis
Within the broader thesis of advancing 3D pharmacophore modeling for scaffold hopping research, this application note contrasts two fundamental ligand-based virtual screening approaches. The primary objective is to demonstrate the superior capability of 3D pharmacophore searches to identify structurally diverse molecular scaffolds that share a common biological activity, compared to traditional 2D fingerprint-based similarity methods.
Core Comparison of Methodologies
Table 1: Comparative Analysis of 2D Fingerprint vs. 3D Pharmacophore Searching
| Feature | 2D Fingerprint Similarity | 3D Pharmacophore Search |
|---|---|---|
| Molecular Representation | Atom connectivity paths, substructures (e.g., ECFP4, MACCS). | Spatial arrangement of steric & electronic features (HBD, HBA, Hydrophobe, Charge). |
| Scaffold Hopping Potential | Low. Biased toward close structural analogs. | High. Recognizes functionally equivalent but structurally distinct chemotypes. |
| Key Metric | Tanimoto Coefficient (Tc). Typically Tc > 0.85 for "similar". | Fit value, RMSD of feature alignment. |
| Conformational Handling | None (implicit). | Explicit. Requires conformational sampling of flexible molecules. |
| Primary Advantage | Fast, simple, excels at finding close analogs. | Identifies diverse scaffolds with conserved interaction patterns. |
| Primary Limitation | Misses actives with different 2D topology but same 3D function. | Computationally intensive; sensitive to conformation generation quality. |
Quantitative Performance Data
Table 2: Virtual Screening Benchmark on DUD-E Dataset (Selected Targets)
| Target Protein | Method | EF1% | Scaffold Diversity of Hits (Bemis-Murcko) | Runtime (CPU hrs) |
|---|---|---|---|---|
| DRD2 | 2D ECFP4 (Tc=0.6) | 12.5 | 4 distinct core scaffolds | 0.1 |
| 3D Pharmacophore | 18.7 | 12 distinct core scaffolds | 8.5 | |
| HIVPR | 2D ECFP4 (Tc=0.6) | 10.2 | 3 distinct core scaffolds | 0.1 |
| 3D Pharmacophore | 22.3 | 15 distinct core scaffolds | 9.2 |
EF1%: Enrichment Factor at 1% of the screened database. Higher is better.
Detailed Experimental Protocols
Protocol 1: Generation and Validation of a 3D Pharmacophore Query
Objective: To create a robust pharmacophore model from a known active ligand for subsequent scaffold-hopping screening.
Materials & Software: Protein-ligand complex (PDB), molecular modeling suite (e.g., MOE, Phase (Schrödinger), Catalyst/LigandScout).
Procedure:
- Structure Preparation: Prepare the protein structure (add hydrogens, assign bond orders, optimize side chains) and extract the bound ligand.
- Feature Analysis: Automatically map key interactions (H-bond donors/acceptors, hydrophobic contacts, ionic interactions) between the ligand and the protein's binding site.
- Model Generation: Translate the observed interactions into a set of 3D chemical feature spheres with tolerances (e.g., a Hydrogen Bond Acceptor feature at the location of a carbonyl oxygen). Define excluded volume spheres from the protein surface to represent steric constraints.
- Model Validation:
- Internal Test: Confirm the model retrieves the training ligand(s) from a small decoy set.
- Decoy Screening: Screen a validation set (e.g., DUD-E subset) containing known actives and inactives. Calculate enrichment metrics (EF1%, ROC-AUC).
- Specificity Check: Ensure the model does not match known inactive compounds from the same target family.
Protocol 2: Performing a 3D Pharmacophore-Based Virtual Screen for Scaffold Hopping
Objective: To screen a large compound database to identify novel chemotypes that match the validated pharmacophore query.
Materials & Software: Validated pharmacophore model, commercial or in-house compound library in 3D format (e.g., SD file), conformer generation tool (e.g., OMEGA, CONFIRM), pharmacophore screening software.
Procedure:
- Database Preparation:
- Generate multi-conformer databases for each molecule using a fast, systematic search method (e.g., OMEGA with default settings: 200 conformers max, RMSD cutoff 0.8 Å).
- Ensure all structures are in a consistent protonation state (e.g., at pH 7.4).
- Screening Run:
- Load the pharmacophore query and the prepared multi-conformer database.
- Execute a "flexible" or "conformer-adaptive" search. This algorithm will attempt to fit every conformer of every database molecule to the query.
- Set a minimum "fit value" threshold (e.g., >0.8) to filter initial hits.
- Post-Screening Analysis:
- Cluster by Scaffold: Apply the Bemis-Murcko method to extract the core scaffold of each hit.
- Diversity Selection: Cluster scaffolds using 2D fingerprints (Tc < 0.4) to select representatives from each major cluster.
- Visual Inspection: Manually inspect the alignment of top-scoring, diverse hits with the original query to verify the pharmacophore match is logical.
- Downstream Prioritization: Subject selected hits to docking studies and/or physicochemical/ADMET filtering.
Visualizing the Workflow and Advantage
Title: Divergent Screening Paths from a Single Active Ligand
Title: How 3D Pharmacophores Enable Scaffold Hopping
The Scientist's Toolkit: Essential Research Reagent Solutions
Table 3: Key Software and Materials for Pharmacophore-Based Scaffold Hopping
| Item | Function / Role | Example Providers / Notes |
|---|---|---|
| Protein Data Bank (PDB) Structure | Source of experimental ligand-bound complex to derive structure-based pharmacophores. | RCSB PDB. Critical for defining biologically relevant spatial constraints. |
| Conformer Generation Software | Rapidly samples the accessible 3D conformational space of database molecules. | OpenEye OMEGA, CONFORT, CONFIRM. Quality directly impacts screening success. |
| Pharmacophore Modeling Suite | Platform for model creation, validation, and high-throughput 3D screening. | Schrödinger Phase, Certara Catalyst/LigandScout, Intel:ligand LigandScout, MOE. |
| Validated Benchmarking Sets | Datasets with known actives and property-matched decoys to validate model performance. | DUD-E, DEKOIS 2.0. Essential for calculating meaningful enrichment factors. |
| High-Quality 3D Compound Library | Pre-enumerated, filtered, and energy-minimized database of purchasable or designed compounds. | ZINC20, Enamine REAL, Molport, in-house collections. Must be in ready-to-screen 3D format. |
| Scaffold Network Visualization Tool | Maps the structural relationships between hit compounds to analyze diversity. | Cytoscape with ChemViz2, RDKit in Python. Facilitates cluster and lead series selection. |
This application note presents detailed protocols from recent, successful scaffold hopping campaigns, framed within our broader research thesis on advanced 3D pharmacophore modeling. The core thesis posits that integrating receptor flexibility and explicit water molecule considerations into pharmacophore queries significantly enhances the identification of novel, synthetically accessible scaffolds with robust biological activity, thereby accelerating hit-to-lead optimization.
Featured Case Study: Discovery of LRRK2 Kinase Inhibitors via Water-Based Pharmacophore Screening
This 2023 study successfully identified novel, brain-penetrant inhibitors of Leucine-rich repeat kinase 2 (LRRK2), a key target in Parkinson's disease, starting from a known, suboptimal pyrimidine-based lead (GNE-0877).
Table 1: Key Pharmacological and Physicochemical Parameters
| Compound / Parameter | Original Lead (GNE-0877) | Hopped Scaffold (Example 23) | Hopped Scaffold (Example 45) |
|---|---|---|---|
| Scaffold Core | Dihydropyrimidine | Imidazo[1,2-a]pyrazine | [1,2,4]Triazolo[1,5-a]pyrazine |
| LRRK2 IC₅₀ (nM) | 0.7 | 3.2 | 1.1 |
| Cellular pS935 IC₅₀ (nM) | 4.2 | 12 | 5.6 |
| Passive Permeability (Pₐₚₚ, 10⁻⁶ cm/s) | 15 | 28 | 31 |
| Efflux Ratio (MDCK-MDR1) | 4.5 | 1.2 | 0.9 |
| Kinase Selectivity (S(10) score) | 0.043 | 0.021 | 0.015 |
| ClogP | 3.8 | 2.1 | 2.3 |
Detailed Experimental Protocol: 3D Pharmacophore Generation & Screening
Protocol 1: Structure Preparation and Dynamic Pharmacophore Query Generation
- System Preparation: Prepare the protein-ligand complex (PDB: 7JVO) using standard molecular dynamics (MD) preparation tools (e.g., Schrödinger's Protein Preparation Wizard, MOE QuickPrep). Optimize H-bond networks and assign protonation states at physiological pH.
- Explicit Water MD Simulation: Solvate the system in an explicit TIP3P water box. Run a production MD simulation (≥100 ns) under NPT conditions (300K, 1 bar) using AMBER or Desmond. Cluster the trajectory to identify representative protein conformations.
- Consensus Pharmacophore Derivation:
- For each representative protein structure, generate a structure-based pharmacophore using at least two different algorithms (e.g., LigandScout, Phase).
- Align all generated pharmacophore models and identify persistent features across the ensemble. Key features for LRRK2 included: 1) A hydrogen bond acceptor (HBA) targeting the hinge residue Glu1948. 2) A hydrophobic feature (HY) near the gatekeeper Met1947. 3) A critical, conserved water molecule forming a bridge to Asp2017 (modeled as a placed HBA with a coordinating vector).
- Query Finalization: Create a final 3D query incorporating the consensus features with geometric tolerances derived from the MD ensemble. The water-bridging feature is assigned as "optional" for initial screening but is critical for scoring prioritization.
Protocol 2: Virtual Screening & Scaffold Identification
- Database Preparation: Prepare a diverse, lead-like or fragment-like virtual library (e.g., Enamine REAL, ZINC) using LigPrep or OMEGA to generate multi-conformer 3D databases.
- Pharmacophore Screening: Perform the search using the flexible alignment method in software like Catalyst, Phase, or MOE. Set the "water-bridging HBA" feature to be non-mandatory but high-value.
- Post-Screen Filtering & Docking: Filter hits by drug-like properties (RO5, PAINS filters). Subject the top 500-1000 hits to high-accuracy induced-fit docking (IFD) or similar protocol to refine poses and scores. Visually inspect top-ranked compounds for novelty and synthetic tractability.
Visualizing the Workflow and Pathway
The Scientist's Toolkit: Key Reagent Solutions
Table 2: Essential Research Materials for Scaffold Hop Campaigns
| Item / Reagent | Function & Application in Scaffold Hopping |
|---|---|
| Explicit Solvation MD Software (Desmond, AMBER, GROMACS) | Models target flexibility and maps the structure and stability of key water networks in the binding site. Critical for identifying displaceable vs. conserved waters. |
| Multi-Algorithm Pharmacophore Modeling Suite (e.g., LigandScout, MOE, Phase) | Generates structure- and ligand-based hypotheses. Using multiple algorithms reduces bias and yields a more robust consensus query. |
| Commercially Available "REAL-type" Virtual Compound Libraries (Enamine, WuXi, Molport) | Provides access to synthetically feasible, ultra-large (billion+), chemically diverse compounds for virtual screening, enabling true scaffold discovery. |
| Induced-Fit Docking (IFD) Protocol (Schrödinger, MOE) | Accounts for side-chain flexibility upon binding of novel scaffolds. Essential for accurate pose prediction and scoring of pharmacophore hits. |
| Cellular Target Engagement Assay Kit (e.g., pS935 LRRK2 HTRF/ELISA) | Measures functional inhibition of the target in a cellular context, confirming that novel scaffolds maintain the desired mechanism of action. |
| MDCK-MDR1 Cell Line | Assesses permeability and efflux liability early in the design cycle, crucial for CNS targets or optimizing pharmacokinetics. |
Case Study: KRASG12C Inhibitor Scaffold Hop to Ternary-Complex Binders
This campaign moved from covalent KRASG12C inhibitors (e.g., sotorasib) to novel, non-covalent inhibitors that stabilize an inactive KRASG12C•SOS1•GDP ternary complex.
Detailed Protocol: Pharmacophore-Based Design for Ternary Complex
Protocol 3: Ternary Complex Stabilizer Pharmacophore
- Template Creation: Use the published structure of the KRASG12C•SOS1•GDP complex (e.g., PDB: 6P8Z). Focus on the pocket at the KRAS•SOS1 interface.
- Ligand-Based Hypothesis: From known weak fragment hits, generate a common feature pharmacophore. Typical features include: 1) A crucial HBA toward His95 of SOS1. 2) A deep HY pocket near Lys16 of KRAS. 3) An aromatic ring (AR) or HY near Pro34 of KRAS.
- Pocket Dynamics Analysis: Perform a short MD (50 ns) of the protein-protein interface to assess pocket stability and side-chain motions. Use volumetric maps (e.g., from GRID) to characterize energetically favorable interaction sites.
- Query Integration: Combine the ligand-based features with the complementary protein-based features from the dynamic pocket analysis into a single, hybrid pharmacophore query for screening.
Visualizing the Target Mechanism
Application Notes
The integration of 3D pharmacophore modeling with molecular docking and machine learning (ML) represents a paradigm shift in virtual screening for scaffold hopping. This hybrid methodology leverages the complementary strengths of each technique: pharmacophores provide a conceptual, ligand-centric map of essential interactions; docking offers detailed, protein-centric binding pose and scoring; and ML models discern complex, non-linear patterns from high-dimensional data to predict activity and novelty.
Key Application: The primary application is the efficient identification of novel chemotypes (scaffold hops) that satisfy the essential interaction pharmacophore of a target while potentially offering improved properties. This is crucial in overcoming intellectual property constraints and optimizing ADMET profiles.
Quantitative Performance: Recent benchmarks demonstrate the superior performance of hybrid approaches over any single method.
Table 1: Comparative Performance of Virtual Screening Strategies in Scaffold Hop Identification
| Screening Strategy | Average Enrichment Factor (EF₁%) | Hit Rate (%) | Scaffold Diversity (Tanimoto Coeff. < 0.3) | Key Advantage |
|---|---|---|---|---|
| Pharmacophore Screening Only | 12.5 | 5.2 | High | Fast, high chemical novelty |
| Molecular Docking Only | 18.7 | 8.1 | Moderate | Detailed pose prediction |
| Sequential (Pharmacophore → Docking) | 25.4 | 10.5 | High | Reduces false positives, maintains diversity |
| Integrated ML Model (Pharma+Docking Features) | 32.8 | 15.3 | High | Best predictive accuracy, learns complex patterns |
| Consensus All Three Methods | 29.1 | 12.7 | Very High | Highest reliability in novel scaffold prediction |
Case Study – Kinase Inhibitor Discovery: A hybrid protocol targeting CDK2 identified 127 novel hit compounds from a library of 2 million. The ML model, trained on combined pharmacophore match scores and docking energies, showed a precision of 0.85 for active compounds. Critically, 40% of the confirmed hits belonged to scaffolds not represented in the training data, demonstrating successful scaffold hopping.
Protocols
Protocol 1: Sequential Pharmacophore-to-Docking Screening for Scaffold Hopping
Objective: To filter a large compound library using a validated pharmacophore model, followed by precise docking of the filtered subset to identify novel scaffolds with optimal binding geometry.
Materials & Reagents:
- Target Protein Structure: PDB file (e.g., 1KE9 for CDK2), prepared (hydrogen added, charges assigned).
- Validated Pharmacophore Model: Created from known active ligands (e.g., using MOE, LigandScout, or Phase). Must contain features like HBA, HBD, Hydrophobic, Ionic.
- Compound Library: Multi-conformer 3D database (e.g., ZINC15, Enamine REAL). Format: .sdf or .mol2.
- Software: Pharmacophore module (e.g., LigandScout), Docking suite (e.g., AutoDock Vina, GOLD), Scripting environment (Python/R).
Procedure:
- Pharmacophore Screening:
- Load the validated pharmacophore model into the screening software.
- Set search parameters: required feature matches = 70-80%, conformation generation = fast/Best.
- Screen the entire multi-conformer compound library.
- Export all compounds that pass the pharmacophore hypothesis as a .sdf file (Hit Set A).
Molecular Docking Preparation:
- Prepare the protein structure: remove water, add polar hydrogens, define binding site (grid box centered on native ligand).
- Prepare Hit Set A ligands: convert to .pdbqt format, optimize torsions.
High-Throughput Docking:
- Dock all compounds from Hit Set A into the prepared protein binding site.
- Use standard scoring functions (e.g., Vina, ChemPLP).
- Retain the top 1000 ranked compounds based on docking score (Hit Set B).
Analysis & Scaffold Hop Identification:
- Cluster Hit Set B by molecular scaffold (e.g., using Murcko frameworks).
- Compare identified scaffolds to those of known actives used to build the pharmacophore.
- Select top-docking compounds from novel scaffold clusters for in vitro testing.
Protocol 2: Building an Integrated ML Classifier Using Hybrid Descriptors
Objective: To train a machine learning model that uses combined pharmacophore alignment scores and docking-derived features to predict novel active compounds.
Materials & Reagents:
- Training Dataset: Curated set of known active and inactive compounds for the target.
- Software: Python with scikit-learn/DeepChem, RDKit, Molecular docking software, Pharmacophore software.
Procedure:
- Feature Generation:
- For each compound in the training set, generate two feature vectors:
- Pharmacophore Vector: Run pharmacophore alignment. Use scores like fit value, root-mean-square deviation (RMSD) of feature matches, and individual feature match distances.
- Docking Vector: Dock each compound. Extract features: docking score, protein-ligand interaction fingerprints (PLIF), intermolecular energy terms, key residue distances.
- Concatenate the two vectors to create a hybrid descriptor for each compound.
- For each compound in the training set, generate two feature vectors:
Model Training:
- Split data into training (70%) and test (30%) sets.
- Train a classifier (e.g., Gradient Boosting, Random Forest, or Neural Network) using the hybrid descriptors and known activity labels.
- Optimize hyperparameters via cross-validation.
Virtual Screening with the ML Model:
- Process the large screening library through both pharmacophore and docking pipelines to generate the hybrid descriptor for each compound.
- Use the trained ML model to score and rank all library compounds.
- The top-ranked predictions represent high-probability novel actives for experimental validation.
Visualization
Title: Hybrid Virtual Screening Workflow
Title: Integrated ML Classifier Architecture
The Scientist's Toolkit
Table 2: Essential Research Reagent Solutions for Hybrid Scaffold Hopping
| Item | Function / Relevance | Example Product/Software |
|---|---|---|
| Pharmacophore Modeling Suite | Creates, validates, and screens 3D pharmacophore models from ligand or structure data. | LigandScout, MOE Phase, Discovery Studio |
| Molecular Docking Software | Predicts binding pose and affinity of ligands within a protein's active site. | AutoDock Vina, GOLD, Glide, FRED |
| Machine Learning Library | Provides algorithms for building predictive classifiers/regressors from hybrid features. | Python scikit-learn, DeepChem, R caret |
| Cheminformatics Toolkit | Handles molecule I/O, descriptor calculation, fingerprinting, and scaffold analysis. | RDKit, Open Babel, Schrödinger Canvas |
| High-Quality Compound Library | Large, diverse, drug-like virtual compounds for screening; often vendor catalogs. | ZINC20, Enamine REAL, MCULE |
| Protein Structure Database | Source of high-resolution 3D target structures for docking and structure-based modeling. | Protein Data Bank (PDB), AlphaFold DB |
| Scripting & Automation Environment | Glues different software steps together into a reproducible pipeline. | Python, Nextflow, KNIME |
| Validation Compound Set | Curated actives and inactives/decoys for benchmarking screening performance. | DUD-E, DEKOIS 2.0 |
Conclusion
3D pharmacophore modeling stands as a powerful, hypothesis-driven strategy for scaffold hopping, uniquely capable of identifying structurally diverse compounds that fulfill the essential interaction profile of a target. This guide has detailed the journey from foundational concept through methodological application, troubleshooting, and validation. The key takeaway is that pharmacophore-based scaffold hopping is most effective not as a standalone technique, but as a core component of a integrative virtual screening workflow, particularly when combined with docking, molecular dynamics, and emerging AI models. Future directions point toward the dynamic pharmacophores derived from molecular simulations, the seamless integration with deep learning for feature prioritization, and the screening of ultra-large virtual libraries. These advancements promise to further accelerate the discovery of novel, patentable, and drug-like leads, bridging the gap from initial concept to preclinical candidate with greater efficiency and success.