Orthogonal Validation of LC-HRMS with NMR: A Strategic Framework for Enhanced Confidence in Metabolomics and Pharmaceutical Analysis
This article provides a comprehensive guide for researchers and drug development professionals on the strategic integration of Liquid Chromatography-High-Resolution Mass Spectrometry (LC-HRMS) and Nuclear Magnetic Resonance (NMR) spectroscopy.
Orthogonal Validation of LC-HRMS with NMR: A Strategic Framework for Enhanced Confidence in Metabolomics and Pharmaceutical Analysis
Abstract
This article provides a comprehensive guide for researchers and drug development professionals on the strategic integration of Liquid Chromatography-High-Resolution Mass Spectrometry (LC-HRMS) and Nuclear Magnetic Resonance (NMR) spectroscopy. It explores the foundational principles of this orthogonal validation approach, detailing practical methodologies and data fusion techniques for applications ranging from drug impurity characterization to foodomics and clinical metabolomics. The content addresses common troubleshooting scenarios and optimization strategies for seamless instrument coupling, and finally establishes a robust framework for the comparative analysis and validation of findings, underscoring how this synergy delivers superior structural elucidation, accurate quantification, and increased confidence in metabolite identification.
The Power of Two: Unveiling the Synergistic Principles of LC-HRMS and NMR
In modern analytical chemistry, particularly within drug development and complex mixture analysis, the convergence of Liquid Chromatography-High-Resolution Mass Spectrometry (LC-HRMS) and Nuclear Magnetic Resonance (NMR) spectroscopy represents a powerful orthogonal validation strategy. While each technique operates on fundamentally different physical principles, their combined application provides a comprehensive analytical framework that compensates for their individual limitations. LC-HRMS excels in sensitivity and specificity for targeted compound analysis, whereas NMR offers unparalleled structural elucidation capabilities and absolute quantification without requiring identical standards. This comparative guide objectively examines the performance characteristics of both platforms, providing researchers with a scientific foundation for selecting appropriate methodologies based on their specific analytical requirements. The integration of findings from these complementary techniques significantly enhances the credibility of analytical data in regulatory submissions, metabolomics studies, and complex product characterization, forming a robust backbone for modern analytical workflows in pharmaceutical and biotechnology industries.
Technical Principles and Instrumentation
LC-HRMS Fundamentals
Liquid Chromatography-High-Resolution Mass Spectrometry combines the physical separation capabilities of liquid chromatography with the precise mass measurement of high-resolution mass analyzers. In typical operation, samples are introduced via liquid chromatography where compounds are separated based on their chemical interactions with the stationary and mobile phases. The eluent then enters the mass spectrometer interface, where ionization sources such as Electrospray Ionization (ESI) or Atmospheric Pressure Chemical Ionization (APCI) convert analytes into gas-phase ions. These ions are subsequently separated in high-resolution mass analyzers including Time-of-Flight (ToF), Orbitrap, or Fourier Transform Ion Cyclotron Resonance (FTICR) instruments, which provide mass measurements with accuracy typically better than 5 ppm [1]. This high mass accuracy enables confident elemental composition assignment and facilitates the identification of unknown compounds in complex matrices. Tandem mass spectrometry (MS/MS) capabilities further enhance structural elucidation by producing diagnostic fragment ions through collision-induced dissociation (CID) or advanced fragmentation techniques like electron-activated dissociation (EAD), which provides complementary fragmentation pathways for challenging compounds such as steroids [2].
NMR Spectroscopy Fundamentals
Nuclear Magnetic Resonance spectroscopy exploits the magnetic properties of certain atomic nuclei, most commonly protons (¹H) and carbon-13 (¹³C), which when placed in a strong static magnetic field absorb and re-emit electromagnetic radiation at characteristic frequencies. These resonance frequencies are exquisitely sensitive to the local chemical environment, providing detailed information about molecular structure, conformation, and dynamics. Modern NMR spectrometers utilize superconducting magnets producing field strengths ranging from 400 MHz to 1 GHz and higher, with increased field strength directly improving both spectral resolution and sensitivity [3] [4]. NMR experiments range from simple one-dimensional (1D) ¹H or ¹³C spectra to complex two-dimensional (2D) experiments such as COSY (Correlation Spectroscopy), TOCSY (Total Correlation Spectroscopy), HSQC (Heteronuclear Single Quantum Coherence), and HMBC (Heteronuclear Multiple Bond Correlation) that establish connectivity between nuclei through chemical bonds and through space [5]. The technique is inherently quantitative, as NMR signal intensity is directly proportional to the number of nuclei generating the signal, enabling absolute quantification without compound-specific calibration curves.
Comparative Performance Analysis
Sensitivity and Limits of Detection
Table 1: Sensitivity Comparison Between LC-HRMS and NMR Techniques
| Technique | Typical LOD | Matrix Effects | Key Sensitivity Factors |
|---|---|---|---|
| LC-HRMS (Triple Quadrupole) | 0.1-0.2 ng/mL (in urine) [6] | Significant ion suppression/enhancement | Ionization efficiency, matrix interference, mass analyzer type |
| LC-HRMS (High-Resolution) | 0.9-1.2 ng/mL (in urine) [6] | Moderate to significant | Mass resolving power, scan speed, ionization source |
| NMR (Conventional) | μM to mM range [3] | Minimal | Magnetic field strength, probe design, isotope nature |
| NMR (Hyperpolarized d-DNP) | >10,000x sensitivity enhancement [3] | Minimal | Polarization method, nucleus, T₁ relaxation |
The sensitivity disparity between LC-HRMS and NMR represents the most significant performance differentiator. LC-HRMS, particularly when operated in targeted multiple reaction monitoring (MRM) mode on triple quadrupole instruments, achieves exceptional sensitivity with limits of detection (LOD) in the sub-nanogram per milliliter range for many analytes in biological matrices [6]. This exquisite sensitivity enables the detection and quantification of low-abundance metabolites, pharmaceutical compounds, and biomarkers in complex samples. High-resolution MS systems, while slightly less sensitive than triple quadrupole instruments for targeted analysis, provide the advantage of untargeted screening capabilities with typical LODs around 1 ng/mL [6].
In stark contrast, conventional NMR spectroscopy operates with sensitivity limitations that typically restrict detection to compounds in the micromolar to millimolar concentration range [3]. This fundamental sensitivity challenge stems from the small energy differences between nuclear spin states, resulting in low population differences and consequently weak signals. However, recent technological advances have begun to address this limitation through hyperpolarization techniques, particularly dissolution dynamic nuclear polarization (d-DNP), which can enhance NMR signals by several orders of magnitude—with some studies reporting sensitivity increases greater than 10,000-fold [3]. This dramatic improvement potentially bridges the sensitivity gap between NMR and MS, enabling the detection and quantification of minute metabolite concentrations in biological samples at natural abundance.
Structural Elucidation Capabilities
Table 2: Structural Elucidation Capabilities of NMR and LC-HRMS
| Aspect | NMR | LC-HRMS |
|---|---|---|
| Molecular Formula | Indirectly via ¹³C NMR, ¹H-¹³C correlation | Direct from accurate mass (< 5 ppm) [1] |
| Connectivity | Through-bond (COSY, TOCSY, HSQC, HMBC) [5] | Indirect via fragmentation patterns (MS/MS) |
| Stereochemistry | Excellent (NOESY, ROESY, J-couplings) | Limited |
| Unknown Identification | De novo structure elucidation [7] | Requires libraries or computational approaches |
| Isobar Discrimination | Excellent | Limited without separation or MS/MS |
| Through-space Interactions | Yes (NOE, ROE) | No |
Structural elucidation represents the most significant strength of NMR spectroscopy, providing comprehensive atomic-level information about molecular structure, including connectivity, stereochemistry, and conformation. Two-dimensional NMR experiments such as COSY and TOCSY establish through-bond connectivity between protons, while HSQC and HMBC correlations provide direct evidence of carbon-hydrogen bonding relationships and longer-range couplings, respectively [5]. The nuclear Overhauser effect (NOE), observed through NOESY or ROESY experiments, provides critical through-space distance constraints that enable determination of three-dimensional molecular structure and relative stereochemistry [5]. This comprehensive structural information allows NMR to perform complete de novo structure elucidation of unknown compounds, with recent advances in machine learning frameworks demonstrating the ability to predict molecular structure directly from 1D ¹H and ¹³C NMR spectra with high accuracy [7].
LC-HRMS provides complementary structural information primarily through accurate mass measurement and fragmentation patterns. High-resolution mass measurements enable confident determination of elemental composition, while tandem mass spectrometry produces fragment ions that reveal structural motifs and functional groups [1]. However, MS-based structural elucidation typically requires reference to spectral libraries or computational approaches for complete structural assignment, and struggles with stereochemical differentiation and positional isomers without additional separation dimensions or advanced fragmentation techniques. Recent innovations such as electron-activated dissociation (EAD) have improved structural characterization capabilities for challenging compounds like steroids, providing diagnostic fragments that enable distinction of isomers and isobars [2].
Quantification Performance
Table 3: Quantitative Performance Comparison
| Parameter | NMR | LC-HRMS |
|---|---|---|
| Dynamic Range | 10²-10³ | 10³-10⁶ |
| Accuracy | High (absolute quantification possible) [3] | Variable (matrix-dependent) |
| Precision | High (CV 1.5-4.6%) [8] | Moderate to high (CV 4-15%) |
| Matrix Effects | Minimal | Significant (ion suppression) |
| Standard Requirement | Not essential (absolute quantification) | Essential (relative quantification) |
| Linearity | Excellent inherently linear | Requires calibration curves |
Quantitative analysis represents an area where both techniques exhibit distinct advantages and limitations. NMR spectroscopy provides inherently quantitative data, as signal intensity is directly proportional to the number of nuclei generating the signal. This property enables absolute quantification without compound-specific calibration curves, using certified reference materials or internal standards for concentration determination [3]. NMR quantification demonstrates excellent precision, with reported coefficients of variation (CV) between 1.5-4.6% for validated metabolomics applications [8]. The technique is remarkably robust against matrix effects, with minimal signal variation due to sample composition differences, making it particularly valuable for complex biological samples where matrix-matched calibration is challenging.
LC-HRMS typically provides superior sensitivity and dynamic range for quantitative analysis, but requires compound-specific calibration curves and suffers from matrix effects that can cause significant ion suppression or enhancement [6]. Quantitative performance varies considerably based on instrument platform, with triple quadrupole MS systems generally providing better precision and lower limits of quantification compared to high-resolution instruments, though HRMS systems offer the advantage of simultaneous targeted and untargeted analysis [6]. Method validation studies for untargeted LC-HRMS metabolomics have demonstrated the capability to validate 47-55 metabolites with excellent reproducibility (median repeatability CV of 4.5-4.6%), supporting the use of these platforms for large-scale quantitative studies [8].
Experimental Protocols for Orthogonal Validation
LC-HRMS Method for Steroid Analysis
A representative protocol for sensitive quantification and structural elucidation of steroids using LC-HRMS illustrates the technical capabilities of modern mass spectrometry platforms [2]:
Sample Preparation:
- Add 5 μL of deuterated internal standard mixture to 200 μL of plasma sample
- Precipitate proteins using 250 μL of 0.1M zinc sulfate and 500 μL cold methanol
- Centrifuge at 2,637 rcf for 10 minutes and collect supernatant
- Perform solid-phase extraction using HLB SPE 30 mg (30 μm) plates
- Elute steroids with acetonitrile, dry under N₂, and reconstitute in 50 μL 50:50 methanol:water
Chromatography:
- Column: Kinetex biphenyl (2.6 μm, 100 × 2.1 mm)
- Mobile Phase A: Water with 0.2 mM ammonium fluoride
- Mobile Phase B: Methanol
- Gradient: 50% B to 95% B over 9 minutes, hold for 0.8 minutes
- Flow Rate: 400 μL/min
- Column Temperature: 50°C
- Injection Volume: 15 μL
Mass Spectrometry:
- System: ZenoTOF 7600
- Ionization: ESI positive/negative mode
- Acquisition: Scheduled high-resolution multiple reaction monitoring (sMRMHR)
- MS/MS: Collision-induced dissociation and electron-activated dissociation
- Mass Range: m/z 100-500 (positive mode), m/z 100-800 (negative mode)
This method enables robust, high-throughput quantitative analysis of hormonal steroids with lower limits of quantification sufficient for accurate measurement in plasma samples, while EAD fragmentation provides structural characterization that distinguishes steroid isomers and isobars [2].
NMR Method for Complex Mixture Analysis
A quantitative NMR protocol for complex mixture analysis demonstrates the application of NMR in metabolomics and complex sample characterization [3] [9]:
Sample Preparation:
- For wine metabolomics: Mix 300 μL of wine with 300 μL of deuterated phosphate buffer (pH 3.0) containing 0.1% TSP as internal standard [9]
- Centrifuge at 14,000 rpm for 10 minutes to remove particulate matter
- Transfer 550 μL to standard 5 mm NMR tubes
Data Acquisition:
- Spectrometer: 400 MHz Bruker Avance Neo
- Probe: 5 mm BBO cryoprobe
- Temperature: 300 K
- ¹H NMR Parameters: 128 scans, 4 prior dummy scans, 90° pulse, acquisition time 2.7 s, relaxation delay 5 s
- Water Presaturation: Employed during relaxation delay
- 2D Experiments: ¹H-¹H TOCSY (mixing time 80 ms), ¹H-¹³C HSQC
Data Processing:
- Exponential line broadening: 0.3 Hz
- Fourier transformation followed by phase and baseline correction
- Referencing: TSP methyl signal at δ 0.00 ppm
- Spectral binning: 0.01 ppm buckets for multivariate analysis
- Quantification: Relative to TSP internal standard or absolute quantification using electronic reference
This protocol enables both relative and absolute quantification of metabolites in complex mixtures, with applications demonstrated in wine metabolomics where it successfully discriminated samples based on withering time and yeast strains [9].
Integrated Workflows and Data Integration
Orthogonal Analysis Workflow
The complementary nature of LC-HRMS and NMR spectroscopy makes them ideal partners in orthogonal validation workflows. Integrated approaches leverage the sensitivity and compound-specific detection capabilities of LC-HRMS with the unambiguous structural elucidation and absolute quantification strengths of NMR. Studies have demonstrated that multi-omics data integration combining LC-HRMS and ¹H NMR provides superior classification accuracy and a more comprehensive metabolic characterization compared to either technique alone [9]. In wine metabolomics, this integrated approach successfully discriminated samples based on grape withering time and yeast strains, with significant variations observed in amino acids, monosaccharides, and polyphenolic compounds [9]. Similarly, in biopharmaceutical analysis, orthogonal characterization of monoclonal antibody glycosylation patterns using HRMS, NMR, and HILIC-FLD demonstrated agreement across all methods for major glycoforms, while increasing confidence in glycan characterization through methodological triangulation [10].
Essential Research Reagent Solutions
Table 4: Essential Research Reagents for LC-HRMS and NMR
| Reagent/Material | Application | Function | Example |
|---|---|---|---|
| Deuterated Solvents | NMR spectroscopy | Provides field frequency lock; minimizes solvent interference | D₂O, CD₃OD [9] |
| Internal Standards | Quantitative NMR | Chemical shift reference; quantification | TSP [9] |
| Deuterated Internal Standards | LC-HRMS quantification | Compensates for matrix effects; improves accuracy | Deuterated steroids [2] |
| SPE Cartridges | Sample preparation | Matrix clean-up; analyte concentration | HLB SPE 30 mg [2] |
| Ion Pairing Reagents | LC-HRMS of polar compounds | Improves retention of hydrophilic analytes | Ammonium fluoride [2] |
| Stable Isotope Labels | Metabolic flux studies | Tracks metabolic pathways | ¹³C-labeled compounds |
| NMR Reference Compounds | Method validation | System suitability testing | Traceable standards |
The orthogonal validation of LC-HRMS findings with NMR spectroscopy represents a powerful paradigm in modern analytical chemistry, particularly for drug development and complex mixture analysis. LC-HRMS provides unparalleled sensitivity, broad dynamic range, and excellent specificity for targeted compound quantification, while NMR offers definitive structural elucidation, absolute quantification capabilities, and minimal matrix effects. The strategic integration of these complementary techniques creates an analytical framework whose combined capabilities exceed those of either technique in isolation, enabling comprehensive characterization of complex samples from molecular structure to quantitative abundance. Advances in both technologies—including hyperpolarization methods for NMR and EAD fragmentation for HRMS—continue to expand their synergistic potential, offering researchers increasingly powerful tools for solving complex analytical challenges in pharmaceutical development, metabolomics, and quality control. The objective selection criteria and performance data presented in this guide provide a scientific foundation for technique selection based on specific analytical requirements, supporting robust analytical workflows that deliver validated, defensible results for critical applications in research and regulatory environments.
The unambiguous identification and characterization of small molecules in complex biological and environmental matrices represents one of the most significant challenges in modern analytical science. Researchers in fields ranging from drug development to environmental exposomics consistently face the reality that even the most advanced analytical techniques possess inherent limitations that prevent comprehensive mixture analysis when used in isolation [11]. Liquid Chromatography-High Resolution Mass Spectrometry (LC-HRMS) and Nuclear Magnetic Resonance (NMR) spectroscopy have emerged as the two most powerful platforms for structural elucidation, yet they provide fundamentally different and complementary information [11] [12]. The integration of these techniques creates a powerful synergistic workflow that overcomes the limitations of either method used alone, enabling researchers to achieve a level of analytical confidence unattainable with single-technique approaches [13] [12]. This guide examines the technical foundations of this complementarity, provides experimental protocols for orthogonal validation, and demonstrates through case studies and quantitative data why a multi-technique approach is essential for confident characterization of complex mixtures.
Technical Comparison: Fundamental Differences and Complementarity Between LC-HRMS and NMR
The analytical advantages of LC-HRMS and NMR stem from their fundamentally different physical principles of operation, which in turn define their respective strengths and limitations in characterizing complex mixtures. Understanding these core differences is essential for designing effective integrated workflows.
Table 1: Fundamental Comparison of LC-HRMS and NMR for Complex Mixture Analysis
| Parameter | LC-HRMS | NMR |
|---|---|---|
| Analytical Principle | Mass-to-charge ratio of ions in gaseous phase [11] | Absorption of radiofrequency by atomic nuclei in magnetic field [11] [14] |
| Primary Structural Information | Molecular weight, elemental composition, fragmentation patterns [11] | Molecular framework, functional groups, atomic connectivity, stereochemistry [11] [14] |
| Sensitivity | Femtomole range (10⁻¹³ mol) [11] | Microgram range (10⁻⁹ mol) [11] |
| Quantitation Capability | Requires standards/internal calibrants [14] | Inherently quantitative without standards [11] [15] |
| Isomer Discrimination | Limited ability to distinguish positional isomers and stereoisomers [11] [14] | Excellent for distinguishing isobaric compounds and positional isomers [11] |
| Sample Throughput | High (seconds per analysis) [11] | Low (minutes to hours for 1D spectra; hours to days for 2D) [11] |
| Sample Recovery | Destructive analysis [14] | Non-destructive; sample can be recovered for further analysis [11] [14] |
| Key Limitations | Matrix effects, difficulty distinguishing isomers, requires authentic standards for definitive ID [11] | Low sensitivity, long acquisition times, solvent interference challenges [11] |
The complementarity between these techniques is perhaps most evident in their respective abilities to handle specific analytical challenges. MS can detect certain functional groups such as sulfate and nitro groups that are effectively "NMR silent," while NMR can distinguish isobaric compounds and positional isomers that MS cannot differentiate based on mass alone [11]. Furthermore, NMR provides direct information on molecular conformation and dynamics, including three-dimensional configuration through experiments like NOESY/ROESY [14], while MS provides superior sensitivity for detecting low-abundance metabolites in complex matrices [11].
Experimental Protocols: Methodologies for Orthogonal Validation
Integrated LC-HRMS and NMR Workflow for Natural Products Discovery
The application of complementary LC-HRMS and NMR methodologies is particularly valuable in natural product discovery, where researchers must identify novel compounds in complex biological extracts. The following protocol, adapted from research on endophytic fungi, demonstrates a robust approach for unambiguous structural identification [13]:
Sample Preparation: Extract fungal biomass (e.g., Fusarium petroliphilum) using ethyl acetate. Concentrate under reduced pressure and resuspend in appropriate LC-MS compatible solvents [13].
UHPLC-HRMS/MS Analysis:
- Column: Reversed-phase C18 column (e.g., 2.1 × 100 mm, 1.7 μm)
- Mobile Phase: Gradient of water (A) and acetonitrile (B), both with 0.1% formic acid
- Gradient: 5% to 100% B over 15 minutes
- Mass Analyzer: High-resolution mass spectrometer (e.g., Q-TOF) with data-dependent acquisition
- Ionization: Electrospray ionization in positive and negative modes
- Mass Range: 50-1200 m/z
- Collision Energies: Ramped (e.g., 20-40 eV) for MS/MS fragmentation [13]
Semi-Preparative HPLC Fractionation:
- Column: Reversed-phase C18 column (e.g., 10 × 250 mm, 5 μm)
- Mobile Phase: Optimized gradient based on analytical separation
- Flow Rate: 3 mL/min
- Fraction Collection: Automated collection every 30 seconds
- Detection: UV at 210, 254, and 280 nm [13]
NMR Analysis:
- Sample Preparation: Reconstitute fractions in 600 μL deuterated solvent (e.g., CD₃OD)
- NMR Instrumentation: High-field NMR spectrometer (e.g., 600 MHz)
- Experiments: ¹H NMR, ¹³C NMR, COSY, HSQC, HMBC, NOESY/ROESY
- Temperature: 298K
- Processing: Fourier transformation with appropriate window functions [13]
Data Integration:
- Assemble ¹H-NMR spectra from all fractions into a 2D contour map ("pseudo-LC-NMR")
- Correlate MS-derived molecular formulae and fragmentation patterns with NMR-derived structural information
- Combine data for unambiguous structural elucidation of both known and novel compounds [13]
Statistical Heterospectroscopy (SHY) for Foodomics Applications
In food quality assessment, a multilevel correlation approach integrating LC-HRMS and NMR data has been successfully applied to table olives, providing a template for other complex mixtures [12]:
Parallel Sample Preparation:
- Extract identical samples using standardized protocols (e.g., methanol-water extraction)
- Split extracts for simultaneous LC-HRMS and NMR analysis
- Maintain consistent sample handling to minimize technical variability [12]
Untargeted UPLC-HRMS/MS Analysis:
- Chromatography: Reversed-phase UPLC with appropriate gradient
- Mass Detection: High-resolution mass spectrometer with ESI source
- Data Acquisition: Full-scan MS with data-dependent MS/MS
- Quality Control: Inject pooled quality control samples throughout sequence [12]
NMR Spectroscopy:
- Sample Preparation: Mix aliquots with deuterated solvent containing TMS reference
- Acquisition: Standard ¹H NMR with water suppression
- Parameters: Sufficient scans to achieve adequate S/N for low-abundance metabolites [12]
Multilevel Data Integration:
- Process LC-HRMS and NMR datasets independently using standard software
- Apply Statistical Heterospectroscopy (SHY) to analyze covariance between signal intensities from both platforms
- Identify statistically significant biomarkers through combined statistical power
- Validate annotations through comparison with authentic standards where available [12]
Integrated LC-HRMS/NMR Workflow for Complex Mixtures
Quantitative Data: Comparative Performance Metrics
The orthogonal nature of LC-HRMS and NMR produces distinct but complementary quantitative data that, when combined, provides a more comprehensive understanding of complex mixtures than either technique alone.
Table 2: Quantitative Comparison of Detection and Identification Capabilities
| Analysis Parameter | LC-HRMS Performance | NMR Performance | Complementary Advantage |
|---|---|---|---|
| Limit of Detection | Femtomole range (10⁻¹³ mol) [11] | Microgram range (10⁻⁹ mol) [11] | >10,000x sensitivity difference enables broad concentration range coverage |
| Quantitative Precision | Requires internal standards [14] | <0.1% with internal reference method [15] | NMR provides absolute quantitation; MS provides sensitivity for trace analytes |
| Isomer Identification | Limited capability [11] | Distinguishes positional isomers and stereochemistry [14] | NMR resolves structural ambiguities remaining after MS analysis |
| Annotation Confidence | Tentative without standards [11] | Definitive structural determination [11] | Combined approaches achieve highest confidence levels (MSI Level 1) |
| Analysis Time | Seconds to minutes [11] | Minutes to days [11] | MS rapidly screens for features of interest; NMR provides definitive ID on selected targets |
The quantitative NMR (qNMR) approach demonstrates particularly robust performance characteristics, with the internal reference method showing exceptional precision (stable within 0.1% for at least 4 weeks) [15]. When applied to complex mixture analysis, integrated approaches have demonstrated the ability to correctly classify samples with error rates as low as 7.52% in wine metabolomics studies, significantly outperforming single-technique approaches [16].
Case Studies: Real-World Applications in Pharmaceutical and Food Science
Accelerated Drug Development Through Structural Elucidation
In pharmaceutical development, the integration of LC-HRMS and NMR has demonstrated significant value in accelerating drug discovery timelines. A case study involving the structural confirmation of a novel antihypertensive small molecule illustrates this advantage [14]. When internal analytical teams struggled to identify the stereochemical integrity of a chiral compound critical to the drug's efficacy, outsourcing to specialists employing 2D-NMR (COSY, HSQC, HMBC) and chiral NMR techniques revealed a stereochemical inversion at the 4th carbon that was subsequently corrected in synthesis. This application of complementary techniques resulted in a 30% reduction in development time and significant cost savings due to early correction, ultimately leading to a successful Investigational New Drug (IND) application [14].
Food Quality Assessment Through Multi-Omics Data Fusion
In foodomics, the integration of LC-HRMS and NMR has proven valuable for quality control and authentication of valuable food commodities. A comprehensive study of table olives employed statistical heterospectroscopy (SHY) to combine LC-HRMS and NMR datasets, enabling the identification of biomarkers correlated to geographical origin, botanical variety, and processing parameters [12]. The approach identified phenyl alcohols, phenylpropanoids, flavonoids, secoiridoids, and triterpenoids as responsible for observed classifications, providing a methodological framework that could be extended to other food quality control applications [12]. Similarly, a study on Amarone wine classification demonstrated that data fusion of LC-HRMS and ¹H NMR profiles significantly improved predictive accuracy for classifying wines based on grape withering time and yeast strain, with significant variations observed in amino acids, monosaccharides, and polyphenolic compounds [16].
Essential Research Reagent Solutions
Successful implementation of integrated LC-HRMS/NMR workflows requires specific reagents and materials optimized for the technical requirements of both platforms.
Table 3: Essential Research Reagents and Materials for Integrated LC-HRMS/NMR Workflows
| Reagent/Material | Function/Purpose | Technical Considerations |
|---|---|---|
| Deuterated Solvents (e.g., CD₃OD, D₂O) | NMR solvent with minimal interference | Required for solvent suppression; D₂O relatively inexpensive while deuterated organics cost >$1/mL [11] |
| Internal Quantitative Standards (e.g., TMS, DSS) | Chemical shift reference for NMR; quantitation | Provides consistent internal reference for chemical shift calibration [15] |
| LC-MS Grade Solvents | Mobile phase for chromatography | High purity minimizes background noise and ion suppression in MS [11] |
| Formic Acid/Acetic Acid | Mobile phase modifiers | Improves ionization efficiency in MS; concentration (typically 0.1%) must be compatible with NMR [11] [13] |
| SPE Cartridges (C18, polymeric) | Sample cleanup and concentration | Removes interfering matrix components; enables analyte concentration for NMR detection [11] |
| Deuterated Internal Standards (e.g., D₄-TSP) | Quantitative NMR reference | Enables precise concentration determination without interference [15] |
| Cryoprobes/Microcoil Probes | NMR sensitivity enhancement | Cryoprobes provide 4x S/N improvement in organic solvents; microcoil probes enable <1.5 μL active volumes [11] |
The comprehensive analysis of complex mixtures represents a fundamental challenge that cannot be adequately addressed by any single analytical technique. LC-HRMS provides exceptional sensitivity, selectivity, and molecular weight information but struggles with definitive isomer identification and requires authentic standards for unambiguous compound identification. NMR spectroscopy delivers definitive structural information, stereochemical resolution, and inherent quantitation capabilities but suffers from relatively low sensitivity and longer analysis times. The integration of these complementary techniques creates a synergistic analytical platform that overcomes the limitations of either method used in isolation, enabling researchers to achieve a level of analytical confidence essential for demanding applications in pharmaceutical development, foodomics, clinical metabolomics, and environmental exposomics. As the complexity of analytical challenges continues to grow in scientific research, the implementation of orthogonal validation strategies employing both LC-HRMS and NMR will become increasingly essential for definitive characterization of complex mixtures.
Orthogonal validation, the practice of verifying results using methods that operate on different scientific principles, is a cornerstone of robust scientific research. In the analysis of complex biological samples, no single analytical technique can provide a complete picture. The synergistic use of Liquid Chromatography-High-Resolution Mass Spectrometry (LC-HRMS) and Nuclear Magnetic Resonance (NMR) spectroscopy represents a powerful orthogonal partnership, merging their distinct strengths to deliver a level of confidence in data interpretation that neither could achieve alone [17].
This guide explores the core concepts of this approach, providing a detailed comparison of the techniques, standardized experimental protocols, and visual workflows to help researchers build an unshakeable foundation for their findings.
The "Why": Fundamental Principles of an LC-HRMS and NMR Partnership
Orthogonal validation is akin to using a reference weight to verify a scale's measurement; it uses antibody-independent data to cross-reference and verify the results of an antibody-driven experiment [18]. In the context of LC-HRMS and NMR, this means combining two powerful, yet fundamentally different, analytical techniques to control for the inherent limitations and potential biases of each.
- LC-HRMS excels at sensitivity and identification. It can detect and provide precise molecular weights for countless compounds in a complex mixture, even at very low concentrations. Its ability to generate fragmentation patterns (MS/MS) is invaluable for proposing molecular structures [19] [17].
- NMR provides definitive structural elucidation. It is a robust and reproducible technique that offers unparalleled insight into molecular conformation, functional groups, stereochemistry, and dynamics. It is quantitative by principle and does not require compound-specific optimization [14] [17].
The table below summarizes their complementary roles in an orthogonal framework:
Table 1: Orthogonal Roles of LC-HRMS and NMR
| Attribute | LC-HRMS | NMR |
|---|---|---|
| Primary Strength | High sensitivity; broad metabolite coverage; tentative identification via accurate mass and MS/MS | Absolute structural elucidation; stereochemistry resolution; quantification without standards |
| Structural Detail | Molecular formula, fragmentation pattern | Full molecular framework, atomic connectivity, 3D conformation |
| Sensitivity | High (picogram to nanogram) | Moderate (microgram) |
| Quantification | Possible, but requires internal standards | Inherently quantitative |
| Key Advantage | Identifies features of interest in complex mixtures | Confirms identity and resolves isomers with high confidence |
| Major Limitation | Structural ambiguity, especially for isomers | Lower sensitivity; signal overlap in complex mixtures |
The "How": Experimental Protocols for Integrated Workflows
Implementing an orthogonal strategy requires careful experimental planning. Below are detailed protocols for leveraging LC-HRMS and NMR, both in parallel and in a directly integrated fashion.
Protocol 1: Parallel Analysis with Data Fusion
This is a widely used approach where the same sample set is analyzed separately by LC-HRMS and NMR, with the data combined computationally.
Sample Preparation:
- Extract samples (e.g., plant material, biofluids) using a solvent system appropriate for the metabolite classes of interest (e.g., hydroethanolic for polar phenolics) [20].
- For LC-HRMS, clarify the extract via centrifugation and filtration (e.g., 0.22 µm membrane).
- For NMR, take an aliquot of the extract and dry it under a nitrogen stream. Reconstitute the dried material in a deuterated solvent (e.g., D₂O, CD₃OD) containing a known concentration of an internal standard (e.g., TSP for ¹H NMR) for chemical shift referencing and quantification [20] [17].
LC-HRMS Analysis:
- Chromatography: Use a UHPLC system with a reversed-phase column (e.g., C18, 100 x 2.1 mm, 1.7 µm). Employ a water-acetonitrile gradient with 0.1% formic acid over 15-20 minutes [20].
- Mass Spectrometry: Acquire data on a high-resolution mass spectrometer (e.g., Orbitrap) in both positive and negative electrospray ionization (ESI) modes. Use a data-dependent acquisition (DDA) method to collect full-scan MS and subsequent MS/MS spectra for the most intense ions [21].
NMR Analysis:
- Acquisition: Perform ¹H NMR experiments on a high-field spectrometer (e.g., 600 MHz). The standard 1D experiment with water suppression is essential. For complex mixtures, 2D experiments such as J-resolved (JRES), COSY, and HSQC are invaluable for disentangling signals and establishing atom connectivity [20] [14].
Data Fusion and Analysis:
- Process LC-HRMS data (peak picking, alignment) and NMR data (Fourier transformation, phasing, baseline correction) using specialized software.
- The datasets are concatenated using data fusion methods (e.g., Statistical HetetospectroscopY - SHY) and submitted to multivariate statistical analysis (e.g., PCA, sPLS-DA) to identify key discriminating metabolites responsible for sample classification [16] [17].
Protocol 2: Integrated LC-MS-NMR Platform with Active Segmentation
For the highest confidence in correlating data, a platform that physically splits the LC eluent for simultaneous MS and NMR analysis can be employed.
Platform Setup:
- The system uses an active segmentation platform with a four-port, two-way valve to transform the analytical LC flow rate eluent into a segmented flow [22].
- The LC eluent is mixed with a carrier phase (e.g., perfluorotributylamine, FC43) that is immiscible, lipophobic, non-ionizable in ESI, and transparent in ¹H NMR [22].
- The valve switches at a high frequency (~1 Hz) to create microliter-sized segments of eluent separated by the carrier phase [22].
Post-Separation Workflow:
- The segmented flow is split into two parallel paths.
- One path is directed online to the HRMS for real-time analysis.
- The other path is stored in capillary tubing as a "queue" of segments.
- Based on the MS results, segments containing analytes of interest are selected and delivered offline to a capillary NMR flow cell (e.g., a Protasis microcoil probe) for segment-specific ¹H NMR analysis [22].
Table 2: Key Research Reagent Solutions
| Reagent / Material | Function in the Workflow |
|---|---|
| Deuterated Solvents (e.g., D₂O, CD₃OD) | NMR solvent; provides a lock signal and defines the chemical shift reference [20]. |
| Internal Standard (e.g., TSP) | Chemical shift reference and quantitative standard in NMR spectroscopy [17]. |
| Perfluorotributylamine (FC43) | Immiscible carrier phase in active segmentation; MS-silent and NMR-transparent [22]. |
| PNGase F Enzyme | Enzymatically releases N-glycans from monoclonal antibodies for glycosylation analysis [21]. |
| Fluorophore (e.g., 2-AB) | Labels released glycans for sensitive fluorescence detection (FLD) in HILIC analysis [21]. |
| Trypsin Protease | Proteolytically digests proteins into peptides (including glycopeptides) for MAM analysis [21]. |
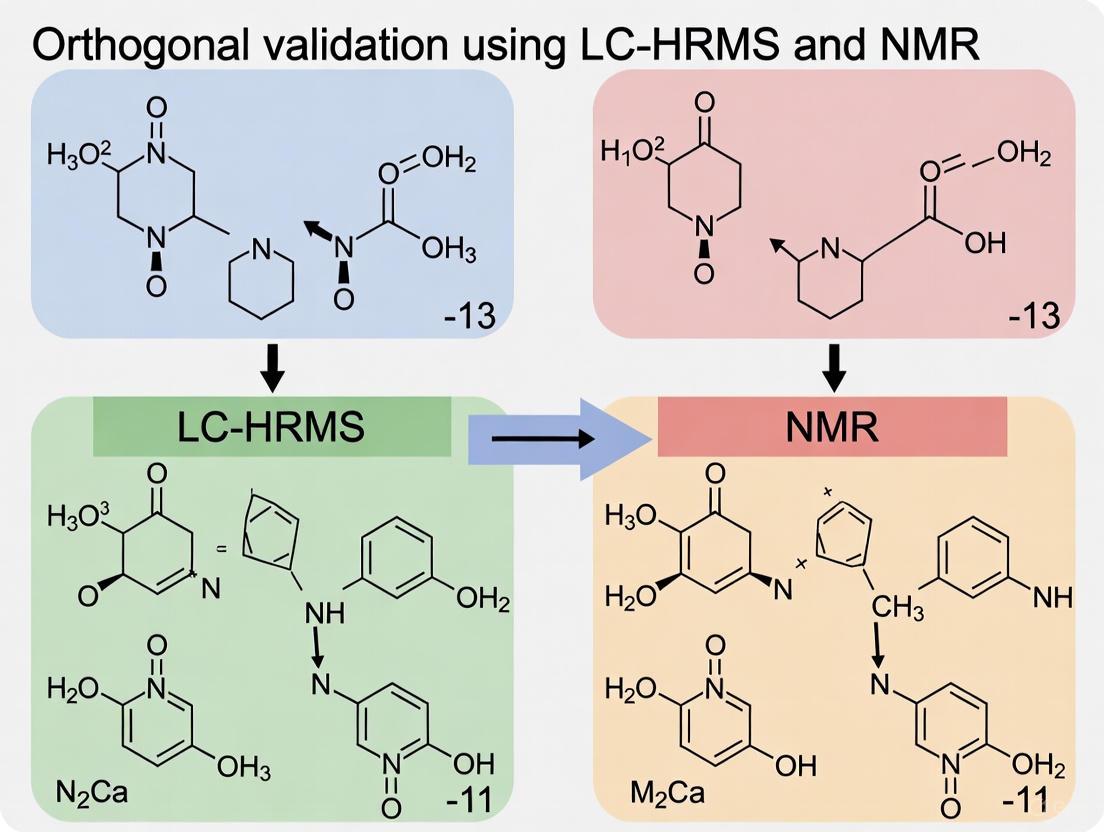
Visualizing the Workflow: From LC Separation to Structural Confidence
The following diagram illustrates the logical pathway of an orthogonal validation strategy, highlighting how LC-HRMS and NMR data converge to build confidence in metabolite identification.
Orthogonal LC-HRMS and NMR Workflow
Application in Action: Case Studies in Biopharma and Beyond
The power of this orthogonal approach is best demonstrated through real-world applications.
Case Study 1: Biosimilar Characterization A study compared the glycosylation profiles of an FDA-approved innovator product (Rituximab) and a foreign-sourced product. The panel of methods included HILIC-FLD, MAM (LC-HRMS of glycopeptides), intact mass LC-MS, and middle-down NMR. The results demonstrated agreement across all methods for major glycoforms, showing how confidence in glycan characterization is dramatically increased by combining orthogonal methodologies. This is critical for demonstrating analytical comparability for biosimilar approval [21].
Case Study 2: Foodomics and Authentication In the classification of Amarone wines, a data fusion approach that integrated LC-HRMS and ¹H NMR datasets provided a much broader characterization of the wine metabolome than either technique alone. The multi-omics model successfully classified wines based on withering time and yeast strains with a low error rate (7.52%), identifying discriminators like amino acids and polyphenols. The study noted a limited correlation between the datasets (RV-score=16.4%), underscoring their complementarity [16].
Table 3: Performance Comparison in Metabolite Identification
| Metric | LC-HRMS Alone | NMR Alone | Orthogonal LC-HRMS + NMR |
|---|---|---|---|
| Confidence Level | Tentative annotation (MSI level 2) | Confident identification (MSI level 1) | Confirmed structure (Highest confidence) |
| Isomer Resolution | Limited; requires advanced MS/MS or separation | Excellent; via chemical shift and J-coupling | Definitive |
| Quantification | Semi-quantitative (needs standards) | Fully quantitative | Robust and quantitative |
| Throughput | High | Moderate | Moderate (workflow dependent) |
| Application Example | Detecting 100s of features in plant extract [20] | Profiling monosaccharide content in mAbs [21] | Classifying wine origin & processing [16] |
In an era demanding rigorous reproducibility and deep scientific insight, orthogonal validation is not a luxury but a necessity. The partnership between LC-HRMS and NMR forms a powerful foundation for confidence, transforming ambiguous data into confirmed chemical structures. As the presented protocols and case studies show, this integrated approach is indispensable for critical tasks in drug development, from characterizing complex biologics like monoclonal antibodies to ensuring the quality and authenticity of natural products. By systematically implementing these core concepts, researchers and drug development professionals can build a robust, defensible, and trustworthy analytical practice.
Metabolomics, the comprehensive analysis of small-molecule metabolites in biological systems, has become an indispensable tool across multiple scientific disciplines. Its power is greatly amplified when analytical techniques are combined to leverage their complementary strengths. Liquid Chromatography-High Resolution Mass Spectrometry (LC-HRMS) provides exceptional sensitivity for detecting and quantifying a vast array of metabolites, while Nuclear Magnetic Resonance (NMR) spectroscopy offers unparalleled structural elucidation capabilities and precise quantification without requiring reference standards [23] [24]. This orthogonal validation—using independent methods to confirm analytical findings—represents a cornerstone of rigorous metabolomics research, enhancing data reliability and biological interpretation across drug development, foodomics, and clinical applications [23].
The following sections explore key applications in these fields, supported by experimental data, detailed methodologies, and visualizations of the integrated workflows that leverage both LC-HRMS and NMR technologies.
Drug Development and Pharmacometabolomics
Application in Target Identification and Mechanism of Action
Metabolomics has revolutionized early drug discovery by identifying novel therapeutic targets and elucidating mechanisms of action (MoA). A prominent example is the development of Ivosidenib and Enasidenib for treating acute myeloid leukemia (AML). Metabolomics studies identified D-2-hydroxyglutarate (D-2HG) as an oncometabolite that contributes to disease processes in AML and gliomas. This discovery revealed mutated isocitrate dehydrogenase (IDH) as a promising drug target, leading to the development of inhibitors that specifically block D-2HG production [25]. Similarly, glutamine metabolism was identified as a hallmark of cancer metabolism through metabolomics, leading to the development of CB-839 (Telaglenastat), a glutaminase inhibitor that demonstrated antitumor activity in triple-negative breast cancer models by reducing glutamate and downstream metabolites [25].
Table 1: Drug Development Applications Supported by Metabolomics
| Application Area | Specific Use Case | Metabolomics Contribution | Techniques Employed |
|---|---|---|---|
| Target Identification | IDH inhibitors for AML | Discovery of oncometabolite D-2-hydroxyglutarate | LC-MS, Stable Isotope Tracing [25] |
| MoA Elucidation | Glutaminase inhibitors | Revealed reduction in glutamate & downstream metabolites | LC-MS, Metabolic Flux Analysis [25] |
| Drug Safety | Preclinical toxicity assessment | Identification of metabolic signatures of adverse effects | NMR, LC-MS [26] |
| Pharmacometabolomics | Predicting drug response | Pre-treatment metabolome predicts efficacy and toxicity | LC-MS, NMR [26] |
Experimental Protocol: Target Engagement Studies Using Metabolic Flux Analysis
Objective: Determine whether a compound modulates its intended metabolic target in cellular models.
Methodology:
- Cell Treatment: Expose cell lines (e.g., cancer cells) to the drug candidate and appropriate controls.
- Stable Isotope Labeling: Incubate cells with 13C-labeled nutrients (e.g., [1-13C]-glucose or [3-2H]-glucose) to track metabolic activity [25].
- Sample Collection: Harvest cells at multiple time points and extract metabolites using methanol:water:chloroform solvent systems.
- LC-HRMS Analysis:
- NMR Validation:
- Employ 1H NMR to confirm structural identity of key metabolites showing significant changes.
- Utilize 2D NMR techniques (e.g., COSY, HSQC) to resolve structural ambiguities for novel metabolites [24].
- Data Integration: Combine flux measurements from LC-HRMS with structural confirmation from NMR to comprehensively assess target engagement.
This orthogonal approach confirmed the MoA of glutaminase inhibitors by showing reduced flux from glutamine to glutamate while structurally validating the identity of these metabolites [25].
Figure 1: Experimental workflow for orthogonal validation in drug target engagement studies
Foodomics and Agricultural Applications
Food Authentication and Quality Control
Foodomics applies metabolomics to address challenges in food safety, authenticity, and quality. LC-HRMS and NMR are powerfully combined to detect food adulteration and verify geographical origin. A study on Aloe vera leaf extracts from different geographical regions utilized untargeted LC-HRMS to analyze hydroalcoholic extracts, revealing 77 organic compounds including primary metabolites and natural products. Principal Component Analysis clearly separated samples based on geographical origins, with specific metabolites (e.g., aloe-emodin, tropine, and jasmonic acid) serving as discriminatory markers [27]. NMR provides complementary validation by confirming the structural identity of key marker compounds, essential for developing reliable authentication methods.
In halal meat authentication, metabolomics approaches combining LC-MS or GC-MS with multivariate data analysis successfully discriminate between halal and non-halal meats, addressing significant religious, ethical, and economic concerns in global food markets [28].
Experimental Protocol: Geographical Origin Authentication of Botanicals
Objective: Establish a reliable method to verify the geographical origin of botanical samples using orthogonal metabolomics.
Methodology:
- Sample Collection: Collect plant materials (e.g., Aloe vera leaves) from different geographical regions with documented cultivation practices [27].
- Metabolite Extraction: Prepare hydroalcoholic extracts (e.g., methanol:water mixtures) using standardized protocols.
- LC-HRMS Analysis:
- Chromatography: Employ reversed-phase C18 columns with gradient elution.
- Mass Spectrometry: Acquire data in positive and/or negative ionization modes using high-resolution mass analyzers.
- Data Processing: Use software tools (e.g., Compound Discoverer) with spectral libraries (mzCloud) for metabolite annotation following Metabolomics Standards Initiative guidelines [27].
- NMR Analysis:
- Prepare samples in deuterated solvents.
- Acquire 1D 1H NMR spectra and 2D spectra (COSY, HSQC, HMBC) for structural confirmation of key discriminatory metabolites [23].
- Chemometric Analysis:
- Apply unsupervised methods (Principal Component Analysis) to explore natural clustering.
- Use supervised models (OPLS-DA) to identify significant biomarkers.
- Data Fusion:
- Implement mid-level data fusion to combine selected features from LC-HRMS and NMR datasets [23].
- Build consolidated classification models with enhanced predictive power.
Table 2: Key Metabolites for Geographical Discrimination of Aloe Vera
| Geographical Origin | Discriminatory Metabolites | Analytical Technique | Identification Confidence Level |
|---|---|---|---|
| Portici, Italy (PO) | Aloe-emodin, Tropine, Tropinone | LC-HRMS, NMR | Level 1 (confirmed with standards) [27] |
| Gran Canaria (CAN) | Jasmonic acid, Quinic acid, Aloesin | LC-HRMS, NMR | Level 1-2 [27] |
| Brindisi, Italy (CA, E, MM) | Limonene, α-linolenic acid, Erythrose-4-phosphate | LC-HRMS | Level 1-2 [27] |
Clinical Metabolomics and Precision Medicine
Advancing Personalized Therapeutics through Pharmacometabolomics
Pharmacometabolomics, an emerging branch of metabolomics, integrates pre-treatment metabolome data with drug exposure information to predict individual variations in drug response. This approach addresses the critical challenge that approximately 60% of drugs failing in Phase III clinical trials and only 25-60% of patients exhibiting anticipated treatment responses [26]. By capturing the combined influence of genetics, environment, gut microbiome, and lifestyle on metabolic phenotype (metabotype), pharmacometabolomics provides a powerful tool for personalized therapy.
Notable applications include monitoring tamoxifen and its metabolites in breast cancer patients using LC-MS/MS to predict side effects and discontinuation rates [29]. Similarly, MS-based pharmacometabolomics identified citrate, oxaloacetate, α-ketoglutarate, and malate as predictors of response to spironolactone in resistant hypertension patients, achieving an AUC of 0.96 for discriminating responders from non-responders [29].
Experimental Protocol: Predicting Drug Response in Clinical Trials
Objective: Identify pre-treatment metabolic biomarkers that predict interindividual differences in drug response.
Methodology:
- Study Design: Prospective cohort study with baseline sample collection before treatment initiation.
- Sample Collection: Obtain biofluids (plasma, serum, urine) following standardized protocols to minimize pre-analytical variations.
- LC-HRMS Analysis (Untargeted):
- Sample Preparation: Protein precipitation with organic solvents (e.g., acetonitrile or methanol).
- Chromatographic Separation: Use reversed-phase and HILIC chromatography to maximize metabolite coverage.
- Data Acquisition: Employ full-scan high-resolution MS with data-dependent MS/MS for metabolite annotation.
- NMR Analysis:
- Sample Preparation: Mix biofluids with deuterated phosphate buffer for field locking.
- Spectral Acquisition: Collect 1D 1H NMR spectra with water suppression.
- Quantification: Use qNMR with internal standards for absolute quantification of key predictive metabolites [24].
- Data Integration and Modeling:
- Pre-processing: Normalize, scale, and transform data from both platforms.
- Feature Selection: Identify significantly altered metabolites associated with treatment outcome.
- Model Building: Develop predictive models using machine learning algorithms.
- Validation: Verify biomarkers in an independent cohort with orthogonal methods.
Figure 2: Pharmacometabolomics workflow for predicting individual drug response
The Scientist's Toolkit: Essential Research Reagent Solutions
Table 3: Key Reagents and Materials for LC-HRMS and NMR Metabolomics
| Reagent/Material | Function | Application Examples |
|---|---|---|
| Deuterated Solvents (D₂O, CD₃OD) | Provides NMR field frequency lock; minimizes solvent interference | Sample preparation for NMR spectroscopy [23] [24] |
| Internal Standards (Maleic acid, Benzoic acid, DSS) | Enables quantitative NMR; reference compound for chemical shift calibration | Absolute quantification in qNMR [24] |
| Stable Isotope Tracers ([1-13C]-glucose, [3-2H]-glucose) | Tracks metabolic pathway activity in living systems | Metabolic flux analysis [25] |
| Derivatization Reagents (MSTFA, Methoxyamine) | Enhances volatility and detection of non-volatile compounds | GC-MS sample preparation [29] |
| Chromatography Columns (C18 RP, HILIC) | Separates complex metabolite mixtures prior to detection | LC-MS analysis of diverse metabolite classes [25] [30] |
| Quality Control Pools | Monitors instrument performance; normalizes batch effects | Quality assurance in large-scale metabolomic studies |
The orthogonal validation of LC-HRMS findings with NMR represents a powerful paradigm in modern metabolomics, enhancing data reliability across drug development, foodomics, and clinical applications. LC-HRMS provides exceptional sensitivity for detecting subtle metabolic alterations, while NMR delivers robust structural elucidation and absolute quantification. This synergistic combination enables more confident biomarker discovery, mechanistic understanding, and translational applications. As both technologies continue to advance—with improvements in MS sensitivity, NMR throughput, and data integration algorithms—their combined utility will further expand, ultimately accelerating precision medicine and enhancing quality control across diverse sectors.
From Theory to Practice: Implementing Integrated LC-HRMS and NMR Workflows
In analytical chemistry and metabolomics, the pursuit of a comprehensive understanding of complex biological systems often necessitates the use of multiple analytical platforms. Data fusion has emerged as a powerful multidisciplinary field that allows the integration of different datasets obtained using various independent techniques to provide better insights than each approach alone [23]. This approach is particularly valuable in the context of orthogonal validation, where techniques such as Liquid Chromatography-High Resolution Mass Spectrometry (LC-HRMS) and Nuclear Magnetic Resonance (NMR) spectroscopy provide complementary information that, when combined, offer a more holistic view of biochemical profiles [23] [31].
The most widely accepted classification system for data fusion in analytical science is based on levels of abstraction, categorizing approaches as low-level, mid-level, and high-level data fusion [23]. This progression represents increasing complexity in data handling, from the direct concatenation of raw data to the combination of model outputs. The fundamental principle underpinning all data fusion strategies is the synergistic combination of complementary data sources to achieve refined assessments that would be impossible with single-source data [32].
Theoretical Frameworks and Classifications
Historical Development and Definitions
The data fusion field was formally defined by the Joint Directors of Laboratories (JDL) workshop as "A multi-level process dealing with the association, correlation, combination of data and information from single and multiple sources to achieve refined position, identify estimates and complete and timely assessments of situations, threats and their significance" [33] [32]. This definition highlights the comprehensive nature of data fusion as a process that extends beyond simple data combination to include assessment and refinement.
A more specific definition provided by Hall and Llinas describes data fusion techniques as methods that "combine data from multiple sensors and related information from associated databases to achieve improved accuracy and more specific inferences than could be achieved by the use of a single sensor alone" [32]. In the context of analytical chemistry, this translates to combining data from orthogonal analytical platforms like LC-HRMS and NMR to achieve more accurate and comprehensive metabolite identification and quantification than either technique could provide independently.
Dasarathy's Classification System
One of the most influential classification systems in data fusion was developed by Dasarathy, who categorized techniques based on input and output data types [32]. This system comprises five distinct categories that provide a framework for understanding how data is transformed through the fusion process:
- Data In-Data Out (DAI-DAO): This most basic level inputs and outputs raw data, with results typically being more reliable or accurate data than the original sources.
- Data In-Feature Out (DAI-FEO): At this level, the fusion process employs raw data from sources to extract features or characteristics that describe entities in the environment.
- Feature In-Feature Out (FEI-FEO): Both input and output are features, with the fusion process aimed at improving, refining, or obtaining new features.
- Feature In-Decision Out (FEI-DEO): This category takes features as input and provides decisions as output, encompassing most classification systems.
- Decision In-Decision Out (DEI-DEO): This level fuses input decisions to obtain better or new decisions, also known as decision fusion [32].
This classification system is particularly valuable because it specifies the abstraction level of both inputs and outputs, providing a structured framework for classifying different methods and techniques used in data fusion workflows.
Levels of Data Fusion: Mechanisms and Methodologies
Low-Level Data Fusion (LLDF)
Low-level data fusion, also referred to as data-level fusion or block concatenation, represents the most straightforward strategy for integrating data from different analytical platforms [23]. This approach involves the concatenation of two or more data matrices originating from different sources into a single composite matrix [23] [34]. The fused matrix comprises m-rows (individual samples) and n-columns (measurement variables from each source) [34].
The implementation of LLDF requires careful pre-processing, which can be divided into three critical stages [23]:
- Pre-processing to correct artefacts from signal acquisition for each sensor or instrument.
- Equalizing contributions from each dataset using methods such as mean centering or unit variance scaling.
- Correcting weights of each block from different analytical sources to prevent dominance by blocks with the greatest variance.
In a practical demonstration, researchers applied LLDF to combine Raman and infrared spectroscopy data for assessing meat quality, resulting in a fused matrix of 713 variables (314 from Raman and 399 from infrared) [34]. The performance of this approach showed particular promise in predicting the percentage of intramuscular fat (% IMF) in red meat, with a normalized root mean square error of prediction (NRMSEP) of 8.5% [34].
Mid-Level Data Fusion (MLDF)
Mid-level data fusion addresses a significant limitation of LLDF: the challenge of managing datasets where the number of observations is much smaller than the number of variables [23]. MLDF employs a two-step methodology that first extracts the most important characteristics from the individual matrices before concatenating the outputs to build a single matrix for processing [23] [34].
The feature extraction step typically employs dimensionality reduction techniques, with Principal Component Analysis (PCA) being the most popular method for first-order data [23]. For more complex second-order data, methods such as Parallel Factor Analysis (PARAFAC), PARAFAC2, or Multivariate Curve Resolution–Alternating Least Squares (MCR-ALS) may be employed [23].
The power of MLDF was demonstrated in a comprehensive study on salmon authenticity, where researchers fused data from Rapid Evaporative Ionisation Mass Spectrometry (REIMS) and Inductively Coupled Plasma Mass Spectrometry (ICP-MS) [35]. This approach achieved remarkable performance, with a cross-validation classification accuracy of 100% for determining geographical origin and production methods, correctly identifying all test samples (n=17) - a feat not possible with single-platform methods [35].
High-Level Data Fusion (HLDF)
High-level data fusion, also known as decision-level fusion, represents the most complex approach to data integration [23] [34]. In this strategy, classification or regression models are built using data from individual techniques, and the model predictions are subsequently fused to obtain a final outcome [23] [34]. This approach is the least explored of the three fusion strategies but offers unique advantages in certain applications.
HLDF is particularly advantageous when integrating heterogeneous analytical platforms such as NMR and MS, which differ in dimensionality, scale, and pre-processing requirements [23]. Rather than fusing variables directly, this approach aggregates model-level outputs using strategies like majority voting, probabilistic averaging, or supervised meta-modeling [23]. A relevant application is the multiblock DD-SIMCA method, where full distances from individual models are combined into a single cumulative metric known as the Cumulative Analytical Signal (CAS) [23].
In the assessment of red meat quality, HLDF demonstrated superior performance in predicting pH values, achieving a determination coefficient (R²) of 0.73 and NRMSEP of 12.9% [34]. This performance advantage over individual techniques and other fusion strategies highlights the potential of HLDF for specific analytical challenges.
Comparative Performance Analysis
Table 1: Performance Comparison of Data Fusion Strategies in Practical Applications
| Fusion Level | Application Context | Performance Metrics | Key Advantages | Limitations |
|---|---|---|---|---|
| Low-Level Fusion | Prediction of % IMF in red meat using Raman & IR spectroscopy [34] | NRMSEP = 8.5% [34] | Simple implementation; Preserves all original information | Susceptible to dominant blocks; Requires careful preprocessing [23] |
| Mid-Level Fusion | Geographical origin authentication of salmon using REIMS & ICP-MS [35] | 100% classification accuracy; All test samples (n=17) correctly identified [35] | Handles high-dimensional data; Balances information content and complexity [23] | Feature extraction critical; Potential information loss if features poorly selected [23] |
| High-Level Fusion | Prediction of pH in red meat using Raman & IR spectroscopy [34] | R² = 0.73; NRMSEP = 12.9% [34] | Robust to technique failures; Can integrate heterogeneous data structures [23] | Significant information loss; Complex interpretation [34] |
Table 2: Characteristics of Data Fusion Levels for NMR and MS Integration
| Characteristic | Low-Level Fusion | Mid-Level Fusion | High-Level Fusion |
|---|---|---|---|
| Data Representation | Raw or pre-processed data matrices [23] | Extracted features (e.g., PCA scores) [23] | Model predictions or decisions [23] |
| Information Preservation | High - retains all original data [23] | Medium - preserves most relevant information [23] | Low - only final decisions preserved [34] |
| Implementation Complexity | Low [34] | Medium [23] | High [23] |
| Interpretability | Challenging with high-dimensional data [23] | Moderate - depends on feature extraction method [23] | Low - decision aggregation obscures individual contributions [23] |
| Suitability for NMR-MS Fusion | Good with proper block scaling [23] | Excellent - handles different data structures effectively [31] | Good for final decision integration [23] |
Experimental Protocols and Methodologies
Protocol for Low-Level Data Fusion
Implementing effective low-level data fusion requires systematic pre-processing to ensure meaningful integration of data from different analytical platforms:
Data Collection: Acquire data from complementary techniques such as LC-HRMS and NMR spectroscopy. For example, in a hazelnut authentication study, researchers acquired ¹H-NMR and LC-HRMS data from different cultivars and origins [31].
Individual Pre-processing:
Data Concatenation: Merge pre-processed data matrices from different techniques into a single composite matrix [34]. In a spectroscopy study, this resulted in a fused matrix with 713 variables (314 from Raman and 399 from infrared) [34].
Inter-block Scaling: Apply scaling methods such as Pareto scaling (1/√σ²) or adjust weights to provide equal sums of standard deviation (1/(∑σ)block) to equalize contributions from different techniques [23].
Model Building: Utilize the fused matrix to build multivariate models using methods such as Principal Component Analysis (PCA) or Partial Least Squares regression (PLS) [23] [34].
Protocol for Mid-Level Data Fusion
The mid-level fusion protocol emphasizes feature extraction before integration:
Individual Data Processing: Process data from each analytical technique separately, including necessary pre-processing steps [35].
Feature Extraction: Apply dimensionality reduction techniques to each dataset independently. Common approaches include:
Feature Concatenation: Combine the extracted features (e.g., PCA scores) from different techniques into a single fused matrix [23] [35].
Model Development: Build classification or regression models using the fused feature matrix. In the salmon authentication study, this approach achieved 100% classification accuracy for geographical origin [35].
Validation: Implement rigorous cross-validation and testing with independent samples to validate model performance [35].
Protocol for High-Level Data Fusion
High-level fusion focuses on combining model outputs rather than raw data or features:
Individual Model Development: Develop separate models for each analytical technique using appropriate algorithms [34]. In the red meat quality study, independent PLS models were built for Raman and infrared spectroscopy data [34].
Prediction Generation: Use each individual model to generate predictions for the samples of interest [34].
Decision Fusion: Apply fusion rules to combine the predictions from individual models. Common approaches include:
Performance Evaluation: Assess the fused model against validation datasets and compare performance with individual techniques and other fusion strategies [34].
Workflow Visualization
Diagram 1: Workflow of Data Fusion Strategies showing the parallel pathways for low-level, mid-level, and high-level fusion approaches in analytical data integration.
The Scientist's Toolkit: Essential Research Reagents and Materials
Table 3: Essential Research Reagents and Solutions for Data Fusion Studies
| Reagent/Equipment | Function in Data Fusion Workflows | Application Examples |
|---|---|---|
| Deuterated Solvents (e.g., D₂O, CD₃OD) | NMR spectroscopy solvent for metabolite profiling and quantification [36] | Sample preparation for NMR analysis in metabolomic studies [36] [23] |
| Derivatization Reagents (e.g., propyl chloroformate) | Chemical modification of compounds to improve volatility and detection in GC-MS [36] | SCFA profiling via propyl esterification method in GC-MS [36] |
| Internal Standards (e.g., caproic acid-6,6,6-d3, TSP-d4) | Quantification reference and quality control for both NMR and MS techniques [36] | Concentration determination in NMR and MS analyses [36] |
| Chromatography Columns | Compound separation before MS detection in LC-HRMS workflows [31] | Metabolite separation in LC-HRMS analysis of hazelnuts [31] |
| Multivariate Analysis Software (e.g., SIMCA, MATLAB) | Statistical analysis and model building for fused datasets [35] | OPLS-DA, PCA-LDA, and PLS-DA modeling in salmon authentication [35] |
The strategic implementation of data fusion approaches—whether low-level, mid-level, or high-level—offers powerful capabilities for enhancing analytical outcomes when combining orthogonal techniques such as LC-HRMS and NMR. The selection of an appropriate fusion strategy depends on multiple factors, including data characteristics, analytical goals, and computational resources.
Mid-level fusion has demonstrated particular effectiveness in authentication studies, achieving perfect classification in salmon origin determination [35], while high-level fusion excelled in specific quantitative applications such as pH prediction in meat quality assessment [34]. Low-level fusion, though conceptually straightforward, requires careful implementation to balance the contributions of different analytical platforms [23].
As the field of metabolomics and pharmaceutical research continues to evolve, data fusion strategies will play an increasingly critical role in extracting maximum information from complementary analytical techniques, ultimately leading to more robust and comprehensive chemical and biological insights.
This guide objectively compares two principal workflow designs in analytical science for orthogonal validation: Sequential Analysis and Instrument Couplication. The comparison is framed within the critical context of validating Liquid Chromatography-High-Resolution Mass Spectrometry (LC-HRMS) findings with Nuclear Magnetic Resonance (NMR) spectroscopy, a cornerstone of rigorous research in drug development and complex matrix analysis.
The core distinction lies in how and when data from the complementary techniques are integrated. Sequential Analysis involves separate, independent experiments with subsequent data correlation, whereas Instrument Coupling involves the direct, automated physical or data-level integration of analytical systems [37] [21].
Core Conceptual Comparison
The following table summarizes the fundamental characteristics of each approach, highlighting their operational and philosophical differences.
| Feature | Sequential Analysis | Instrument Coupling |
|---|---|---|
| Core Principle | Independent experiments; data correlation post-analysis [37]. | Direct physical or data-level integration; automated transfer [21]. |
| Workflow Design | Linear, segmented phases (LC-HRMS then NMR) [37]. | Integrated, concurrent, or tandem operation [21]. |
| Typical Data Flow | Unidirectional, from one completed technique to the next [37]. | Bidirectional or real-time; can inform subsequent analyses [38]. |
| Automation Level | Lower; requires manual intervention and sample handling between steps. | Higher; streamlined, automated workflows reduce manual steps [39]. |
| Primary Application | In-depth, offline structural elucidation and confirmation [14]. | High-throughput analysis, quality control, and biomarker discovery [39] [21]. |
Experimental Protocols and Performance Data
Protocol for Sequential Analysis in Biosimilar Characterization
A detailed study comparing an FDA-approved innovator monoclonal antibody (mAb) product with a non-approved product demonstrates the sequential approach [21].
Methodology:
- Sample Preparation: Multiple lots of mAb drug products (Rituxan and Reditux) were prepared.
- LC-HRMS Analysis (Released Glycans): N-glycans were enzymatically released from the mAbs, labeled with a fluorophore (2-AB), and separated using Hydrophilic Interaction Chromatography (HILIC). Detection and quantification were performed via Fluorescence Detection (FLD) and High-Resolution Mass Spectrometry [21].
- NMR Analysis (Middle-Down): The Fc domain of the mAbs was separated and denatured. A middle-down NMR method was then used to generate monosaccharide fingerprints, providing a quantitative profile of glycan components like galactosylation [21].
- Data Correlation: Results from the independent LC-HRMS and NMR analyses were compared post-hoc to assess glycan distribution and demonstrate product comparability.
Performance Data: The study successfully identified and quantified major glycoforms using both techniques. The table below summarizes the agreement and focus of each method in the sequential workflow for quantifying key glycan attributes [21].
| Analytical Technique | Measured Attribute | Role in Sequential Workflow | Quantitative Agreement |
|---|---|---|---|
| HILIC-FLD | Relative abundance of specific glycan structures (e.g., FA2) | Primary separation and quantification of released glycans. | Strong correlation for major glycoforms between orthogonal methods. |
| LC-HRMS (MAM) | Site-specific glycosylation and other product quality attributes | Detailed characterization of glycopeptides and precise mass confirmation. | |
| Middle-Down NMR | Monosaccharide content (e.g., galactosylation) | Orthogonal validation of monosaccharide-level composition. |
Protocol for Integrated Data Fusion in Metabolomics
A study on classifying Amarone wines based on withering time and yeast strain exemplifies a coupled approach through data fusion, integrating results from separate instrument runs into a unified model [16].
Methodology:
- Parallel Data Generation: 80 Amarone wine samples were analyzed using two untargeted metabolomics platforms:
- LC-HRMS: For broad metabolite profiling.
- ¹H NMR: For complementary quantitative structural data.
- Data Fusion and Integration: The datasets from both techniques were integrated using multi-omics data fusion approaches.
- Unsupervised Exploration: Multiple Co-inertia Analysis (MCIA) was used to explore the combined dataset.
- Supervised Modeling: Sparse Partial Least Squares-Discriminant Analysis (sPLS-DA) was used to build a classification model leveraging the fused LC-HRMS and NMR data [16].
- Validation: The model's predictive accuracy for classifying wines based on their characteristics was evaluated.
- Parallel Data Generation: 80 Amarone wine samples were analyzed using two untargeted metabolomics platforms:
Performance Data: The multi-omics data fusion approach demonstrated a limited correlation (RV-score = 16.4%) between the LC-HRMS and NMR datasets, confirming their complementarity. The fused model achieved a lower classification error rate of 7.52%, providing a much broader characterization of the wine metabolome than either technique could achieve alone [16].
Direct Comparison: Sequential vs. Simultaneous Injection
A foundational chromatography study directly compared sequential and simultaneous injection methods for competitive binding immunoassays, highlighting inherent performance trade-offs [37].
- Methodology: The study compared two methods for injecting a sample and a labeled analyte analog onto an antibody-coated HPLC column:
- Sequential Injection: Sample is injected first, followed by the labeled analog.
- Simultaneous Injection: Sample and labeled analog are applied to the column at the same time [37].
- Performance Data: The results, summarized below, show a clear trade-off between sensitivity and dynamic range [37].
| Injection Method | Lower Limit of Detection & Sensitivity | Dynamic Range & Upper Limit of Detection |
|---|---|---|
| Sequential | Superior - Better lower limit of detection and higher sensitivity. | Narrower |
| Simultaneous | Inferior | Broader - Wider dynamic range and higher upper limit of detection. |
Workflow Visualization
Diagram 1: Sequential Analysis Workflow
Diagram 2: Instrument Coupling & Data Fusion Workflow
The Scientist's Toolkit: Essential Research Reagents & Solutions
The following table details key materials and software solutions critical for implementing the workflows discussed above.
| Tool / Reagent | Function in Workflow | Application Context |
|---|---|---|
| PNGase F Enzyme | Enzymatically releases N-glycans from glycoproteins for subsequent LC-HRMS or HILIC-FLD analysis [21]. | Sequential Analysis of biotherapeutics (mAbs). |
| Fluorophore Labels (2-AB, RapiFluor-MS) | Tags released glycans with a fluorescent group for sensitive detection in HILIC-FLD and improved MS performance [21]. | Sequential Analysis; Glycan quantification. |
| HILIC Column | Separates polar compounds, such as released and labeled glycans, based on hydrophilicity [21]. | Sequential Analysis; Metabolomics. |
| Deuterated NMR Solvents | Provides the locking signal for NMR spectrometers and avoids overwhelming solvent proton signals [14]. | All workflows involving NMR spectroscopy. |
| KNIME / OpenMS | Open-source workflow systems that combine small processing tools into complex, customizable analysis pipelines for LC-MS data [39]. | Automating and integrating data processing in coupled workflows. |
| Compound Discoverer | Software for automated metabolite annotation by matching accurate masses and fragmentation patterns against standard libraries [27]. | Metabolomics data analysis in both sequential and fused workflows. |
The unambiguous identification of metabolites in complex biological mixtures remains a significant challenge in fields ranging from drug development to foodomics. While Liquid Chromatography-High Resolution Mass Spectrometry (LC-HRMS) and Nuclear Magnetic Resonance (NMR) spectroscopy are the two primary analytical platforms used in metabolomics, they are often employed separately, each with distinct advantages and limitations [40] [23]. LC-HRMS offers exceptional sensitivity and can detect hundreds to thousands of metabolites, but it is destructive, suffers from matrix effects like ion suppression, and provides limited structural information for unambiguous identification of unknowns [11] [41]. Conversely, NMR spectroscopy is non-destructive, highly reproducible, inherently quantitative, and provides detailed structural elucidation, including the ability to distinguish between positional isomers and isobaric compounds that are indistinguishable by MS alone [11] [12]. However, NMR's principal drawback is its relatively low sensitivity, often requiring higher metabolite concentrations for detection [40].
The concept of orthogonality is crucial for confident metabolite annotation. Because NMR and MS probe fundamentally different molecular properties—nuclear spin transitions versus mass-to-charge ratios—their datasets provide independent yet complementary information [41]. Statistical Heterospectroscopy (SHY) emerges as a powerful computational framework designed to leverage this orthogonality. It is a statistical paradigm for the co-analysis of multi-spectroscopic datasets acquired on the same set of samples, operating by analyzing the intrinsic covariance between signal intensities from different techniques [42] [43]. By directly correlating NMR chemical shifts and MS m/z data, SHY enhances the confidence of molecular biomarker identification and provides a systems biology tool for understanding pathway activities [42] [12].
SHY in Practice: Core Principles and Comparative Workflow
The SHY Mechanism: From Data Covariance to Biological Insight
The SHY methodology is built on a straightforward but powerful principle: in a cohort of samples, the concentration of an individual metabolite, as measured by its spectral features, will co-vary consistently across different analytical platforms [42] [43]. The workflow begins with the acquisition of NMR and LC-MS data from the same set of samples. Following pre-processing and statistical analysis (such as PCA or OPLS) of each dataset separately, SHY performs a bivariate correlation analysis between all NMR chemical shifts and all MS m/z values [42]. This generates a two-dimensional correlation matrix, often visualized as a heatmap, where correlation coefficients link NMR and MS signals.
- Direct Cross-Correlation: Signals from the same molecule will exhibit strong positive correlations. For instance, in a study of hydrazine-treated rats, the NMR methyl resonance of creatinine showed a strong positive correlation with the MS ion at m/z 114, confirming they originated from the same metabolite [42] [43].
- Biological Connectivities: Beyond simple one-to-one matches, SHY can reveal higher-level biological relationships. Strong negative correlations between the spectral features of different molecules can indicate they belong to connected but opposing pathways, providing insight into metabolic pathway activity and network dynamics in response to a biological stimulus [42].
The following diagram illustrates the logical workflow and relationships within a SHY analysis:
Comparative Analysis: SHY vs. Standalone and Other Combined Approaches
To objectively evaluate SHY's performance, it must be compared to using each technique in isolation and to other strategies for combining NMR and MS.
Table 1: Comparative performance of metabolite identification strategies
| Analytical Strategy | Key Strengths | Principal Limitations | Ideal Application Context |
|---|---|---|---|
| LC-HRMS Alone | High sensitivity (fmol); broad metabolite coverage; high-throughput [11] [41]. | Cannot distinguish isomers; suffers from ion suppression; identification requires authentic standards [11]. | Initial untargeted screening for biomarker discovery in large cohorts. |
| NMR Alone | Highly reproducible & quantitative; distinguishes isomers; non-destructive; minimal sample prep [40] [41]. | Low sensitivity (μM); limited dynamic range; signal overlap in complex mixtures [40] [12]. | Structural elucidation, absolute quantification, analysis of abundant metabolites. |
| Sequential NMR & MS | Provides two independent data points; can confirm identities with purified compounds. | Data are not intrinsically correlated; risk of sample degradation between analyses; time-consuming. | Confirmation of a limited number of key biomarkers after initial discovery. |
| Online LC-MS-NMR | Fully automated, single-run analysis; minimizes sample handling [11]. | Compromised sensitivity due to solvent issues; requires deuterated solvents; NMR acquisition speed is a bottleneck [11]. | Analysis of simple mixtures with a few, highly concentrated analytes. |
| SHY (Statistical Fusion) | Correlates data intrinsically; recovers latent biological relationships; improves annotation confidence without full purification [42] [12]. | Requires careful experimental design and statistical skill; dependent on quality of input data. | Systems-level analysis where understanding pathway connectivity is as important as identifying individual biomarkers. |
The unique value proposition of SHY is its ability to move beyond simple, sequential use of NMR and MS. While a sequential approach might use NMR to confirm a structure tentatively identified by MS, SHY proactively uses the statistical covariance across a full sample set to link features from both platforms, thereby increasing the efficiency and confidence of biomarker recovery and providing a more holistic view of the metabolome [42] [41].
Experimental Protocols and Supporting Data
A Detailed Workflow for SHY Analysis
The application of SHY requires a methodical approach from sample preparation to data interpretation. The following protocol, synthesizing common elements from several studies, provides a reproducible template for implementation [42] [12] [41].
Sample Preparation & Cohort Design:
- Prepare a set of biological samples (e.g., urine, plasma, plant extract, food commodity) representing the different groups under study (e.g., control vs. treated, different origins).
- For table olives analysis, samples were homogenized and extracted with a methanol-water mixture to obtain a representative metabolite profile [12].
- Split each sample aliquot for parallel NMR and LC-MS analysis to ensure analytical consistency.
Instrumental Analysis:
- NMR Spectroscopy: Acquire 1D ¹H NMR spectra on a high-field spectrometer (e.g., 600 MHz). Suppress the water signal using pre-saturation. Typically, 64-128 scans are collected per sample [12] [41].
- LC-HRMS/MS: Perform reversed-phase UPLC separation. Use a high-resolution mass spectrometer (e.g., TOF or Orbitrap) capable of accurate mass measurement. Data should be acquired in both positive and negative ionization modes to maximize coverage. Include data-dependent MS/MS scans to gather fragmentation data [12].
Data Pre-processing:
- NMR Data: Process FIDs (Fourier Transform, phase correction, baseline correction). Chemically shift reference the spectra (e.g., to TSP at δ 0.0 ppm). Segment the spectra into bins (e.g., δ 0.01-0.04 ppm) and integrate the area under the curve to create a data matrix [41].
- LC-MS Data: Perform peak picking, alignment, and deconvolution using software like XCMS or MS-DIAL. Generate a data matrix containing peak areas, accurate mass, and retention time for each feature.
Statistical Analysis & SHY Implementation:
- Subject each individual dataset (NMR and MS) to multivariate statistical analysis (e.g., PCA, OPLS-DA) to identify significant spectral features responsible for group separation.
- Input the significant NMR and MS variables into the SHY algorithm. Calculate pairwise correlation coefficients (e.g., Pearson's) between all NMR chemical shifts and MS m/z values across the sample cohort.
- Apply a confidence level cutoff (e.g., 99.9%) to filter out spurious correlations [43].
Metabolite Annotation & Interpretation:
- Identify metabolites by matching strongly correlated NMR and MS signals to databases. For example, a correlated NMR doublet (e.g., δ 1.33) and MS ion (e.g., m/z 147.0766) can be assigned to lactate [42].
- Use the correlation matrix, including anti-correlations, to infer activity in interconnected biochemical pathways.
Key Research Reagent Solutions
Successful execution of a SHY-based study relies on specific materials and software tools.
Table 2: Essential research reagents and tools for SHY analysis
| Item | Function / Role in SHY Analysis | Example / Specification |
|---|---|---|
| High-Field NMR Spectrometer | Provides high-resolution ¹H NMR data for structural elucidation and quantification. | 500 MHz or higher (e.g., 600 MHz) with a cryoprobe for enhanced sensitivity [40] [11]. |
| UPLC-HRMS System | Separates complex mixtures and provides accurate mass & MS/MS data for metabolite identification. | Q-TOF or Orbitrap mass analyzer for high mass accuracy (< 5 ppm) [12]. |
| Deuterated Solvents | Used for NMR spectroscopy to minimize solvent signal interference. Also used in LC mobile phase for online LC-NMR-MS. | D₂O, CD₃OD; for full online hyphenation, deuterated acetonitrile (CD₃CN) is recommended [11]. |
| Internal Standards | For chemical shift referencing in NMR and quality control in MS. | TSP (sodium trimethylsilylpropanesulfonate) for NMR, stable isotope-labeled standards for MS. |
| Metabolomic Databases | Essential for annotating NMR chemical shifts and MS/MS fragmentation patterns. | Human Metabolome Database (HMDB), BMRB, Golm Metabolome Database, MassBank [44] [41]. |
| Statistical Software | For multivariate analysis (PCA, OPLS) and calculation of correlation matrices. | SIMCA, MATLAB, or R packages (e.g., stats, mixOmics). |
Implementation and Broader Integration
Data Fusion Strategies in Modern Metabolomics
SHY represents one approach within a broader framework known as Data Fusion (DF), which aims to integrate multiple data blocks to extract more information than is possible from a single source [23]. DF strategies are typically categorized by the level of data abstraction:
- Low-Level Fusion: The most straightforward approach, where pre-processed raw data matrices from NMR and MS are simply concatenated into a single large matrix before statistical analysis. This requires careful scaling to equalize the contributions from each platform [23].
- Mid-Level Fusion: Involves reducing the dimensionality of each dataset first (e.g., by extracting principal components from the NMR data and MS data separately), followed by concatenation of the resulting scores for final modeling. This helps overcome the "large p, small n" problem common in metabolomics [23].
- High-Level Fusion: Combines the results or decisions from models built on each dataset independently (e.g., through majority voting or meta-classification). This is the most complex but also the most flexible approach when dealing with highly heterogeneous data [23].
SHY is conceptually aligned with mid-level fusion, as it operates on extracted features (chemical shifts and m/z values) to build a new, integrated correlation model.
Overcoming Technical and Analytical Hurdles
Implementing a combined NMR-MS strategy, including SHY, involves navigating several practical challenges. The primary hurdle is the inherent difference in sensitivity, which can be mitigated by using cryoprobes or microcoil probes for NMR to improve signal-to-noise [11]. Solvent compatibility is another key concern, particularly for online systems; the use of deuterated solvents is ideal for NMR but costly, and the deuterium isotope effect can cause slight retention time shifts in LC [11]. Finally, the complexity of data handling necessitates robust bioinformatics pipelines and a solid understanding of statistics to properly manage, pre-process, and correlate the large, multi-platform datasets generated [23] [12].
Statistical Heterospectroscopy represents a powerful paradigm shift in the analysis of complex metabolomic data. By moving beyond the sequential or parallel use of NMR and MS, SHY leverages the intrinsic orthogonality of these platforms to intrinsically correlate data, thereby significantly improving the confidence of metabolite annotation. The methodology allows researchers to not only identify biomarkers with greater efficiency but also to uncover latent biological relationships and pathway connectivities that are invisible to each technique alone [42] [12]. As the metabolomics field continues to mature, the drive for comprehensive and unambiguous metabolome coverage will make integrated approaches like SHY and other data fusion strategies not just advantageous, but essential. For drug development professionals and researchers, adopting such frameworks is key to transforming raw spectral data into profound biological insight, ultimately strengthening conclusions drawn from orthogonal LC-HRMS and NMR research.
Impurity and degradant profiling is a critical discipline in pharmaceutical development, essential for ensuring the safety, efficacy, and quality of drug products. These profiles provide a comprehensive description of identified and unidentified impurities present in new drug substances and products, forming a foundation for regulatory submissions and quality control strategies [45]. The process involves the detection, identification, and quantification of organic impurities that may arise during synthesis, manufacturing, or storage, including starting materials, by-products, intermediates, and degradation products [46].
The International Council for Harmonisation (ICH) guidelines establish rigorous thresholds for reporting, identifying, and qualifying impurities based on the maximum daily dose and potential toxicity [45]. Forced degradation studies, conducted under conditions more severe than accelerated stability testing, are instrumental in revealing the intrinsic stability of drug molecules and facilitating the development of stability-indicating analytical methods [47]. These studies help identify possible degradants, elucidate degradation pathways, and provide critical information for formulation development, packaging selection, and shelf-life determination [48].
This case study examines the integrated application of advanced analytical technologies, particularly the orthogonal validation of Liquid Chromatography-High-Resolution Mass Spectrometry (LC-HRMS) findings with Nuclear Magnetic Resonance (NMR) research. Through specific examples from recent pharmaceutical development programs, we demonstrate how this multi-technique approach delivers comprehensive molecular characterization that no single method can provide alone, ultimately strengthening regulatory submissions and ensuring patient safety.
Analytical Techniques for Impurity and Degradant Profiling
Technique Comparison and Orthogonal Verification
Modern impurity profiling employs a suite of complementary analytical techniques, each providing unique information about impurity structure and quantity. Table 1 summarizes the primary techniques and their specific applications in impurity characterization.
Table 1: Analytical Techniques for Impurity and Degradant Profiling
| Technique | Primary Application | Key Information Provided | Detection Limits |
|---|---|---|---|
| LC-HRMS | Identification and characterization of degradation products [49] | Accurate mass measurements, elemental composition, fragmentation patterns [49] | High sensitivity (trace level detection) |
| NMR Spectroscopy | Structural elucidation of major degradation products [49] | Atomic connectivity, stereochemistry, molecular conformation [10] | Typically requires microgram quantities |
| GC-MS | Analysis of volatile degradation products [49] | Molecular weight, structural information for volatile compounds | High sensitivity for volatile compounds |
| HILIC-FLD | Glycan analysis in biologics [10] | Separation and quantification of hydrophilic compounds | High sensitivity for fluorescently-labeled compounds |
| UPLC/UHPLC | High-resolution separation of trace impurities [45] | Enhanced resolution and speed for complex mixtures | Superior to conventional HPLC |
The power of orthogonal validation lies in combining these techniques to overcome individual limitations. For instance, while LC-HRMS provides exceptional sensitivity and mass accuracy for identifying potential degradants, NMR offers definitive structural proof through direct atomic-level observation [49] [10]. This complementary relationship was demonstrated in a recent study of lumateperone tosylate, where LC-HRMS proposed structures for eleven degradation products, and NMR definitively characterized DP-2 as a colored quinone derivative [49].
Experimental Protocols for Comprehensive Profiling
Forced Degradation Study Protocol
Forced degradation experiments are designed to generate representative degradation products under controlled stress conditions. A typical protocol includes:
- Sample Preparation: Prepare drug substance and drug product solutions at appropriate concentrations (typically 0.1-1.0 mg/mL) in suitable solvents [47].
- Stress Conditions:
- Acidic/Basic Hydrolysis: Treat with 0.1-5M HCl or NaOH at room temperature or elevated temperatures (e.g., 40-80°C) for several hours to days [49] [50]
- Oxidative Stress: Expose to 0.1-3% hydrogen peroxide at neutral pH and room temperature for up to 7 days or until approximately 5-20% degradation [49] [47]
- Thermal Stress: Store solid drug substance and drug product at elevated temperatures (e.g., 50-80°C) [47]
- Photolytic Stress: Expose to UV and visible light per ICH Q1B guidelines [50]
- Termination and Analysis: Quench reactions at appropriate time points and analyze using chromatographic methods [47].
The experimental workflow for a comprehensive forced degradation study integrates both in silico prediction and analytical verification, as illustrated in Diagram 1: Forced Degradation Study Workflow.
LC-HRMS Analysis Protocol
Liquid Chromatography-High Resolution Mass Spectrometry has become the cornerstone technique for impurity identification due to its exceptional sensitivity and specificity.
- Instrumentation: Q-Exactive hybrid quadrupole-Orbitrap mass spectrometer or equivalent high-resolution system [10]
- Chromatographic Conditions:
- Mass Spectrometry Parameters:
- Ionization: Electrospray ionization (ESI) in positive or negative mode
- Resolution: >100,000 full width at half maximum (FWHM)
- Mass Range: 100-1500 m/z
- Fragmentation: Data-dependent MS/MS acquisition for structural elucidation [10]
NMR Structural Elucidation Protocol
Nuclear Magnetic Resonance spectroscopy provides definitive structural confirmation for major degradation products.
- Sample Preparation: Isolate sufficient quantity of degradation product (typically 0.1-1.0 mg) and dissolve in appropriate deuterated solvent (e.g., DMSO-d6, CDCl3) [49]
- Experiment Types:
- 1D NMR: ^1H NMR, ^13C NMR, DEPT experiments
- 2D NMR: COSY, HSQC, HMBC, NOESY for complex structural elucidation [10]
- Data Acquisition:
- Temperature: 25°C
- Field Strength: 500 MHz or higher for improved resolution
- Processing: Apply appropriate window functions and zero-filling before Fourier transformation [10]
Case Study: Orthogonal Validation of LC-HRMS with NMR
Lumateperone Tosylate Degradation Profiling
A recent comprehensive forced degradation study of lumateperone tosylate demonstrates the power of orthogonal validation. The study aimed to identify and characterize degradation products under various stress conditions to support formulation development and quality control [49].
Experimental Design and Conditions: Stress conditions included oxidative (3% H₂O₂), acidic (0.1M HCl), alkaline (0.1M NaOH), and photolytic exposure. The degradation samples were analyzed using LC-HRMS to separate and initially characterize eleven degradation products (DP-1 to DP-11). A stability-indicating method was developed and validated per ICH Q2(R1) guidelines, demonstrating excellent linearity (r² > 0.999), accuracy, precision, specificity, and robustness [49].
Key Findings and Orthogonal Validation:
- DP-2 Characterization: LC-HRMS data suggested DP-2 was a quinone derivative formed under oxidative stress. This was conclusively confirmed through NMR analysis, which provided definitive evidence of the quinone structure through characteristic chemical shifts and coupling patterns [49].
- DP-7 Identification: Under alkaline conditions, a volatile degradation product (DP-7) was detected. While LC-HRMS provided limited information, GC-MS analysis definitively identified it as 1-(4-fluorophenyl)ethanol, demonstrating the value of technique matching to analyte properties [49].
- Acidic Degradation Products: Acidic hydrolysis in hydrochloric acid produced unexpected dimer (DP-9) and chlorinated positional isomers (DP-10, DP-11) of lumateperone. Their structures were proposed by LC-HRMS and confirmed through synthetic standards and NMR studies [49].
The relationship between analytical techniques and their specific contributions to impurity characterization is visualized in Diagram 2: Orthogonal Technique Integration.
Ubrogepant Degradation Impurity Characterization
Another compelling case of orthogonal validation comes from degradation studies of ubrogepant, a migraine treatment. The forced degradation study followed ICH Q1A and Q1B guidelines, revealing eight degradation impurities under acidic, basic, and oxidative conditions [50].
Methodology and Results: The degradation products were separated using reversed-phase HPLC with a gradient program on an InertSustain C8 column. Initial structural characterization of all impurities was performed using HRMS/MS, which provided exact masses and fragmentation patterns. Two major degradation impurities (UB-4 and UB-7) were isolated for further NMR studies, which confirmed the structures proposed by HRMS and provided additional stereochemical information [50].
In Silico Integration: The study incorporated Zeneth software for in silico prediction of ubrogepant's degradation profile, which helped guide experimental work. Additionally, in silico toxicity assessment was performed using DEREK Nexus, SARAH Nexus, and ProTox-II, creating a comprehensive safety profile of the degradation impurities [50].
Comparative Performance of Analytical Approaches
Technique-Specific Advantages and Limitations
Table 2 provides a systematic comparison of the performance characteristics of different analytical techniques when applied to impurity and degradant profiling.
Table 2: Performance Comparison of Analytical Techniques in Impurity Profiling
| Performance Characteristic | LC-HRMS | NMR | GC-MS | HILIC-FLD |
|---|---|---|---|---|
| Structural Elucidation Power | High (with MS/MS) | Very High | Medium | Low |
| Sensitivity | Very High (ng-pg) | Low (μg-mg) | High (pg) | High (ng-pg) |
| Quantitation Capability | Excellent | Good | Excellent | Excellent |
| Throughput | High | Low | Medium | High |
| Sample Preparation Complexity | Medium | High | Medium-High | High |
| Molecular Information Provided | Molecular mass, formula, fragmentation | Atomic connectivity, stereochemistry | Molecular mass, structure of volatiles | Hydrophilicity, relative abundance |
| Complementary Role in Orthogonal Validation | Initial detection and characterization | Definitive structural confirmation | Volatile impurity analysis | Polar compound separation |
Biosimilar Characterization Case Study
A comparative study of rituximab products further demonstrates the importance of orthogonal methods in biologics characterization. The study employed multiple analytical techniques including HILIC-FLD, multi-attribute method (MAM) LC-MS, intact mass LC-MS, and middle-down NMR to characterize glycan distributions [10].
Key Findings:
- All major glycoforms were consistently identified across HRMS, NMR, and HILIC-FLD methods, building confidence in the results through orthogonal verification [10].
- Each technique provided unique advantages: HRMS offered high precision, NMR provided monosaccharide fingerprints without extensive sample preparation, and HILIC-FLD represented the conventional standardized approach [10].
- The combination of methods created a comprehensive characterization toolbox that could be tailored based on specific product needs and analysis requirements [10].
The Scientist's Toolkit: Essential Research Reagent Solutions
Successful impurity and degradant profiling requires carefully selected reagents and materials. Table 3 catalogues key research reagent solutions and their specific functions in analytical workflows.
Table 3: Essential Research Reagents and Materials for Impurity Profiling
| Reagent/Material | Function | Application Examples |
|---|---|---|
| Ammonium Formate | Mobile phase buffer for LC-MS | Provides volatile buffer for mass spectrometry compatibility [50] |
| Acetonitrile (HPLC Grade) | Organic mobile phase component | Reversed-phase chromatography for impurity separation [50] |
| Deuterated Solvents (DMSO-d6, CDCl3) | NMR solvent | Maintains field frequency lock for NMR experiments [49] |
| Hydrogen Peroxide | Oxidative stress agent | Forced degradation studies to simulate oxidative conditions [49] |
| Acid/Base Solutions (HCl, NaOH) | Hydrolytic stress agents | Forced degradation under acidic and basic conditions [49] |
| PNGase F | Glycan release enzyme | Cleaves N-glycans from therapeutic proteins for analysis [10] |
| 2-AB Labeling Reagent | Fluorescent glycan tag | Enables detection and quantification of glycans in HILIC-FLD [10] |
| RapiFluor-MS Reagent | MS-compatible glycan tag | Reduces sample preparation time and improves MS performance [10] |
| Trypsin | Proteolytic enzyme | Digests proteins for glycopeptide analysis in MAM [10] |
| Dithiothreitol (DTT) | Reducing agent | Reduces disulfide bonds in protein samples [10] |
Regulatory Considerations and Compliance
Pharmaceutical impurity profiling operates within a rigorous regulatory framework designed to ensure patient safety. The ICH guidelines Q3A (for drug substances) and Q3B (for drug products) establish thresholds for reporting, identification, and qualification of impurities based on maximum daily dose [45]. These guidelines categorize impurities as organic impurities (process and drug-related), inorganic impurities, and residual solvents [46].
Forced degradation studies provide critical data to support regulatory submissions, including Investigational New Drug (IND) applications and New Drug Applications (NDA) [47]. Regulatory guidances indicate that forced degradation studies are typically carried out using one batch of material under conditions more severe than accelerated stability testing [47]. From a regulatory perspective, these studies must demonstrate that analytical methods can adequately separate and quantify degradation products, proving their stability-indicating capability [47].
The integration of in silico prediction tools like Zeneth and CAMEO supports regulatory compliance by providing scientific justification for selected stress conditions and helping to identify potential degradation pathways early in development [47] [48]. These tools can predict degradation products under various stress conditions, allowing for more targeted and efficient experimental studies [47].
Orthogonal validation of LC-HRMS findings with NMR research represents the current gold standard in impurity and degradant profiling for pharmaceutical development. The case studies presented demonstrate that while LC-HRMS provides unparalleled sensitivity and initial structural characterization, NMR delivers definitive structural confirmation through direct atomic-level observation. This multi-technique approach builds a comprehensive understanding of drug substance stability and degradation pathways, ultimately supporting robust regulatory submissions and ensuring product quality throughout the shelf life.
The integration of in silico prediction tools further enhances this experimental workflow, enabling more targeted and efficient studies. As pharmaceutical compounds continue to increase in complexity, particularly with the growth of biologic therapeutics, the strategic combination of orthogonal analytical techniques will remain essential for comprehensive characterization. Future directions will likely see increased automation and data integration across these platforms, further strengthening the scientific foundation for impurity control strategies in pharmaceutical development.
In an era of globalized food supply chains, verifying the geographical and botanical authenticity of food products is a critical challenge for ensuring safety, quality, and compliance with labeling regulations. Foodomics, a discipline that applies advanced omics technologies to food science, has emerged as a powerful solution [51] [52]. This field leverages techniques like metabolomics, proteomics, and genomics to comprehensively analyze food composition. A particularly robust approach involves the orthogonal validation of data from different analytical platforms, such as combining Liquid Chromatography-High Resolution Mass Spectrometry (LC-HRMS) with Nuclear Magnetic Resonance (NMR) spectroscopy [11] [16]. This case study explores how this integrated methodology is applied to authenticate food origin and type, with a specific focus on honey, olive oil, and wine, while detailing the experimental protocols and reagent solutions that underpin this cutting-edge research.
Analytical Techniques for Authentication
The authentication of food origin and type relies on detecting unique chemical fingerprints that are influenced by the local environment (soil, climate) and botanical source. The table below compares the primary analytical techniques used in foodomics for this purpose.
Table 1: Key Analytical Techniques in Foodomics Authentication
| Technique | Measured Analytes | Key Strengths | Key Limitations | Representative Applications |
|---|---|---|---|---|
| ICP-MS [53] [54] | Trace elements (Li, Mg, Mn, Co, Cu, Sr, Ba, Pb) and Rare Earth Elements (REEs) | High sensitivity for trace/ultra-trace elements; multi-element capability; REEs are reliable geographical markers [53]. | Requires sample digestion; does not characterize organic molecules. | Geographical authentication of honey [53] [55] and other agri-food products [54]. |
| LC-HRMS [11] [10] | Organic compounds (e.g., phenolic compounds, volatiles, glycans) | High sensitivity and selectivity; provides exact mass for elemental composition; capable of untargeted profiling [11]. | Can suffer from matrix effects; requires authentic standards for definitive identification [11]. | Botanical discrimination of honey [53]; wine metabolome characterization [16]. |
| NMR [11] [56] | Structural information on organic compounds (e.g., sugars, amino acids, fatty acids) | Provides definitive structural information; intrinsically quantitative and non-destructive; highly reproducible [11]. | Inherently low sensitivity compared to MS; requires longer acquisition times [11]. | Detecting olive oil adulteration [56]; wine classification [16]. |
| IRMS [54] [55] | Stable isotope ratios (e.g., H, C, N, O, S) | Powerful for geographical discrimination; isotopes reflect local water, climate, and soil conditions. | Requires specialized instrumentation and data banks of genuine samples for comparison. | Geographical origin assessment of honey [55] and other products like wine and meat [54]. |
Experimental Protocols for Orthogonal Authentication
A robust authentication workflow involves multiple steps, from sample preparation to data analysis. The following protocols are synthesized from methodologies used in honey and wine authentication studies.
Sample Preparation and Analysis
Protocol 1: Elemental Metabolomics via ICP-MS for Geographical Authentication (e.g., Honey) This protocol is adapted from studies achieving over 95% prediction accuracy for geographical origin [53].
- Sample Digestion: A representative portion of honey (e.g., 0.5 g) is weighed into a digestion vessel. Suprapur nitric acid (65%) and suprapur hydrogen peroxide (30%) are added. The mixture is subjected to microwave-assisted digestion to completely dissolve the organic matrix and liberate elemental components.
- Dilution and Internal Standardization: The digested sample is diluted to a known volume with ultra-pure water (18.2 MΩ·cm resistivity). Germanium (Ge) and Indium (In) are typically used as internal standards and added to correct for instrument drift and matrix effects.
- ICP-MS Analysis: The diluted sample is introduced into the Inductively Coupled Plasma Mass Spectrometer (ICP-MS). The instrument is calibrated using a certified multi-element standard solution for trace elements and a rare earth elements (REE) standard.
- Data Acquisition: The concentrations of a panel of elements, including trace elements (Li, Mg, Mn, Ni, Co, Cu, Sr, Ba, Pb) and REEs (Y, La, Ce, Pr, Nd, Sm, Eu, Gd, Tb, Dy, Ho, Er, Tm, Yb, Lu), are quantified [53].
Protocol 2: Orthogonal LC-HRMS and NMR for Botanical and Processing Authentication (e.g., Wine) This protocol is based on a study classifying wines based on grape withering time and yeast strain [16].
- Sample Preparation:
- For LC-HRMS: A volume of wine is filtered and often diluted with a solvent compatible with the LC mobile phase (e.g., water/methanol). No derivatization is needed for untargeted profiling.
- For NMR: A portion of wine is mixed with a deuterated phosphate buffer solution (pH 7.4). To suppress the water signal, a standard water suppression pulse sequence is used. The addition of a known concentration of an internal standard (e.g., TSP-d4, Sodium 3-trimethylsilylpropionate) is necessary for quantitative analysis.
- LC-HRMS Analysis:
- Chromatography: The sample is separated using a reversed-phase U/HPLC system.
- Mass Spectrometry: The eluent is analyzed with a high-resolution mass spectrometer (e.g., Orbitrap, Q-TOF) equipped with an electrospray ionization (ESI) source. Data is acquired in both positive and negative ionization modes for comprehensive coverage.
- NMR Analysis: The prepared sample is transferred to an NMR tube and placed in the spectrometer. 1H NMR spectra are acquired at a specified temperature (e.g., 300 K). For more detailed structural information, 2D NMR experiments (e.g., COSY, HSQC) may be performed, though these require significantly longer acquisition times [11].
- Data Fusion and Chemometrics: The datasets from LC-HRMS and NMR are integrated. Multi-block statistical techniques, such as Multiple Co-inertia Analysis (MCIA) or sparse Partial Least Squares-Discriminant Analysis (sPLS-DA), are applied to the fused data to identify patterns and key markers responsible for sample classification [16].
Workflow Visualization
The following diagram illustrates the logical workflow for orthogonal authentication using the protocols described above.
Case Study Data & The Scientist's Toolkit
The table below summarizes quantitative results from key studies that successfully employed foodomics strategies for authentication, highlighting the performance of different techniques and models.
Table 2: Performance Data from Foodomics Authentication Studies
| Food Product | Analytical Technique | Chemometric Model | Classification Purpose | Performance Outcome | Key Discriminatory Markers |
|---|---|---|---|---|---|
| Honey [53] | ICP-MS | Probabilistic Neural Network (PNN) | Geographical Origin | 85.3% Correct Classification | Rare Earth Elements (REEs: Y, La, Ce, etc.), Trace elements (Li, Mg, Mn, etc.) [53] |
| Honey [53] | ICP-MS | Partial Least Squares (PLS) | Geographical Origin | >95% Prediction Accuracy | Rare Earth Elements (REEs) and Trace Elements [53] |
| Honey [53] | ICP-MS | Discriminant Analysis (DA) | Botanical Type | Successful Classification | Elemental Profile [53] |
| Amarone Wine [16] | LC-HRMS & 1H NMR (Fused Data) | sPLS-DA | Withering Time & Yeast Strain | Lower Error Rate (7.52%) | Amino acids, monosaccharides, polyphenolic compounds |
| Olive Oil [56] | Gas Chromatography | PLS | Botanical & Geographical Origin | Reliable Classification | Volatile organic compounds |
The Scientist's Toolkit: Essential Research Reagents & Materials
Successful implementation of these authentication protocols requires specific, high-quality reagents and materials.
Table 3: Essential Research Reagent Solutions for Foodomics Authentication
| Item | Function / Role | Specific Example / Note |
|---|---|---|
| Suprapur Acids & Solvents [53] | Sample digestion and preparation for ICP-MS. | High-purity nitric acid (65%) and hydrogen peroxide (30%) are essential to minimize background contamination and ensure accurate quantification of trace elements. |
| Certified Reference Materials [53] | Calibration and quality control for elemental and isotopic analysis. | Certified multi-element standard solutions and stable isotope standards are used to calibrate ICP-MS and IRMS instruments, ensuring data accuracy and traceability. |
| Deuterated Solvents [11] | Solvent for NMR spectroscopy. | Deuterium oxide (D₂O) is commonly used for aqueous samples. While costly, deuterated acetonitrile may be used for LC-NMR mobile phases to reduce solvent signal interference. |
| Internal Standards [53] [10] | Correction for instrument variability and sample preparation losses. | Germanium (Ge) and Indium (In) for ICP-MS; TSP-d4 (Sodium 3-trimethylsilylpropionate) for quantitative NMR. |
| SPME Fibers [56] | Extraction and concentration of volatile compounds for GC-MS analysis. | Used in profiling the volatile fraction of products like olive oil for botanical and geographical discrimination. |
| PNGase F Enzyme [10] | Release of N-glycans from glycoproteins. | Critical for glycan analysis of therapeutic proteins like monoclonal antibodies, a key quality attribute. |
| Fluorescent Labels (2-AB) [10] | Tagging released glycans for sensitive detection in HILIC-FLD analysis. | 2-aminobenzamide (2-AB) is a common fluorophore for labeling and quantifying glycans. |
The integration of orthogonal analytical techniques, particularly the combination of LC-HRMS and NMR within the foodomics framework, provides an unparalleled strategy for geographical and botanical authentication. As demonstrated, ICP-MS offers exceptional sensitivity for elemental fingerprints tied to geography, while LC-HRMS and NMR deliver complementary data on the complex organic profile influenced by both botany and processing. The synergy of these techniques, powered by advanced chemometrics, creates a robust validation system that overcomes the limitations of any single method. This multi-omics approach is poised to become the gold standard for ensuring food authenticity, protecting consumers from fraud, and guaranteeing that the unique properties of high-value foods are verifiable from field to table.
Personalized metabolic profiling has emerged as a transformative approach in clinical research and drug development, enabling precise characterization of individual metabolic phenotypes that influence disease progression and therapeutic response. Metabolomics, the comprehensive study of small molecule metabolites, provides a direct readout of cellular activity and physiological status by capturing the dynamic interplay between genetics, environment, and lifestyle [30]. This case study examines the complementary analytical frameworks of liquid chromatography-high-resolution mass spectrometry (LC-HRMS) and nuclear magnetic resonance (NMR) spectroscopy for generating personalized metabolic profiles, with particular emphasis on orthogonal validation strategies that enhance data reliability for clinical decision-making.
The fundamental premise of personalized metabolic profiling lies in its capacity to identify metabolic signatures that can stratify patient populations, predict treatment outcomes, and illuminate disease mechanisms. As noted in exposome research, mass spectrometry-based methods have become fundamental to this field, "providing the capability to explore a broad spectrum of chemical exposures" [30]. The integration of these advanced analytical techniques creates a powerful framework for precision medicine, particularly in domains like pharmacometabolomics, which "aims to improve medication therapy by providing a better knowledge of how a person's unique metabolic profile influences how he or she will respond to pharmaceuticals" [57].
Comparative Analysis of LC-HRMS and NMR Platforms
The selection of appropriate analytical platforms is critical for generating robust metabolic profiles in clinical research. LC-HRMS and NMR represent two complementary technologies with distinct strengths and limitations that must be carefully considered in experimental design.
Table 1: Technical Comparison of LC-HRMS and NMR Platforms
| Parameter | LC-HRMS | NMR Spectroscopy |
|---|---|---|
| Sensitivity | High (pM-nM range) | Moderate (μM-mM range) |
| Sample Throughput | Moderate to high | High |
| Sample Preparation | Extensive (extraction, derivation) | Minimal (buffer addition) |
| Reproducibility | Moderate (requires careful normalization) | High |
| Destructive Nature | Destructive | Non-destructive |
| Metabolite Coverage | Broad (100s-1000s of features) | Limited (10s-100s of features) |
| Quantitative Capability | Relative quantification (absolute with standards) | Absolute quantification |
| Structural Elucidation | Requires MS/MS fragmentation | Direct structural information |
Liquid Chromatography-High Resolution Mass Spectrometry (LC-HRMS)
LC-HRMS has become a cornerstone technology in metabolomics due to its exceptional sensitivity and broad metabolite coverage. This platform combines the separation power of liquid chromatography with the precise mass measurement capabilities of high-resolution mass spectrometers, enabling detection of hundreds to thousands of metabolites in complex biological samples [30] [27]. The typical workflow involves sample extraction, chromatographic separation, ionization (typically electrospray ionization), and mass analysis with accuracy <5 ppm, allowing confident metabolite identification.
Recent advances in LC-HRMS have significantly enhanced its utility for personalized metabolic profiling. As described in studies of pregnancy loss and gestational diabetes, untargeted LC-HRMS approaches can identify subtle metabolic alterations associated with clinical conditions, revealing potential diagnostic biomarkers with high predictive power [58] [59]. For example, in one pregnancy loss study, "key metabolites, such as testosterone glucuronide, 6-hydroxymelatonin, and (S)-leucic acid, exhibited strong diagnostic potential, with AUC values of 0.991, 0.936 and 0.952, respectively" [58]. This demonstrates the clinical relevance of metabolic signatures detected by LC-HRMS.
Nuclear Magnetic Resonance (NMR) Spectroscopy
NMR spectroscopy offers a complementary approach to mass spectrometry-based metabolomics, with particular strengths in structural elucidation and quantitative accuracy. As noted in milk metabolomics research, "one of the main advantages of NMR spectroscopy is its non-destructive nature, allowing for repeated measurements on the same sample over time" [60]. This characteristic makes NMR particularly valuable for longitudinal studies and when sample preservation is important.
The quantitative capabilities of NMR stem from the direct proportionality between metabolite concentration and signal intensity, requiring minimal calibration [60]. This inherent quantitation is particularly valuable for absolute quantification of metabolites in complex biological mixtures. Additionally, NMR requires minimal sample preparation, reducing introduction of analytical variability and making it suitable for high-throughput clinical applications.
Orthogonal Validation: Integrating LC-HRMS and NMR Findings
Orthogonal validation represents a critical methodology in personalized metabolic profiling, where findings from one analytical platform are verified using another technically distinct method. This approach significantly enhances the confidence in metabolic biomarkers proposed for clinical applications.
Conceptual Framework for Orthogonal Validation
The fundamental principle underlying orthogonal validation is that consistent results from analytically independent techniques provide compelling evidence for biological significance rather than methodological artifact. LC-HRMS and NMR are particularly well-suited for this complementary approach due to their fundamentally different detection principles - mass analysis versus magnetic nuclear properties.
In practice, orthogonal validation follows a systematic process where differential metabolites identified through initial LC-HRMS screening are subsequently verified using NMR spectroscopy. This approach leverages the broad screening capability of LC-HRMS with the structural confirmation and precise quantification of NMR. The exposome research highlights that "comprehensive exposomics integrates analysis of endogenous and xenobiotic compounds" [30], which benefits greatly from this multi-platform strategy.
Experimental Design for Orthogonal Validation
Implementing a robust orthogonal validation workflow requires careful experimental planning:
Discovery Phase: Untargeted LC-HRMS analysis identifies metabolite features differentially abundant between clinical groups using criteria such as variable importance in projection (VIP) >1.0 and p-value <0.05 [58] [59].
Priority Ranking: Significant metabolites are prioritized based on magnitude of fold-change, statistical significance, and biological relevance to the clinical phenotype.
Verification Phase: Targeted NMR analysis confirms the identity and concentration changes of prioritized metabolites using standard addition or quantitative NMR methods.
Integration: Concordant results from both platforms provide high-confidence biomarkers, while discordant findings trigger further investigation into potential analytical artifacts or platform-specific limitations.
This integrated approach was exemplified in a study of type 2 diabetes medications, where "mean VLDL size, HDL size, and concentrations of large and very large HDL molecules differed between insulin-only and metformin-only users" [61]. Such metabolic differences, validated through orthogonal methods, provide insights into mechanisms underlying varied therapeutic responses.
Experimental Protocols and Methodologies
LC-HRMS Protocol for Plasma Metabolomics
The following protocol, adapted from multiple clinical metabolomics studies [58] [59], outlines a standardized approach for plasma analysis:
Sample Preparation:
- Collect blood in EDTA tubes and centrifuge at 1,500×g for 10 minutes at 4°C to obtain plasma.
- Aliquot 100 μL of plasma into Eppendorf tubes.
- Add 400 μL of 80% prechilled methanol and vortex thoroughly.
- Incubate on ice for 5 minutes, then centrifuge at 15,000×g for 20 minutes at 4°C.
- Dilute supernatant with LC-MS-grade water to achieve 53% methanol concentration.
- Centrifuge again at 15,000×g for 20 minutes at 4°C.
- Transfer final supernatant to LC vials for analysis.
LC-HRMS Analysis:
- Perform separation using a UHPLC system with a reverse-phase column (e.g., Hypersil Gold column, 100 × 2.1 mm, 1.9 μm).
- Employ a 12-15 minute linear gradient at 0.2 mL/min flow rate with mobile phases:
- Positive mode: 0.1% formic acid in water (A) and methanol (B)
- Negative mode: 5 mM ammonium acetate, pH 9.0 (A) and methanol (B)
- Operate mass spectrometer in both positive and negative ionization modes with spray voltage of 3.5 kV, capillary temperature of 320°C, and mass range of 100-1500 m/z.
- Use quality control samples (pooled from all samples) throughout the analysis to monitor instrument performance.
Data Processing:
- Process raw data using software such as Compound Discoverer for peak alignment, peak picking, and metabolite quantification [27] [58].
- Identify metabolites by matching accurate m/z values and MS/MS fragmentation patterns against databases (mzCloud, HMDB) with mass tolerance <5 ppm.
- Normalize data to account for instrument drift and perform statistical analysis.
NMR Protocol for Plasma Metabolomics
The following protocol, adapted from food and biomedical applications [60], details NMR-based metabolic profiling:
Sample Preparation:
- Thaw plasma samples on ice and centrifuge at 16,000×g for 10 minutes at 4°C.
- Mix 350 μL of plasma with 250 μL of phosphate buffer (0.1 M, pH 7.4) in 5 mm NMR tubes.
- Add 50 μL of D₂O containing 0.1% TSP (tetramethylsilane) as chemical shift reference.
NMR Analysis:
- Acquire ¹H-NMR spectra at 300 K using a high-field NMR spectrometer (≥500 MHz).
- Perform one-dimensional experiments with water suppression (e.g., presaturation or NOESY-presat).
- Use standard parameters: spectral width of 20 ppm, relaxation delay of 4 seconds, 64-128 scans.
- For metabolite identification, acquire two-dimensional experiments (¹H-¹H COSY, ¹H-¹³C HSQC) as needed.
Data Processing:
- Process FIDs with exponential multiplication (0.3 Hz line broadening), Fourier transformation, phase and baseline correction.
- Calibrrate spectra to TSP at 0.0 ppm.
- Segment spectra into bins (0.01-0.04 ppm) or perform targeted profiling using reference compound libraries.
- Normalize data and perform multivariate statistical analysis.
Table 2: Key Research Reagents and Materials for Metabolic Profiling
| Reagent/Material | Function | Application Examples |
|---|---|---|
| EDTA tubes | Anticoagulant for blood collection | Plasma metabolomics [58] [59] |
| Methanol (80%, prechilled) | Protein precipitation and metabolite extraction | LC-HRMS sample preparation [58] |
| Hypersil Gold Column | Chromatographic separation of metabolites | UHPLC-MS analysis [58] [59] |
| Formic acid | Mobile phase additive for positive ionization | LC-MS analysis in positive mode [58] |
| Ammonium acetate | Mobile phase additive for negative ionization | LC-MS analysis in negative mode [58] |
| Phosphate buffer | Maintains pH stability for NMR analysis | NMR sample preparation [60] |
| D₂O with TSP | Field frequency lock and chemical shift reference | NMR spectroscopy [60] |
| Biocrates AbsoluteIDQ p180 kit | Targeted metabolite quantification | Targeted metabolomics [62] |
Applications in Clinical Research and Drug Development
Diagnostic and Prognostic Biomarker Discovery
Personalized metabolic profiling has demonstrated significant utility in identifying diagnostic and prognostic biomarkers across various clinical conditions. In brainstem glioma (BSG), a highly malignant childhood tumor, serum metabolic profiling enabled diagnosis with an AUC of 0.933 and prediction of patient risk with significant differences in prognostic outcomes [63]. The study employed nanoparticle-enhanced laser desorption/ionization mass spectrometry to characterize static and dynamic metabolic snapshots during radiotherapy, identifying eight distinct temporal patterns of metabolite regulation associated with treatment responses.
In pregnancy loss research, untargeted LC-MS analysis of plasma samples identified 57 significantly altered metabolites between patients and controls [58]. Differential metabolites were enriched in caffeine metabolism, tryptophan metabolism, and riboflavin metabolism pathways. Using LASSO regression, researchers identified a panel of diagnostic metabolites including testosterone glucuronide, 6-hydroxymelatonin, and (S)-leucic acid that achieved a combined AUC of 0.993 for pregnancy loss prediction [58].
Therapeutic Monitoring and Personalized Treatment
Metabolic profiling provides unique insights into individual variations in drug response, enabling personalized treatment strategies. In type 2 diabetes, comparative metabolic profiling of metformin and insulin users revealed distinct metabolic signatures associated with cardiovascular risk [61]. The study found that "75 metabolomic biomarkers were significantly associated with major adverse cardiovascular events (MACE) in insulin-only users and 57 in metformin-only users," indicating treatment-specific metabolic effects that could inform therapy selection [61].
Pharmacometabolomics approaches are particularly promising for personalized medicine, as they "examine the complex interplay of genetics, gut microbiome, age, and other factors that influence drug absorption, distribution, and biliary or conjugate hepatic metabolism" [57]. This enables the development of tailored therapeutic strategies based on an individual's metabolic phenotype rather than population averages.
Analytical Challenges and Methodological Considerations
Data Quality and Reproducibility
Ensuring data quality and reproducibility remains a significant challenge in personalized metabolic profiling. As noted in exposome research, "further efforts are necessary to ensure that exposomics outputs are comparable and reproducible, thus enhancing research findings" [30]. Several strategies address these challenges:
Quality Control Measures:
- Implement pooled quality control samples to monitor instrument performance
- Maintain coefficient of variation <30% in QC samples for feature retention [58]
- Use internal standards to correct for analytical variability
- Apply batch correction algorithms to account for drift
Standardization Initiatives:
- Follow Metabolomics Standards Initiative (MSI) guidelines for metabolite identification [27]
- Implement standardized protocols for sample collection, storage, and processing
- Use reference materials for inter-laboratory comparison
Data Integration and Interpretation
The integration of multimodal data represents both a challenge and opportunity in personalized metabolic profiling. Combining metabolic data with genetic, clinical, and lifestyle information provides a more comprehensive understanding of individual physiology but requires sophisticated computational approaches.
Multivariate Statistical Methods:
- Orthogonal Partial Least Squares-Discriminant Analysis (OPLS-DA) for class separation [58] [59]
- Random Forest and Boruta algorithm for feature selection [62]
- LASSO regression for biomarker identification in high-dimensional data [58] [63]
Pathway Analysis:
- Kyoto Encyclopedia of Genes and Genomes (KEGG) database for pathway enrichment [58]
- MetaboAnalyst platform for integrated pathway analysis [58]
Personalized metabolic profiling using orthogonal LC-HRMS and NMR platforms represents a powerful approach for advancing clinical research and drug development. The complementary nature of these techniques - with LC-HRMS providing broad coverage and high sensitivity, and NMR offering structural elucidation and absolute quantification - creates a robust framework for biomarker discovery and validation.
Future developments in this field will likely focus on several key areas. First, standardization of analytical protocols and data reporting will enhance reproducibility and clinical translation. Second, advances in computational methods for integrating multimodal data will improve our ability to interpret complex metabolic phenotypes. Third, the application of artificial intelligence and machine learning approaches will enable more sophisticated pattern recognition and predictive modeling from metabolic data.
As the field evolves, personalized metabolic profiling is poised to transform clinical practice by enabling more precise diagnosis, prognosis, and treatment selection based on an individual's unique metabolic phenotype. This approach aligns with the broader vision of precision medicine, where "tailored nutrition and pharmacological interventions can substantially improve metabolic health outcomes" [64]. Through continued methodological refinement and orthogonal validation strategies, metabolic profiling will increasingly contribute to personalized healthcare approaches that optimize outcomes for individual patients.
Navigating Challenges: Strategies for Robust and Reproducible Integrated Analysis
Overcoming Sensitivity and Dynamic Range Disparities
In modern analytical sciences, particularly within metabolomics and drug development, the unambiguous identification and quantification of small molecules are paramount. The core challenge lies in the fact that no single analytical technique can fully characterize a complex metabolome due to the vast diversity of chemical structures and concentration ranges present [12]. Liquid Chromatography coupled to High-Resolution Mass Spectrometry (LC-HRMS) and Nuclear Magnetic Resonance (NMR) spectroscopy have emerged as the two most powerful platforms for this task. LC-HRMS is renowned for its high sensitivity and dynamic range, capable of detecting thousands of features at concentrations as low as the femtomole range [11]. Conversely, NMR spectroscopy provides unparalleled structural elucidation power, is inherently quantitative, non-destructive, and unaffected by matrix effects [11]. However, a significant disparity exists between the two techniques: NMR requires microgram quantities of analyte and minutes to hours of acquisition time, whereas MS can analyze nanogram quantities in seconds [11]. This article explores the strategies and methodologies developed to overcome these sensitivity and dynamic range disparities, enabling the synergistic use of LC-HRMS and NMR for orthogonal validation in scientific research.
Technical Comparison: LC-HRMS vs. NMR
The following table summarizes the fundamental characteristics of LC-HRMS and NMR, highlighting their complementary nature.
Table 1: Fundamental characteristics and complementarity of LC-HRMS and NMR
| Feature | LC-HRMS | NMR |
|---|---|---|
| Principle | Mass-to-charge ratio of ionized molecules [11] | Interaction of magnetically-active nuclei with an external magnetic field [11] |
| Sensitivity | High (femtomole range) [11] | Low (microgram range) [11] |
| Structural Information | Molecular formula via exact mass; fragmentation patterns via MS/MS [11] | Direct structural information via chemical shift, spin-spin coupling, and 2D experiments [11] |
| Quantitation | Semi-quantitative; susceptible to matrix effects [11] [65] | Inherently quantitative; non-destructive [11] [65] |
| Key Strength | Detection of low-abundance metabolites [65] | Definitive structural identification and isomer distinction [11] |
| Key Limitation | Difficulty distinguishing isomers and isobars without standards [11] | Low sensitivity; long acquisition times for low-concentration analytes [11] |
Strategic Approaches for Data Integration
The integration of LC-HRMS and NMR is not trivial, primarily due to the sensitivity gap. Several strategic approaches have been developed to facilitate their synergistic use, ranging from full online coupling to sophisticated offline correlations.
Online and At-Line Integration Methods
- Online LC-MS-NMR: This approach hyphenates the three techniques into a single, automated system. The effluent from the LC column is first analyzed by the MS and then directed to an NMR flow probe. This method is optimal for analyzing highly concentrated analytes (limits of detection around 10 μg) and minimizes manual sample handling [11]. A major technical hurdle is the mobile phase; protonated solvents can overwhelm the NMR signals of trace analytes. While using deuterated solvents like D₂O is common, the cost of fully deuterated organic phases can be a limiting factor [11].
- Stop-Flow LC-MS-NMR: This method pauses the LC flow when a peak of interest is eluting, allowing for prolonged NMR data acquisition on a static sample. This increases the observation time, thereby improving the signal-to-noise ratio for NMR detection [11].
- LC-MS-SPE-NMR: This is a widely adopted at-line approach where LC peaks are automatically collected onto solid-phase extraction (SPE) cartridges after MS detection. The trapped analytes are then washed with deuterated solvent and transferred to an NMR probe for high-sensitivity analysis. This method effectively concentrates the analyte and removes non-deuterated LC solvents, significantly enhancing NMR sensitivity [11].
Offline Data Fusion and the SYNHMET Workflow
For comprehensive metabolomic studies, offline data fusion has proven highly effective. One advanced strategy is the SYnergic use of NMR and HRMS for METabolomics (SYNHMET) [65]. This workflow does not rely on physical coupling but instead uses statistical correlation to leverage the strengths of each technique for superior metabolite identification and quantification. The SYNHMET procedure involves:
- Initial NMR Deconvolution: An initial, approximate concentration profile of metabolites is obtained by deconvoluting the ¹H-NMR spectrum using known chemical shift databases [65].
- HRMS Peak Correlation: The initial NMR-derived concentrations are correlated with the intensities of all HRMS-detected peaks whose accurate mass matches the theoretical mass of the metabolites (within 5 ppm). The MS peak showing the highest correlation with the NMR data is unambiguously assigned to the metabolite [65].
- HRMS-Assisted Refinement: The accurately measured intensity from the assigned HRMS peak is then used to refine and correct the metabolite concentration initially estimated by NMR, resulting in a final, highly accurate quantitative dataset [65].
This synergic approach has been successfully applied to quantify 165 metabolites in human urine, demonstrating a higher accuracy than using either technique alone [65].
Experimental Protocols for Orthogonal Validation
Protocol: Multilevel LC-HRMS/NMR Workflow for Foodomics
This protocol, applied to table olives, demonstrates a systematic integration for identifying quality markers [12].
- Sample Preparation: Table olive samples from different geographical origins, botanical cultivars, and processing methods are extracted using a standardized solvent system (e.g., methanol-water) to ensure comprehensive metabolite coverage.
- UPLC-HRMS/MS Analysis:
- Chromatography: Employ a C18 column with a water-acetonitrile gradient (both with 0.1% formic acid) for optimal separation.
- Mass Spectrometry: Use a high-resolution mass spectrometer (e.g., Q-Exactive Orbitrap) for untargeted analysis. Acquire data in both positive and negative ionization modes with data-dependent MS/MS.
- NMR Spectroscopy:
- Sample Preparation: Lyophilize extracts and reconstitute in deuterated phosphate buffer (e.g., D₂O, pD 7.4).
- Data Acquisition: Acquire ¹H-NMR spectra on a high-field spectrometer (e.g., 600 MHz) using a standard 1D NOESY-presat pulse sequence to suppress the water signal.
- Data Fusion via Statistical Heterospectroscopy (SHY): Process the LC-HRMS and NMR datasets separately using multivariate statistics (e.g., PCA, OPLS-DA) to identify significant features. Subsequently, apply the SHY algorithm, which calculates the covariance between signal intensities (NMR chemical shifts and MS m/z values) across the sample set. This cross-correlation increases the confidence level for annotating biomarkers such as phenyl alcohols, flavonoids, and secoiridoids [12].
Protocol: Data Fusion for Classifying Amarone Wine
This study showcases a multi-omics data fusion approach [16].
- Sample Analysis: Analyze 80 Amarone wine samples using both untargeted LC-HRMS and ¹H NMR profiling.
- Data Integration:
- Unsupervised Exploration: Apply Multiple Co-Inertia Analysis (MCIA) to the combined LC-HRMS and NMR datasets. This reveals the limited correlation (RV-score = 16.4%) between the two platforms, confirming their complementarity.
- Supervised Modeling: Use sparse Partial Least Squares-Discriminant Analysis (sPLS-DA) on the fused data to build a classification model. This model correctly classifies wines based on grape withering time and yeast strain with a lower classification error (7.52%) than models built from either dataset alone, by identifying key changes in amino acids, monosaccharides, and polyphenolic compounds [16].
Visualization of Integrated Workflows
The following diagram illustrates the logical flow of a synergic NMR and LC-HRMS workflow for metabolomic profiling.
The Scientist's Toolkit: Essential Research Reagents and Materials
The following table details key reagents and materials essential for experiments integrating LC-HRMS and NMR.
Table 2: Essential Research Reagent Solutions for LC-HRMS and NMR Integration
| Item | Function / Application |
|---|---|
| Deuterated Solvents (D₂O, CD₃OD) | Used as the NMR solvent to avoid signal interference from protons in common solvents; also used in LC mobile phases for online LC-NMR [11]. |
| Deuterated Buffer Salts | (e.g., phosphate buffer in D₂O) Maintains a stable pH (pD) for NMR analysis of biofluids, ensuring chemical shift reproducibility [65]. |
| Internal Standards for MS | (e.g., stable isotope-labeled compounds) Added to samples for signal correction, quality control, and semi-quantification in LC-HRMS analysis. |
| Chemical Shift References | (e.g., TMS, DSS) Added to NMR samples to provide a reference point (0 ppm) for calibrating chemical shifts [65]. |
| SPE Cartridges | Used in LC-MS-SPE-NMR workflows to trap, clean up, and concentrate LC peaks for subsequent high-sensitivity NMR analysis [11]. |
| Reverse-Phase & HILIC LC Columns | Provide complementary chromatographic separations; Reverse-Phase for hydrophobic compounds and HILIC for polar metabolites, expanding metabolome coverage in HRMS [65]. |
| Cryoprobes & Microcoil Probes | NMR probe technologies that enhance sensitivity. Cryoprobes reduce electronic noise, while microcoils work with smaller sample volumes, increasing analyte concentration [11]. |
In the field of analytical chemistry, particularly within pharmaceutical research and metabolomics, the orthogonal validation of findings from Liquid Chromatography-High-Resolution Mass Spectrometry (LC-HRMS) with Nuclear Magnetic Resonance (NMR) spectroscopy is crucial for building a confident molecular inventory [22]. This process is fundamental to drug development, where the precise structural elucidation of complex molecules, including the identification of isomeric impurities and chiral centers, is non-negotiable for efficacy and safety [14]. The core challenge in integrating LC-HRMS with NMR lies in the fundamental mismatch of their operational timescales; while MS detection is rapid, NMR requires longer acquisition times to achieve adequate signal-to-noise ratios for low-abundance analytes [22].
To address this, two primary technical solutions have been developed: segmented flow analysis and fraction collection. This guide provides an objective comparison of these two techniques for coupling LC-HRMS with NMR, focusing on their performance in modern workflows aimed at orthogonal validation. We will present experimental data, detailed protocols, and a clear comparison of their applicability in a research and drug development context.
Fraction Collection is a traditional approach where the continuous flow from liquid chromatography is collected into discrete vials or wells at predetermined time intervals or based on trigger events from a prior MS run. These fractions, containing the purified analytes, are then transported for offline NMR analysis [22].
Segmented Flow Analysis, specifically active segmentation, is a more recent technological advancement. It transforms the continuous LC eluent into a series of microliter-scale segments or "plugs" separated by an immiscible, inert carrier fluid. These segments are simultaneously split into parallel flow paths: one for real-time online MS analysis and the other stored in a capillary queue for subsequent offline, segment-specific NMR analysis [22].
The table below provides a direct, data-driven comparison of these two techniques based on key performance parameters.
Table 1: Performance Comparison: Segmented Flow vs. Fraction Collection
| Performance Parameter | Segmented Flow (Active) | Traditional Fraction Collection |
|---|---|---|
| Primary Principle | In-line digitization of eluent into segments separated by a carrier phase (e.g., FC43) [22]. | Collection of eluent into discrete vials or tubes for offline handling [22]. |
| Compatibility with Co-eluting Isomers | High. Online MS data can direct NMR to specific segments, enabling targeted analysis of co-eluting species [22]. | Low. Relies on pre-determined retention times; susceptible to mis-collection due to run-to-run retention time shifts [22]. |
| Temporal Resolution & Peak Preservation | High. Capable of generating 10+ segments across a single chromatographic peak (e.g., 2-4 μL segments at ~1 Hz frequency), preserving chromatographic fidelity [22]. | Moderate to Low. Limited by the number of collection tubes and the speed of the collector's movement. |
| Sample Capacity | Very High. Can queue thousands of segments in capillary tubing for later analysis [22]. | Limited. Constrained by the physical number of collection tubes (e.g., 96-well plate, 192-tube rack), which also adds cost [22]. |
| Automation & Workflow Integration | High. Enables direct correlation of MS and NMR data from a single, automated LC run without manual intervention between MS and NMR analysis [22]. | Low. Requires two separate LC runs (one for MS scouting, one for fraction collection) and manual transfer of fractions, increasing error and time [22]. |
| Best-Suited Application | Complex mixtures with potential co-elutions and for untargeted analysis where analytes of interest are not known a priori [22]. | Targeted analysis of well-resolved peaks where retention times are stable and predictable [66]. |
Experimental Protocols and Workflows
Detailed Protocol for Active Segmented Flow
The following workflow is adapted from a study demonstrating the integration of LC-MS with NMR for lipid analysis [22].
1. System Configuration:
- LC System: Standard UHPLC system using an analytical flow rate (e.g., 240 μL/min).
- Active Segmentation Device: A four-port, two-way valve, digitally controlled by a function generator to define switching frequency and duty cycle.
- Carrier Phase: Perfluorotributylamine (FC43), chosen for its immiscibility with the aqueous/organic eluent, non-ionizability under ESI, and proton NMR silence [22].
- Tubing: 1/16 in. o.d., 500 μm i.d. perfluoroalkyl (PFA) tubing for segment transfer and storage.
- MS: High-resolution mass spectrometer (e.g., Orbitrap series) with a HESI ion source.
- NMR: Spectrometer equipped with a microcoil flow probe with a microliter detection volume (e.g., 2-4 μL).
2. Method Parameters:
- LC Flow Rate: 240 μL/min.
- Carrier Phase Flow Rate: 240 μL/min.
- Valve Switching Frequency: ~1 Hz.
- Segment Volume: 2-4 μL, designed to match the detection cell volume of the NMR microcoil probe [22].
- MS Data Acquisition: Full scan and data-dependent MS/MS (dd-MS2). Parameters like maximum ion injection time and AGC target must be optimized for the segmented flow to ensure adequate scan speed and sensitivity [22].
3. Workflow Steps:
- The LC eluent and FC43 are pumped into the two inlet ports of the switching valve.
- The valve actively alternates between the two fluids, creating a segmented flow of eluent plugs separated by FC43.
- This segmented flow is split into two parallel paths.
- One path is directed online to the MS for real-time analysis.
- The second path is stored in a coiled capillary tube, preserving the chronological queue of segments.
- After MS data acquisition, the stored segments corresponding to analytes of interest (e.g., unknown lipids) are selected based on their retention time (segment number).
- These selected segments are then injected into the capillary NMR flow cell for offline 1H NMR analysis.
The following diagram visualizes this complex experimental setup and workflow.
Detailed Protocol for Fraction Collection
1. System Configuration:
- LC System: Standard UHPLC system.
- Fraction Collector: Automated collector capable of positioning vials or a 96-well plate.
- Collection Vessels: Deuterated solvent-resistant vials or low-volume NMR tubes (e.g., 1.7 mm).
- MS and NMR: Standard systems for offline analysis.
2. Workflow Steps:
- An initial scouting LC-MS run is performed to identify the retention times of target analytes.
- Based on this scouting run, a method for the fraction collector is programmed, specifying when to start and stop collection for each peak of interest.
- A second, separate LC run is performed to physically collect the eluent into the designated vials or plates. The mobile phase must be compatible with NMR, often requiring the use of deuterated solvents or subsequent buffer exchange [22].
- The collected fractions are manually transferred to the NMR spectrometer for analysis.
- MS and NMR data are then correlated post-hoc based on the collected fractions.
The Scientist's Toolkit: Essential Research Reagents and Materials
Successful implementation of these coupling strategies, particularly segmented flow, relies on specific materials and reagents. The table below details these key components.
Table 2: Essential Research Reagent Solutions for LC-HRMS-NMR Coupling
| Item Name | Function / Application | Key Considerations |
|---|---|---|
| Perfluorotributylamine (FC43) | Serves as the immiscible carrier phase in active segmented flow [22]. | Must be NMR-silent (no 1H signals), non-ionizable in ESI-MS, and lipophobic to prevent analyte dissolution [22]. |
| Capillary PFA Tubing (e.g., 1/16 in. o.d., 500 μm i.d.) | Used for the transfer and storage of segmented flow queues [22]. | Must be chemically inert and provide zero-dispersion to maintain segment integrity. |
| Microcoil NMR Probe (e.g., Capillary flow cell) | Enables high mass-sensitivity 1H NMR detection for microliter-volume segments [22]. | Detection cell volume (e.g., 2-4 μL) should be matched to the segment volume for optimal sensitivity [22]. |
| Four-Port, Two-Way Valve | The core hardware for active segmentation, switching between LC eluent and carrier phase [22]. | Requires digital control (e.g., by a function generator) to precisely define switching frequency and duty cycle [22]. |
| Deuterated NMR Solvents | Used in the mobile phase for fraction collection to provide a field frequency lock for NMR spectroscopy. | Can be cost-prohibitive for analytical flow rates. May require post-collection solvent exchange if non-deuterated solvents are used in LC. |
Data Fusion and Orthogonal Validation
The ultimate goal of coupling these instruments is to achieve orthogonal validation. LC-HRMS/MS excels at providing molecular formula and fragment-based structural hints with high sensitivity but can struggle to disambiguate isomers [14] [67]. Conversely, 1H NMR provides invaluable higher-order structural information, including unambiguous carbon-hydrogen connectivity and stereochemistry, with absolute chemical specificity, making it ideal for distinguishing isomers [22] [67].
The data from these combined techniques can be integrated using data fusion strategies to create more robust models [16] [67].
- Low-Level Fusion: Concatenates raw or pre-processed data matrices from NMR and MS.
- Mid-Level Fusion: Combines features extracted from each dataset (e.g., PCA scores) before building a model.
- High-Level Fusion: Combines the predictions or decisions from models built on each dataset separately [67].
Studies, such as one classifying Amarone wines, have demonstrated that data fusion of LC-HRMS and 1H NMR data provides a much broader characterization of the metabolome and a lower classification error rate compared to using either technique alone [16]. This approach is directly translatable to pharmaceutical development, where it can enhance the confidence in identifying active pharmaceutical ingredients (APIs), metabolites, and impurities [14].
In modern analytical science, particularly within drug development and metabolomics, the orthogonal validation of Liquid Chromatography-High Resolution Mass Spectrometry (LC-HRMS) findings with Nuclear Magnetic Resonance (NMR) research represents a gold standard for confirming compound identity and biological significance [67]. This multi-platform approach leverages the complementary strengths of each technique: LC-HRMS provides high sensitivity for detecting numerous compounds, while NMR offers unparalleled structural elucidation capabilities and precise, non-destructive quantification [67] [68]. However, integrating data from these disparate platforms presents significant data processing hurdles, primarily centered on retention time (RT) alignment and feature matching, which must be overcome to achieve a holistic biochemical understanding [67].
The core challenge lies in the fundamental differences between the techniques. LC-HRMS data is defined by retention time, mass-to-charge ratio (m/z), and intensity, whereas NMR data is characterized by chemical shift, intensity, and spectral multiplicity. Correlating features across these domains is not trivial, as it requires sophisticated algorithms and data fusion strategies to ensure that a peak in an LC-HRMS chromatogram correctly corresponds to a signal in an NMR spectrum for the same metabolite. This guide objectively compares the performance of different data processing strategies and tools designed to bridge this technological divide.
Data Alignment and Feature Matching Core Concepts
The Critical Role of Retention Time Alignment in LC-MS
Retention time (RT) is a critical feature that distinguishes different components in complex mixtures analyzed by LC-MS [69]. RT alignment is a computational pre-processing step crucial for correlating identical components across different samples or analytical runs. Variations in RT can occur due to factors like column aging, fluctuations in mobile phase composition, temperature, and pressure. Without proper alignment, these shifts can lead to misidentification of compounds and erroneous quantitative data [69].
RT alignment methods and tools can be broadly categorized based on the information they employ [69]:
- Reference-based alignment aligns all samples to a common reference run.
- Peak-based methods use detected peak features for correlation.
- Whole-profile alignment algorithms operate on the entire chromatographic data.
- Identification-free strategies represent a potential application, aligning features without prior metabolite identification, which is particularly useful for unknown discovery [69].
Established algorithmic approaches include Correlation Optimized Warping (COW) and Dynamic Time Warping (DTW), which non-linearly stretch and compress chromatographic time axes to achieve optimal correspondence between runs [69].
The Feature Matching Problem Across LC-HRMS and NMR
Feature matching across LC-HRMS and NMR involves establishing a one-to-one correspondence between the molecular features detected by each platform. This is a multi-faceted challenge. First, the sensitivity differences are vast; LC-HRMS can detect compounds at nanomolar or picomolar levels, whereas NMR typically requires micromolar concentrations, meaning not all LC-HRMS features will have a corresponding NMR signal [67]. Second, the structural informativeness differs; while NMR provides direct evidence of molecular structure through chemical shifts and coupling constants, LC-HRMS primarily provides molecular mass and fragmentation patterns [14] [67].
The process of orthogonal validation requires that a feature of interest in LC-HRMS data is not only matched by accurate mass but also by the definitive structural information provided by NMR. This often requires matching the retention time and fragmentation pattern from LC-HRMS with the chemical shift and J-coupling information from NMR for the same compound, confirming its identity with a high degree of confidence.
Comparative Analysis of Data Processing Strategies
Data Fusion Strategies for NMR and MS Integration
Data fusion (DF) strategies formally integrate datasets from different analytical sources, such as NMR and MS, to build more robust and informative models than could be achieved from either platform alone [67]. These strategies are classified based on the level of data integration, each with distinct advantages, computational requirements, and performance characteristics, as summarized in the table below.
Table 1: Comparison of Data Fusion Strategies for Integrating NMR and MS Data
| Fusion Level | Description | Key Algorithms | Advantages | Limitations |
|---|---|---|---|---|
| Low-Level | Direct concatenation of raw or pre-processed data matrices [67]. | PCA, PLS [67] | Maximizes information retention from original data. | High computational load; requires extensive pre-processing and scaling [67]. |
| Mid-Level | Integration of extracted features from each dataset after dimensionality reduction [67]. | PCA, PARAFAC, MCR-ALS [67] | Reduces data complexity; handles high-dimensional data well. | Risk of losing meaningful information during feature extraction. |
| High-Level | Combination of model outputs or decisions from separate analyses of each dataset [67]. | Bayesian Inference, Heuristic Rules [67] | Flexible; allows for different optimal models for each data type. | Highest complexity; requires separate model development for each platform. |
Experimental Protocols for Cross-Platform Validation
A typical experimental workflow for orthogonal validation of LC-HRMS findings with NMR involves a series of methodical steps to ensure data quality and correct correlation.
Sample Preparation Protocol
- Standardized Extraction: Use a single, standardized metabolite extraction protocol (e.g., 80% methanol-water for polar metabolites) for all analytical portions to minimize technical variation.
- Split Sample Analysis: The exact same sample extract should be split for concurrent LC-HRMS and NMR analysis. This eliminates biological variation between the analyses.
- Standard Addition: For quantitative correlation, include internal standards at known concentrations in the extraction solvent. These standards should be detectable by both LC-HRMS and NMR (e.g., DSS or TSP for NMR) [68].
LC-HRMS Data Acquisition and Pre-processing
- Chromatography: Utilize a robust, reproducible LC method (e.g., reversed-phase C18 column) with a defined gradient. Column temperature should be controlled.
- Mass Spectrometry: Acquire data in high-resolution mode (e.g., FT-MS or Orbitrap) with positive and negative ionization to maximize feature detection. Include a calibration standard for accurate mass measurement.
- Feature Detection: Process raw data using software (e.g., XCMS, MZmine) for peak picking, retention time alignment, and feature table generation. Key parameters include: m/z tolerance (e.g., 5-10 ppm), peak width, and signal-to-noise threshold.
NMR Data Acquisition and Pre-processing
- Standardized Acquisition: Acquire 1D ¹H NMR spectra with water suppression (e.g., NOESY-presat) at a controlled temperature (e.g., 298 K) on a high-field spectrometer (e.g., 600 MHz) [14] [68].
- Quantification: Use quantitative NMR (qNMR) practices, ensuring a sufficient relaxation delay (e.g., >5x T1) for accurate integration [68].
- Spectral Processing: Process FIDs with exponential line broadening (e.g., 0.3 Hz), followed by Fourier transformation, phase correction, and baseline correction. Reference to a known internal standard (e.g., TSP at 0.0 ppm). Bin data (e.g., to 0.01 ppm buckets) for multivariate analysis.
Workflow Visualization: Orthogonal Validation Pathway
The following diagram illustrates the logical workflow and decision points for the orthogonal validation of LC-HRMS and NMR data, incorporating the data fusion strategies.
Diagram 1: Orthogonal validation workflow for LC-HRMS and NMR data integration.
The Scientist's Toolkit: Essential Research Reagents and Materials
Successful integration of LC-HRMS and NMR data relies on both analytical instrumentation and specific reagents for system calibration, quality control, and sample preparation.
Table 2: Essential Research Reagent Solutions for Cross-Platform Metabolomics
| Item | Function/Purpose | Application Notes |
|---|---|---|
| Deuterated Solvents (e.g., D₂O, CD₃OD) [68] | Provides a field-frequency lock for NMR spectroscopy; defines the deuterium signal for shimming. | Essential for all NMR samples. Purity should be >99.9% D. |
| NMR Chemical Shift Reference (e.g., TSP, DSS) [68] | Provides a reference peak (e.g., 0.0 ppm) for calibrating chemical shifts in ¹H NMR spectra. | Added in small, known quantities; can also serve as an internal standard for quantification (qNMR). |
| LC-MS Calibration Solution | Enables external or internal mass calibration of the MS instrument for accurate mass measurement. | Solutions contain a mixture of compounds with known m/z values (e.g., sodium formate clusters). |
| Internal Standards (IS) for Quantification | Corrects for variability in sample preparation, injection, and instrument response. | Should be added at the beginning of extraction. Use stable isotope-labeled (SIL) IS for LC-MS and a unique compound (e.g., DSS) for NMR [68]. |
| Quality Control (QC) Pool Sample | Monitors instrument stability and performance over the entire batch sequence. | Created by pooling a small aliquot of every experimental sample. Run frequently throughout the sequence. |
The integration of LC-HRMS and NMR data through sophisticated retention time alignment and feature matching strategies is paramount for robust orthogonal validation in life science research. While significant hurdles exist—primarily related to the differing sensitivities, data structures, and informational content of each platform—the strategic application of data fusion methodologies (low-, mid-, and high-level) provides a powerful framework for overcoming these challenges.
The future of this field lies in the development of more automated, user-friendly software pipelines that can seamlessly handle the data processing workflow from raw data input to a final, integrated list of annotated and validated metabolites. Furthermore, the identification-free strategy for RT alignment mentioned in the literature hints at a growing focus on true unknown discovery, moving beyond simple database matching [69]. As these tools evolve, the orthogonal validation of LC-HRMS with NMR will become more accessible, further solidifying its role as a cornerstone of rigorous biochemical and drug development research.
Optimizing Sample Preparation for Dual-Platform Analysis
In modern biomedical research, particularly in drug development, the orthogonal validation of findings through multiple analytical techniques is paramount for ensuring data reliability. This guide focuses on optimizing sample preparation to support a dual-platform strategy, specifically framing the discussion within a broader thesis on correlating Liquid Chromatography-High Resolution Mass Spectrometry (LC-HRMS) data with Nuclear Magnetic Resonance (NMR) research. The core principle of orthogonal validation is the use of independent methods to confirm analytical results, thereby increasing confidence in the identification and quantification of biomarkers, metabolites, and pharmaceutical compounds [70]. Sample preparation is the critical, foundational step in this process; a poorly executed protocol can introduce errors and biases that propagate through all subsequent analyses, compromising the entire validation framework [71]. The overarching goal is to design a sample preparation workflow that is not only efficient and robust but also compatible with the distinct operational requirements of both LC-HRMS and NMR platforms, enabling a seamless and directly comparable analytical flow.
The challenge in dual-platform analysis lies in reconciling the different needs of each technique. LC-HRMS often requires samples that are free of particulates and ion-suppressing contaminants, while NMR needs samples in a deuterated solvent and may require a different concentration for optimal signal-to-noise ratio. This guide provides a comparative overview of modern sample preparation techniques, detailing their performance and presenting structured experimental data to help researchers and scientists in drug development make informed decisions that enhance the consistency and credibility of their orthogonal validation studies.
Comparative Analysis of Sample Preparation Techniques
Sample preparation for the analysis of small molecules, including metabolites and oligonucleotide therapeutics, has evolved significantly towards miniaturization, automation, and green chemistry principles [71]. The objective is to effectively isolate the analyte from a complex biological matrix (such as plasma, urine, or tissue) while minimizing interference and maintaining compatibility with the downstream analytical instrument. These techniques can be broadly categorized into sorbent-based and liquid-based extraction methods, each with distinct advantages and limitations for dual-platform applications.
Sorbent-based techniques utilize a solid phase to selectively capture the target analytes. This category includes:
- Solid-Phase Extraction (SPE): A well-established workhorse method that offers high selectivity and clean-up efficiency through various functionalized sorbents [71].
- Solid-Phase Microextraction (SPME): A miniaturized, solvent-free technique where a fiber coated with a stationary phase is used to extract analytes from the sample matrix. It can be operated in direct immersion (DI-SPME) or headspace (HS-SPME) mode for volatile compounds [71].
- microextraction by packed sorbent (MEPS): A further miniaturized version of SPE integrated into a syringe, allowing for low sample and solvent volumes, ideal for precious biological samples [71].
Liquid-based techniques rely on the partitioning of analytes between two immiscible liquids. Key methods include:
- Liquid-Liquid Extraction (LLE): A traditional method that is effective for a broad range of analytes but can be cumbersome and require large solvent volumes [71].
- Dispersive Liquid-Liquid Microextraction (DLLME): A miniaturized form of LLE that uses a tiny volume of extraction solvent dispersed in the sample, leading to high enrichment factors and excellent recovery [71].
The choice between these methods depends on factors such as the chemical properties of the analyte, the nature of the sample matrix, and the required sensitivity and throughput for both LC-HRMS and NMR analysis.
Performance Comparison of Key Techniques
The following table summarizes the key characteristics of prominent sample preparation methods, providing a clear basis for comparison in the context of dual-platform analysis.
Table 1: Comparative Performance of Modern Sample Preparation Techniques
| Technique | Principle | Best For | Throughput | Greenness/Solvent Use | Recovery & Enrichment | Compatibility with LC-HRMS/NMR |
|---|---|---|---|---|---|---|
| Solid-Phase Extraction (SPE) | Sorbent-based retention and elution | High-purity clean-up; versatile analyte classes | Medium | Medium (moderate solvent use) | High, reproducible recovery | Excellent for LC-HRMS; may require solvent exchange for NMR. |
| SPME | Sorption onto a coated fiber | Volatile/semi-volatile compounds; minimal solvent use | High | High (negligible solvent) | Good for volatiles; capacity limited | Direct thermal desorption to GC-MS; solvent desorption possible for LC-HRMS/NMR. |
| Liquid-Liquid Extraction (LLE) | Partitioning between immiscible liquids | Broad range of non-polar to semi-polar analytes | Low | Low (high solvent consumption) | High recovery for compatible analytes | Good, but extract may require drying/reconstitution for LC-HRMS and specific solvents for NMR. |
| Dispersive Liquid-Liquid Microextraction (DLLME) | Cloudy dispersion of extractant solvent | Fast, high-enrichment factor microextraction | High | High (very low solvent use) | Very high enrichment factors | Excellent for LC-HRMS; small final volume may need adjustment for NMR. |
Platform-Specific Considerations for LC-HRMS and NMR
When preparing samples for orthogonal validation, understanding the specific demands of each platform is crucial for selecting and optimizing the sample preparation protocol.
LC-HRMS Considerations: The primary goal for LC-HRMS is to minimize matrix effects that can suppress or enhance ionization, leading to inaccurate quantification. Techniques like SPE and Hybrid LC-MS (which uses analyte-specific probes for enrichment) are highly effective here [72]. For example, a comparison of bioanalytical platforms for an siRNA therapeutic found that hybrid LC-MS and stem-loop reverse transcription quantitative PCR (SL-RT-qPCR) offered the highest sensitivity, with lower limits of quantification (LLOQs) at or below 1 ng/mL [72]. Furthermore, LC-MS assays generally provide high specificity and the ability to discriminate between the parent oligonucleotide and its metabolites, a key advantage in pharmacokinetic studies [72]. The sample must be free of particulates to prevent clogging the LC system and mass spectrometer interface.
NMR Considerations: Sample preparation for NMR prioritizes the preservation of the native state of metabolites and requires a homogeneous sample in a deuterated solvent (e.g., D₂O or CD₃OD). The concentration of the analyte is critical, as NMR is less sensitive than MS; thus, methods that provide high enrichment, such as DLLME, can be beneficial. Unlike LC-HRMS, NMR is non-destructive and can provide structural information in a non-targeted manner, but it requires a sample that is perfectly transparent in the deuterated solvent, making thorough solvent removal and reconstitution a critical step when transferring from an LC-MS-friendly extract.
Experimental Protocols for Key Sample Preparation Methodologies
Protocol 1: Hybrid LC-MS for Oligonucleotide Bioanalysis
This protocol, adapted from a comparative study of bioanalytical platforms, is designed for the specific and sensitive quantification of oligonucleotide therapeutics like siRNA in plasma, supporting orthogonal validation with NMR [72].
Materials & Reagents:
- Analyte: siRNA therapeutic (e.g., SIR-2) reference standard.
- Internal Standard: An analog lipid-conjugated siRNA (e.g., ISTD-3).
- Capture Probe: Locked Nucleic Acid (LNA) probes custom-synthesized against the target siRNA sequence.
- Magnetic Beads: Dynabeads MyOne Streptavidin C1.
- Buffers: Phosphate-buffered saline (PBS), Tris-buffered saline, binding/wash buffers.
- Elution Solvent: Nuclease-free water or a compatible LC-MS mobile phase.
- Biological Matrix: Control K₂EDTA plasma (e.g., from BioIVT).
Procedure:
- Sample Denaturation and Hybridization:
- Spike the internal standard (ISTD-3) into the plasma sample.
- Denature the sample to expose the target siRNA sequence.
- Incubate the denatured sample with the biotinylated LNA capture probe to allow for specific hybridization.
Capture and Wash:
- Add streptavidin-coated magnetic beads to the sample-probe mixture and incubate to allow the bead-probe-analyte complex to form.
- Use a magnetic rack to separate the beads from the sample matrix.
- Wash the beads multiple times with an appropriate buffer to remove non-specifically bound contaminants and matrix components.
Elution:
- Elute the purified siRNA analyte from the beads using a low-ionic-strength solvent or nuclease-free water.
Analysis:
- The eluent can be directly injected into the LC-HRMS system for analysis. The method demonstrates high sensitivity (LLOQ ≤1 ng/mL) and specificity, as it captures the full-length parent oligonucleotide [72].
Protocol 2: Dispersive Liquid-Liquid Microextraction (DLLME) for Small Metabolites
This protocol outlines a green, efficient microextraction technique ideal for concentrating volatile or semi-volatile small metabolites from biological samples prior to analysis, facilitating subsequent NMR studies [71].
Materials & Reagents:
- Sample: Aqueous biological fluid (e.g., urine, plasma supernatant).
- Extraction Solvent: A water-immiscible, dense organic solvent (e.g., chlorobenzene, carbon tetrachloride).
- Disperser Solvent: A water-miscible organic solvent (e.g., acetone, acetonitrile).
- Centrifuge Tubes: Conical bottom glass tubes.
Procedure:
- Mixture Preparation:
- Rapidly inject a mixture of the disperser solvent (e.g., 1.0 mL acetone) containing the extraction solvent (e.g., 50 µL chlorobenzene) into an aqueous sample (e.g., 5.0 mL) contained in a centrifuge tube.
Cloudy Formation and Extraction:
- A cloudy solution forms immediately, consisting of fine droplets of the extraction solvent dispersed throughout the aqueous sample. This creates a vast surface area for the rapid partitioning of analytes from the aqueous phase into the organic droplets.
Phase Separation:
- Centrifuge the tube for a short period (e.g., 5 minutes at 4000 rpm) to break the emulsion and sediment the dense extraction solvent droplets at the bottom of the conical tube.
Collection:
- The sedimented phase (typically 10-50 µL), now enriched with the target metabolites, is collected using a micro-syringe.
Analysis:
- The extract can be reconstituted in a deuterated solvent for direct NMR analysis or in a solvent compatible with LC-HRMS. This method offers a very high enrichment factor and excellent recovery for a wide range of analytes [71].
Workflow Visualization for Dual-Platform Analysis
The following diagram illustrates a logical and optimized sample preparation workflow designed to generate compatible samples for both LC-HRMS and NMR analysis, enabling effective orthogonal validation.
Diagram 1: A unified sample preparation workflow showing how a single sample can be processed to create compatible extracts for both LC-HRMS and NMR platforms, culminating in data integration for orthogonal validation.
The Scientist's Toolkit: Essential Research Reagent Solutions
Successful implementation of the protocols and workflows described above relies on a set of key reagents and materials. The following table details these essential components and their critical functions in the sample preparation process for dual-platform analysis.
Table 2: Key Research Reagent Solutions for Sample Preparation
| Item | Function & Role in Sample Prep | Key Considerations for Dual-Platform Use |
|---|---|---|
| Locked Nucleic Acid (LNA) Probes | Synthetic nucleotides used in hybrid LC-MS to specifically capture target oligonucleotides via hybridization [72]. | Provides high specificity for LC-HRMS. The eluted analyte must be in a solvent compatible with both LC-MS and NMR. |
| Streptavidin Magnetic Beads | Solid support functionalized with streptavidin to bind biotinylated capture probes (e.g., LNA probes), enabling easy separation and washing [72]. | Enables efficient clean-up, reducing matrix effects for LC-HRMS and contaminants for NMR. |
| Deuterated Solvents (e.g., D₂O, CD₃OD) | Solvents containing deuterium used to prepare samples for NMR spectroscopy, providing a lock signal for the instrument. | Essential for NMR. Protocols must include a solvent exchange step if the final extract is in a non-deuterated solvent. |
| SPE Sorbents (C18, Ion-Exchange) | Functionalized silica or polymer-based cartridges for selective retention of analytes based on hydrophobicity, charge, etc. [71]. | Choice of sorbent is critical for clean-up efficiency. Elution solvent must be considered for both platforms. |
| Microextraction Solvents | Solvents used in DLLME and related techniques, characterized by low water solubility and high density [71]. | The high enrichment factor benefits both platforms. The chemical nature of the solvent must not interfere with LC-MS ionization or NMR spectra. |
| Internal Standards (e.g., ISTD-3) | Non-target analogs or stable isotope-labeled compounds added to correct for variability in sample preparation and analysis [72]. | Crucial for quantitative LC-HRMS. Should be chosen to not co-elute or spectrally overlap with analytes of interest in NMR. |
Software and Bioinformatics Tools for Streamlined Data Integration
In modern research, particularly in metabolomics and drug development, the ability to integrate data from multiple analytical platforms is paramount. The context of orthogonal validation, such as correlating findings from Liquid Chromatography-High Resolution Mass Spectrometry (LC-HRMS) with Nuclear Magnetic Resonance (NMR) spectroscopy, presents a significant data integration challenge [67]. LC-HRMS offers high sensitivity, while NMR provides robust structural elucidation and quantification; however, each technique has inherent limitations [67]. Bioinformatics tools that can streamline the integration of these disparate datasets are crucial for obtaining a holistic view of complex biological systems [67]. This guide objectively compares the performance of key software and tools designed for this purpose, providing a framework for researchers to select the optimal solutions for their workflows.
Core Concepts and Data Integration Frameworks
Data integration in metabolomics involves combining datasets from different analytical sources, like LC-HRMS and NMR, to create a more comprehensive model than any single source could provide. The most common classification for this integration is based on the level of data abstraction [67].
Data Fusion Levels: The process is typically categorized into three levels, each with distinct methodologies and applications for handling data from techniques like LC-HRMS and NMR [67].
- Low-Level Data Fusion (LLDF): This approach involves the direct concatenation of raw or pre-processed data matrices from different sources [67]. For example, the processed spectral bins from an NMR dataset and the peak lists from an LC-HRMS dataset are combined into a single, large matrix. While straightforward, this method can be computationally intensive and requires careful data scaling to ensure one platform does not dominate the model due to its inherently higher number of variables or variance [67].
- Mid-Level Data Fusion (MLDF): This strategy involves first extracting relevant features from each dataset independently (e.g., using Principal Component Analysis - PCA) and then concatenating these extracted features for the final analysis [67]. This reduces the dimensionality of the data and can help mitigate the challenges of LLDF when dealing with many variables [67].
- High-Level Data Fusion (HLDF): Also known as decision-level fusion, this method combines the results or decisions from models built on each dataset separately [67]. For instance, the classification results from an NMR-based model and an LC-HRMS-based model are combined using rules or Bayesian methods to produce a final, consensus result [67]. This is the least common approach due to its complexity [67].
The following workflow diagram illustrates how these fusion levels fit into a typical metabolomics study integrating LC-HRMS and NMR data.
Comparison of Bioinformatics Tools
Selecting the right software is critical for effective data integration. The following tables compare popular bioinformatics tools based on their primary function and their specific capabilities for integrative analysis, particularly of LC-HRMS and NMR data.
Table 1: Overview of Popular Bioinformatics Tools for Data Analysis
| Tool Name | Primary Function | Key Strengths | Platform Support | Pricing Model |
|---|---|---|---|---|
| BLAST [73] [74] | Sequence similarity search | Rapid alignment, extensive database integration | Web, Linux, Windows, macOS | Free |
| Galaxy [73] [74] | Workflow creation & analysis | User-friendly, drag-and-drop interface, reproducible | Web, Linux, Cloud | Free |
| Bioconductor [73] [74] | Genomic data analysis | Comprehensive R-based packages, highly customizable | Linux, Windows, macOS | Free |
| Cytoscape [74] | Network visualization | Powerful visualization of molecular interaction networks | Web, Linux, Windows, macOS | Free |
| GATK [74] | Variant calling | High accuracy in variant detection for NGS data | Linux, Windows | Free (license required) |
| Clustal Omega [73] [74] | Multiple sequence alignment | Fast and accurate for large-scale alignments | Web, Linux, Windows, macOS | Free |
| XCMS [75] | LC-MS data processing | Comprehensive workflow for LC-MS metabolomics | R, Web | Free |
| MZmine [75] | LC-MS data processing | Modular platform for LC-MS data processing | Linux, Windows, macOS | Free |
Table 2: Tool Capabilities for Integrated LC-HRMS and NMR Metabolomics
| Tool Name | Direct NMR/LC-MS Fusion Support | Data Visualization & Exploration | Statistical Analysis Capabilities | Key Feature for Integration |
|---|---|---|---|---|
| Galaxy | Medium (via tool combinations) [73] | High [73] [74] | High [73] | Accessible, reproducible workflows for multi-platform data [73] |
| Bioconductor | High (via R packages) [73] | Medium (requires coding) [73] | Very High [73] | Flexibility to implement custom fusion scripts and models [73] |
| Cytoscape | Low (for network results) [74] | Very High (network visualization) [74] | Low | Visualizing integrated molecular networks from fused data [74] |
| XCMS | Low (focus on LC-MS) [75] | Medium [75] | Medium | Powerful LC-MS pre-processing for input to fusion models [75] |
| MZmine | Low (focus on LC-MS) [75] | High [75] | Medium | Modular LC-MS pre-processing for input to fusion models [75] |
| In-house scripts | Very High (full control) | Variable | Variable | Ultimate flexibility for implementing LLDF, MLDF, and HLDF [67] |
Experimental Protocols for Tool Evaluation
To objectively compare the performance of data integration tools and strategies, researchers can employ standardized experimental protocols. The following section outlines a core methodology for evaluating data fusion approaches and an extended framework for assessing software quality.
Core Protocol: Data Fusion Performance Benchmarking
This protocol provides a framework for evaluating how effectively different tools or fusion strategies integrate LC-HRMS and NMR data to improve model performance.
1. Objective: To evaluate and compare the classification accuracy and predictive power of models built using low-level, mid-level, and high-level data fusion strategies on a validated dataset containing paired LC-HRMS and NMR profiles.
2. Materials & Reagents:
- Reference Dataset: A publicly available or in-house dataset with matched biological samples analyzed by both LC-HRMS and 1H-NMR spectroscopy. The dataset should include samples from at least two distinct groups (e.g., case vs. control).
- Software Tools: As listed in Table 1 and 2 (e.g., Galaxy, Bioconductor in R studio, etc.).
- Computing Environment: A computer with sufficient RAM (≥16 GB recommended) and multi-core processors for data processing.
3. Methodology:
- Step 1: Data Pre-processing: Independently pre-process the raw LC-HRMS and NMR data using established tools. For LC-HRMS, this includes peak picking, alignment, and gap filling using software like XCMS or MZmine [75]. For NMR, this includes Fourier transformation, phasing, baseline correction, and spectral binning [67].
- Step 2: Data Fusion: Create three fused datasets using the pre-processed data.
- LLDF: Concatenate the pre-processed LC-HRMS peak table and the NMR binning table into a single data matrix. Apply intra- and inter-block scaling (e.g., Pareto scaling) to equalize the contributions from each platform [67].
- MLDF: Perform dimensionality reduction (e.g., PCA) on the LC-HRMS and NMR datasets separately. Fuse the resulting principal components (e.g., first 10 PCs from each) into a new feature matrix [67].
- HLDF: Build separate classification models (e.g., PLS-DA) for the LC-HRMS and NMR data. Combine the predicted class probabilities or labels from these models using a weighted average or a meta-classifier [67].
- Step 3: Modeling & Validation: Build a classification model (e.g., PLS-DA or Random Forest) on each of the three fused datasets. Evaluate model performance using a 10-fold cross-validation and an independent test set. Key metrics should include Accuracy, Precision, Recall, and the Area Under the Curve (AUC) of the Receiver Operating Characteristic (ROC) plot.
4. Expected Outcome: The experiment will yield a quantitative comparison of the three fusion strategies. Typically, MLDF or HLDF may outperform LLDF by effectively managing the high dimensionality and heterogeneous nature of the data, though results are dataset-dependent [67].
Extended Protocol: FAIRness Evaluation of Research Software
Beyond performance, the reusability and robustness of software are critical. The FAIR4RS (Findable, Accessible, Interoperable, Reusable for Research Software) principles provide a framework for evaluation [75].
1. Objective: To assess the FAIRness of LC-HRMS data processing software to ensure transparency, reproducibility, and long-term usability in research workflows.
2. Methodology: A systematic evaluation based on criteria derived from the FAIR4RS principles [75]. Key evaluation criteria include:
- Findability (F): The software should be easy to locate with a unique, persistent identifier (e.g., DOI) and rich metadata.
- Accessibility (A): The software should be retrievable via a standardized protocol from a permanent repository.
- Interoperability (I): The software should be able to integrate with other data or applications through standardized interfaces and formats.
- Reusability (R): The software should have a clear license, detailed documentation, and be modular to facilitate reuse.
3. Data Collection & Analysis: For a given software tool, reviewers check the fulfillment of these criteria by examining its documentation, code repository (e.g., GitHub), and published papers. The results can be summarized in a scorecard.
The diagram below visualizes the logical relationships between the FAIR4RS principles and their core requirements for research software.
The Scientist's Toolkit: Essential Research Reagents and Materials
Successful data integration relies not only on software but also on access to high-quality data and reference materials. The following table details key resources for experiments involving LC-HRMS and NMR integration.
Table 3: Essential Research Reagents and Resources for Integrated Metabolomics
| Item Name | Function & Role in Integration | Specification Notes |
|---|---|---|
| Reference Metabolite Standard | Provides a known retention time (LC), mass (MS), and chemical shift (NMR) for aligning and annotating data from both platforms. Acts as a bridge for data correlation. | A mixture of certified compounds covering a range of chemical classes relevant to the study (e.g., amino acids, organic acids, lipids). |
| Stable Isotope-Labeled Internal Standards | Used for quality control, normalization, and semi-quantification in LC-MS. Helps correct for instrument variability and extraction efficiency, improving data quality for fusion. | Isotopically labeled (e.g., 13C, 15N) versions of key metabolites, added to each sample at the beginning of extraction. |
| Deuterated Solvent for NMR | Provides the lock signal for the NMR spectrometer and defines the chemical shift reference point (e.g., TMS at 0 ppm). Essential for reproducible NMR data. | High-purity D2O (for aqueous samples) or CDCl3 (for lipid extracts), containing a known concentration of a reference compound like TSP or TMS. |
| Quality Control (QC) Sample | A pooled sample from all study samples, injected repeatedly throughout the analytical run. Monitors instrument stability and is used for data pre-processing (e.g., signal correction in LC-MS). | Critical for identifying and correcting technical variance before data fusion, ensuring that integrated models reflect biological, not technical, differences. |
| Validated Public Dataset | Provides a benchmark for testing and comparing new data integration tools and fusion algorithms. | A dataset from a repository like MetaboLights with paired LC-HRMS and NMR data from a well-defined biological study. |
| Standard Reference Material | A complex, well-characterized material (e.g., NIST SRM 1950 - Plasma) used to validate entire analytical and computational workflows. | Allows labs to assess their platform's performance and the accuracy of their integrated models against consensus values. |
The orthogonal validation of LC-HRMS findings with NMR research demands robust bioinformatics strategies for data integration. As demonstrated, a range of tools from user-friendly platforms like Galaxy to highly flexible programming environments like Bioconductor can be employed, each with distinct strengths. The experimental protocols for benchmarking fusion strategies and evaluating software FAIRness provide a foundation for objective comparison. The choice of tool and fusion level—whether low-level, mid-level, or high-level data fusion—depends on the specific research question, the nature of the datasets, and the technical expertise of the team. By leveraging the frameworks and comparisons outlined in this guide, researchers and drug development professionals can make informed decisions to streamline their data integration processes, thereby extracting deeper, more reliable biological insights from their multi-platform metabolomics data.
Establishing Confidence: A Framework for Comparative Analysis and Validation
In the rigorous fields of metabolomics and pharmaceutical development, the reliability of analytical data is paramount. Liquid Chromatography-High-Resolution Mass Spectrometry (LC-HRMS) delivers exceptional sensitivity for detecting countless metabolites but can struggle with compound identification and quantification reproducibility [23] [67]. Nuclear Magnetic Resonance (NMR) spectroscopy, while less sensitive, provides unparalleled structural elucidation and precise, absolute quantification without destruction of the sample [65] [67]. The orthogonal validation of LC-HRMS findings with NMR research represents a powerful paradigm, leveraging the complementary strengths of both techniques to generate data with enhanced classification accuracy, minimized error rates, and superior confidence levels.
This guide objectively benchmarks the performance of these techniques, individually and combined, by synthesizing quantitative experimental data from recent research. It provides detailed methodologies for key experiments and visualizes the workflows that underpin this synergistic approach, offering drug development professionals a clear framework for validating their analytical results.
Performance Benchmarks: Quantitative Data Comparison
The integration of LC-HRMS and NMR leads to measurable improvements in classification performance and a reduction in error rates across various applications. The tables below summarize key benchmark metrics from recent studies.
Table 1: Benchmarking Classification Accuracy and Error Rates
| Application Context | Analytical Technique | Classification Accuracy | Error Rate | Key Performance Metrics | Citation |
|---|---|---|---|---|---|
| Amarone Wine Classification | LC-HRMS & NMR (Data Fusion) | Significantly improved predictive accuracy | 7.52% (Classification Error) | Lower error rate vs. single techniques; RV-score=16.4% (complementarity) | [16] |
| LC-HRMS alone | Provided classification | Not specified | Capable of classification based on withering time and yeast | [16] | |
| NMR alone | Provided classification | Not specified | Capable of classification based on withering time and yeast | [16] | |
| Coffee Authentication | LC-HRMS Fingerprinting | 100% (Arabica vs. Robusta) | Calibration error: <2.7%; Prediction error: <11.6% for adulteration | Detected adulteration down to 15% level | [76] |
| Monoclonal Antibody Glycosylation | HRMS (MAM) | High agreement on major glycoforms | Not specified | High precision, site-specific information | [21] |
| NMR (Middle-Down) | High agreement on major glycoforms | Not specified | Quantifies monosaccharides; non-destructive | [21] | |
| HILIC-FLD (Conventional) | High agreement on major glycoforms | Not specified | Standard method for quality control | [21] |
Table 2: Impact of Data Fusion Strategies on Model Performance
| Fusion Level | Description | Impact on Performance and Interpretability | Key Applications |
|---|---|---|---|
| Low-Level | Concatenation of raw/pre-processed data matrices | Improves model robustness; Risk of dominance by high-variance blocks requires careful intra- and inter-block scaling [23] [67]. | General purpose integration |
| Mid-Level | Concatenation of features extracted from each dataset (e.g., PCA scores) | Overcomes high dimensionality; enhances interpretability by focusing on most relevant features from each platform [23] [67]. | Exploratory analysis, pattern recognition |
| High-Level | Combination of model outputs or decisions (e.g., PLS-DA, consensus rules) | Combines model outputs; reduces uncertainty of final result; preserves interpretability of individual model contributions [23]. | Authentication, quality assurance |
Experimental Protocols for Orthogonal Validation
To achieve the benchmarks outlined above, robust and reproducible experimental protocols are essential. The following section details the core methodologies employed in the cited research.
Protocol 1: Multi-Omics Data Fusion for Food Authentication
This protocol, derived from the classification of Amarone wines, outlines the process for fusing LC-HRMS and NMR data to achieve high classification accuracy [16].
- Sample Preparation: 80 Amarone wine samples were analyzed with minimal pre-treatment to preserve the native metabolome.
- LC-HRMS Analysis:
- Chromatography: Reversed-phase C18 column with acidified water and organic solvent gradient.
- Mass Spectrometry: High-resolution mass analyzer (e.g., Orbitrap); full scan mode (e.g., m/z 100-1500); electrospray ionization (ESI) in positive and/or negative modes.
- NMR Analysis:
- Spectroscopy: 600 MHz spectrometer.
- Sample Handling: Phosphate buffer in D₂O added for lock signal; TSP used as internal standard for chemical shift referencing and quantification.
- Data Processing:
- LC-HRMS: Peak picking, alignment, and normalization using software (e.g., XCMS, MZmine).
- NMR: Fourier transformation, phasing, baseline correction, and spectral binning (e.g., to 0.04 ppm regions).
- Data Fusion and Multivariate Analysis:
- Fusion: Datasets are fused at low- or mid-level, often after Pareto scaling.
- Modeling: Unsupervised exploration (e.g., Multi-block Principal Component Analysis) followed by supervised classification (e.g., sparse Partial Least Squares-Discriminant Analysis, sPLS-DA) to build predictive models and identify discriminant metabolites.
Protocol 2: SYNHMET for Personalized Metabolic Profiling
The SYnergic use of NMR and HRMS for METabolomics (SYNHMET) protocol focuses on achieving accurate concentration for a large number of metabolites in biofluids like urine, without absolute reliance on analytical standards [65].
- Parallel Analysis: The same biofluid sample (e.g., urine from healthy, chronic cystitis, and bladder cancer patients) is split and analyzed by both ¹H-NMR (600 MHz) and UHPLC-HRMS (Orbitrap, HILIC/RP chromatography).
- Initial NMR Deconvolution: NMR spectra are deconvoluted using a database of reference metabolite signals (e.g., Chenomx) to obtain a first approximation of metabolite concentrations.
- HRMS Peak Correlation: For each metabolite, all HRMS chromatographic peaks with an accurate mass match (<5 ppm) are identified.
- Correlation Analysis: The initial NMR-derived concentrations are correlated with the intensities of the matched HRMS peaks across the sample cohort.
- Concentration Refinement: The HRMS peak with the strongest correlation to the NMR data is unambiguously assigned to the metabolite. Its intensity is then used to refine and correct the metabolite's concentration, leveraging the quantitative strength of NMR and the sensitivity of HRMS.
Protocol 3: Glycosylation Analysis of Therapeutic Proteins
This protocol benchmarks HRMS and NMR against conventional HILIC-FLD for analyzing the critical quality attribute of N-glycosylation on monoclonal antibodies [21].
- Sample Preparation (Released Glycans):
- Enzymatic release of N-glycans from the mAb using PNGase F.
- Purification and fluorescent labeling (e.g., with 2-AB).
- Analysis by HILIC-FLD for conventional profiling.
- HRMS Workflows:
- Intact Mass Analysis: Buffer exchange of the mAb and direct infusion or LC-MS analysis on a high-resolution mass spectrometer (e.g., Q-Exactive Orbitrap). Data deconvolution provides information on glycoform distribution.
- Multi-Attribute Method (MAM): Tryptic digestion of the mAb to generate peptides and glycopeptides. LC-MS analysis allows for site-specific quantification of glycoforms and other post-translational modifications.
- NMR Analysis (Middle-Down):
- Enzymatic cleavage of the mAb into Fc and Fab fragments.
- Denaturation of the Fc fragment and analysis by NMR to generate a "monosaccharide fingerprint" for indirect profiling of the glycan distribution.
- Data Comparison: The relative abundances of major glycoforms and monosaccharide components are compared across all methods to assess agreement and identify relative advantages.
Visualizing Experimental Workflows
The following diagrams illustrate the logical flow of the key experimental protocols described above, highlighting the points of integration between LC-HRMS and NMR.
Diagram 1: Data Fusion and Synergy Workflows
Diagram 2: Orthogonal Methods and Data Fusion
The Scientist's Toolkit: Essential Research Reagents and Materials
Successful orthogonal validation relies on a suite of specific reagents, software, and analytical platforms. The following table catalogs key solutions used in the featured experiments.
Table 3: Essential Research Reagent Solutions for LC-HRMS/NMR Integration
| Category | Item | Function / Application | Representative Use |
|---|---|---|---|
| Chromatography | C18 Reversed-Phase Column | Separation of complex metabolite mixtures prior to HRMS detection. | Coffee authentication [76], Lotus cultivar profiling [77] |
| HILIC Column | Separation of polar compounds (e.g., glycans, organic acids). | Urine metabolomics (SYNHMET) [65] | |
| Mass Spectrometry | Orbitrap Mass Analyzer | High-resolution mass detection for accurate m/z measurement and untargeted fingerprinting. | Coffee authentication [76], Plant metabolomics [78] |
| NMR Spectroscopy | D₂O Solvent with Buffer | Provides NMR lock signal and controls pH for consistent chemical shifts. | Amarone wine classification [16], SYNHMET [65] |
| Internal Standard (e.g., TSP) | Chemical shift referencing and quantitative calibration in NMR. | Amarone wine classification [16] | |
| Sample Preparation | PNGase F Enzyme | Releases N-glycans from glycoproteins for subsequent analysis. | mAb glycosylation profiling [21] |
| Fluorescent Label (2-AB) | Tags released glycans for sensitive detection in HILIC-FLD. | mAb glycosylation profiling [21] | |
| Software & Data Analysis | XCMS, MZmine, MS-DIAL | Open-source software for LC-HRMS data processing, peak picking, and alignment. | Metabolomics data processing [75], Time-trend analysis [79] |
| Multivariate Analysis Tools | Software/Packages for PCA, PLS-DA, and multi-block data fusion. | Data fusion and classification models [16] [23] |
The strategic integration of LC-HRMS and NMR spectroscopy represents a gold standard for validation in complex analytical scenarios. As the benchmark data demonstrates, this orthogonal approach consistently results in higher classification accuracy and lower error rates compared to single-technique analyses. The synergy between the techniques—combining the broad sensitivity of LC-HRMS with the structural and quantitative rigor of NMR—generates a level of confidence that is unattainable by either method alone. For researchers and drug development professionals, adopting these fused workflows is not merely an optimization but a necessity for ensuring data integrity, robust biomarker discovery, and rigorous quality control of biopharmaceuticals.
Comparative Analysis of Stand-Alone vs. Fused Data Models
In the fields of metabolomics and pharmaceutical development, the quest for comprehensive chemical profiling necessitates the use of multiple analytical techniques, primarily liquid chromatography-high-resolution mass spectrometry (LC-HRMS) and nuclear magnetic resonance (NMR) spectroscopy. While each method is powerful in isolation, a paradigm shift towards integrating their complementary data is underway. This guide objectively compares the performance of stand-alone analytical models against fused data frameworks, providing researchers and drug development professionals with an evidence-based resource for selecting appropriate methodologies. The analysis is contextualized within the critical need for orthogonal validation, where findings from one technique are verified by another, to enhance the reliability of results in complex biological and pharmaceutical matrices.
Performance Comparison: Stand-Alone vs. Fused Data Models
Empirical studies across food, plant, and clinical metabolomics consistently demonstrate that fused data models, which integrate information from LC-HRMS and NMR, outperform stand-alone approaches in classification accuracy, robustness, and metabolic coverage.
Table 1: Quantitative Performance Metrics of Stand-Alone vs. Fused Models
| Application / Study | Analytical Technique(s) | Key Performance Metric | Stand-Alone Model Performance | Fused Data Model Performance |
|---|---|---|---|---|
| Salmon Authenticity [35] | REIMS & ICP-MS | Classification Accuracy | Not possible with single-platform methods | 100% (Cross-validation) |
| Amarone Wine Classification [16] | LC-HRMS & 1H NMR | Classification Error Rate | Higher (individual techniques) | 7.52% |
| Hazelnut Metabolomics [31] | 1H-NMR & LC-HRMS | Classification & Information Depth | Adequate for origin/cultivar | Enhanced information and robustness |
| Personalized Metabolic Profiling (SYNHMET) [65] | NMR & UHPLC–HRMS | Number of Quantified Metabolites in Urine | ~50 (NMR alone); Thousands with missing values (MS) | 165 metabolites with minimum missing values |
The synergies created by data fusion are evident. For instance, in a study authenticating the geographical origin and production method of salmon, a mid-level data fusion approach of mass spectrometry data achieved a cross-validation classification accuracy of 100%, a feat reported as impossible using single-platform methods [35]. Similarly, the classification of Amarone wines based on grape withering time and yeast strain was significantly improved, with the fused model achieving a lower error rate (7.52%) than models based on individual LC-HRMS or 1H NMR datasets [16].
Beyond accuracy, fusion addresses fundamental limitations of each stand-alone technique. The SYNHMET strategy, for example, synergistically uses NMR and HRMS to accurately quantify 165 metabolites in human urine, overcoming NMR's limited quantifiable metabolites and MS's issues with reproducibility and missing values [65]. This creates a more complete and reliable personalized metabolic profile.
Methodological Approaches to Data Fusion
Data fusion strategies are categorized based on the stage at which data from different sources are integrated. The choice of strategy involves a trade-off between the richness of feature interaction and computational simplicity.
Fusion Levels and Workflows
The three primary levels of fusion are low-level, mid-level, and high-level (also referred to as early, intermediate, and late fusion) [80] [23] [81].
Diagram 1: Data Fusion Workflow Levels
Technical Comparison of Fusion Strategies
Each fusion level has distinct advantages, disadvantages, and optimal use cases, which are critical for experimental design.
Table 2: Technical Comparison of Data Fusion Strategies
| Feature | Low-Level (Early) Fusion | Mid-Level (Intermediate) Fusion | High-Level (Late) Fusion |
|---|---|---|---|
| Definition | Combines raw data or pre-processed data matrices before modeling [23]. | Combines extracted features (e.g., from PCA) into a single matrix for modeling [23]. | Combines predictions or decisions from independent models [80] [23]. |
| Data Handling | Direct integration at the input level. | Integration of feature-level representations. | Integration at the decision or output level. |
| Inter-Modal Interaction | High; allows direct interaction between modalities during learning. | High; can capture complex relationships in latent representations. | Limited; models work separately until the final step. |
| Advantages | Simple concept; potential for rich feature representation [80]. | Reduces dimensionality; balances detail and model complexity [23] [35]. | Modular; easy to add/remove modalities; robust to missing data [80] [81]. |
| Disadvantages | Prone to high dimensionality and curse of dimensionality [80]. | Requires careful feature extraction for each modality. | May miss complex inter-modal interactions [80]. |
| Typical Use Cases | Combining similar data types or pre-processed sensor data. | Most common in analytical chemistry; fusing diverse platforms like NMR and MS [23] [35]. | Ensemble models; when modalities are very heterogeneous [80]. |
Mid-level fusion is particularly prevalent in chemometric studies combining NMR and MS. It effectively reduces the high dimensionality of the original data blocks (e.g., spectral bins) by first extracting relevant features from each platform before concatenation and final modeling, thus avoiding the "curse of dimensionality" associated with low-level fusion [23] [35]. High-level fusion offers maximum flexibility and is inherently robust, as models for each data type are built independently [81].
Experimental Protocols for Data Fusion
Implementing a fused data model requires a structured workflow from sample preparation to data analysis. The following protocol is synthesized from key studies [16] [65] [35].
Sample Preparation and Data Acquisition
- Sample Collection and Metabolite Extraction: Collect biological samples (e.g., urine, plasma, plant tissue, food products) under standardized conditions. Employ a metabolite extraction protocol suitable for both LC-HRMS and NMR analysis. A common approach involves using a hydro-organic solvent like methanol-water to precipitate proteins and extract a broad range of polar and semi-polar metabolites.
- LC-HRMS Analysis:
- Chromatography: Utilize Reversed-Phase (RP) chromatography for medium to non-polar metabolites and Hydrophilic Interaction Liquid Chromatography (HILIC) for polar metabolites to broaden metabolome coverage [65].
- Mass Spectrometry: Acquire data using a high-resolution mass spectrometer (e.g., Orbitrap, Q-TOF) in both positive and negative ionization modes to maximize feature detection.
- NMR Spectroscopy:
- Sample Preparation: Mix a portion of the extract with a deuterated phosphate buffer (e.g., D₂O, pH 7.4) containing a internal standard for chemical shift referencing and quantification.
- Data Acquisition: Acquire 1D ¹H-NMR spectra on a high-field spectrometer. Suppression of the water signal is critical. 2D J-resolved NMR spectra can be acquired to assist in deconvoluting overlapping signals [78].
Data Preprocessing and Fusion Analysis
- LC-HRMS Data Preprocessing: Process raw data to identify and align chromatographic peaks, correct baselines, and pick features (characterized by m/z and retention time). Perform peak table data reduction by grouping features related to the same analyte and integrate the area of the chromatographic peak.
- NMR Data Preprocessing: Process FIDs by applying Fourier transformation, phase and baseline correction. Segment the spectrum into bins and integrate the area under the bin to obtain a data table suitable for multivariate analysis.
- Data Fusion and Multivariate Modeling:
- Normalization and Scaling: Normalize data to account for differences in overall concentration. Apply Pareto or Unit Variance scaling to equalize the contribution of variables from different platforms [23].
- Feature Extraction & Fusion: For a mid-level fusion, use Principal Component Analysis (PCA) on each dataset (NMR and MS) separately to reduce dimensionality. Concatenate the resulting scores from both platforms to create a fused data matrix [23] [35].
- Supervised Modeling: Apply a supervised method like Partial Least Squares-Discriminant Analysis (PLS-DA) or the Data Integration Analysis for Biomarker discovery using Latent variable approaches for Omics studies (DIABLO) framework to the fused matrix to build a classification or regression model [31]. DIABLO is specifically designed for multi-omics data to identify correlated variables across datasets and maximize class discrimination.
Diagram 2: Experimental and Fusion Analysis Workflow
The Scientist's Toolkit: Essential Research Reagents and Materials
Successful implementation of fused LC-HRMS and NMR models requires specific reagents and analytical resources.
Table 3: Essential Research Reagents and Materials
| Item | Function / Application |
|---|---|
| Deuterated Solvents (D₂O, CD₃OD) | Used as the NMR solvent to provide a locking signal and for field frequency stabilization; also used to suppress the water signal in NMR spectroscopy [65]. |
| Internal Standards (e.g., TSP, DSS) | Added to NMR samples as a chemical shift reference (e.g., calibrated to 0 ppm) and for quantitative concentration determination [65]. |
| LC-MS Grade Solvents | High-purity solvents (water, methanol, acetonitrile) for mobile phase preparation to minimize background noise and ion suppression in LC-HRMS. |
| Chromatography Columns | Columns for Reversed-Phase (C18) and Hydrophilic Interaction (HILIC) liquid chromatography to achieve separation of a wide range of metabolites [65]. |
| Standard Compounds | Authentic chemical standards for confirming the identity of metabolites putatively annotated via NMR or MS databases. |
| Data Analysis Software | Platforms like R (with mixOmics, MetaboAnalystR), Python, or commercial software (e.g., SIMCA, Chenomx) for data preprocessing, fusion, and multivariate statistical analysis [23] [31]. |
The comparative analysis unequivocally demonstrates that fused data models provide a superior analytical framework compared to stand-alone techniques for orthogonal validation in LC-HRMS and NMR research. The integration of complementary data through mid-level fusion strategies delivers tangible benefits in classification accuracy, robustness, and the depth of metabolic information extracted from complex samples. For researchers and drug development professionals, adopting a fused model approach is paramount for enhancing the reliability of findings, ensuring rigorous quality control, and driving innovation in biomarker discovery and product authentication.
The comprehensive analysis of the metabolome presents a significant challenge due to the vast chemical diversity of metabolites. While techniques like Liquid Chromatography-High Resolution Mass Spectrometry (LC-HRMS) and Nuclear Magnetic Resonance (NMR) spectroscopy are powerful, they individually possess limitations in sensitivity, coverage, and quantification accuracy. This guide objectively compares the performance of these standalone techniques against their synergistic combination via data fusion. Experimental data demonstrates that integrating LC-HRMS and NMR through various fusion strategies significantly enhances metabolite identification, improves quantification accuracy, and provides more robust biological classification, thereby offering superior orthogonal validation for research and drug development.
Metabolomics aims to provide a comprehensive measurement of all metabolites and low-molecular-weight molecules (≤ 1500 Da) in a biological specimen, capturing a snapshot of biological processes that is closest to the phenotype [82]. However, the immense chemical heterogeneity of the metabolome makes its comprehensive analysis notoriously difficult. No single analytical platform can fully resolve this complexity.
The two most prominent techniques, LC-HRMS and NMR, offer complementary strengths and weaknesses. LC-HRMS is highly sensitive, capable of detecting thousands of metabolic features at various concentration ranges, but it can struggle with metabolite identification, quantification reproducibility, and the analysis of isomers and highly polar compounds [65] [83]. Conversely, NMR spectroscopy is non-destructive, highly reproducible, provides unambiguous structural information, and excels at quantifying sugars, organic acids, and other polar substances, but it has a lower sensitivity, limiting its coverage to a portion of the metabolome [84] [65].
The core thesis of this guide is that the orthogonal validation of LC-HRMS findings with NMR research—through strategic data fusion—does not merely combine datasets but creates a synergistic analytical framework. This fusion mitigates the individual weaknesses of each technique, leading to a more complete, accurate, and reliable metabolic profile, which is crucial for informed decision-making in scientific and drug development contexts.
Quantitative Comparison: Standalone Techniques vs. Fused Data
The superiority of a fusion approach is not merely theoretical; it is substantiated by quantitative benchmarks across multiple studies, spanning improvements in metabolite coverage, identification confidence, and classification accuracy.
Table 1: Quantitative Improvements in Metabolite Coverage and Identification via Data Fusion
| Study & Application | LC-HRMS Alone | NMR Alone | Data Fusion Approach | Fusion Outcome |
|---|---|---|---|---|
| Urine Metabolite Profiling (SYNHMET) [65] | ~50 metabolites (strongly quantifiable) [65] | 165 metabolites | Synergistic NMR & HRMS deconvolution | 165 metabolites quantified with high accuracy, >3x increase vs. NMR alone. |
| Amarone Wine Classification [16] | Provided classification | Provided classification | Multi-omics (LC-HRMS & NMR) integration | Lower classification error rate (7.52%), providing a much broader metabolome characterization. |
| Zingiberaceae Spices Classification [83] | OPLS-DA model explained ~30% of variation | N/A | Mid-level spectral data fusion (NIR & MIR) | Classification accuracy reached 100%, outperforming single-platform models. |
| Hazelnut Quality Prediction [85] | Predictive models from single fractions | Predictive models from single fractions | Supervised Mid-Level Data Fusion (SMLDF) | Outperformed predictive accuracy of any single-fraction analysis. |
Beyond expanding coverage, data fusion enhances the fundamental confidence in metabolite identification. Forshed et al. highlighted that fusion improves classification, especially in unsupervised models, by leveraging complementary information [86]. For instance, a compound not retained on an LC column or not easily ionizable for MS might be clearly detected by NMR, and vice-versa, a metabolite present at low concentration might be below the detection limit of NMR but readily quantifiable by LC-HRMS [86]. This orthogonal verification is a cornerstone of robust biomarker discovery and validation.
Experimental Protocols for Data Fusion
The successful implementation of a fusion strategy relies on rigorous experimental protocols, from sample preparation to data integration. Below are detailed methodologies for key steps.
Sample Preparation and Metabolite Extraction
Optimal sample preparation is critical for generating representative data from both platforms.
Protocol: Optimized Metabolite Extraction from Adherent Cells [84]
- Cell Harvesting: Direct scraping into a pre-cooled organic solvent (e.g., 50% methanol) is superior to trypsinization, as the enzymatic process can cause metabolite leakage and alter the metabolic profile.
- Extraction: A one-phase system using 80% methanol, methanol-chloroform, or methyl-tert-butyl ether (MTBE) has shown high efficiency for a wide range of intracellular metabolites from human mesenchymal stem cells (e.g., HDFa, DPSCs).
- Quenching and Processing: Cells are washed with cold PBS (4°C) and scraped directly into the extractant. The lysate is then sonicated, incubated at -20°C for 20 minutes, and centrifuged at 14,000× g at 4°C. The supernatant containing the metabolites is stored at -80°C prior to analysis.
Protocol: Plasma/Serum Preparation for Blood Metabolomics [82]
- Matrix Choice: Plasma is generally recommended over serum as it demonstrates better performance in metabolomics approaches combined with methanol-based extraction methods.
- Extraction Method: Protein precipitation with cold methanol provides a broad specificity and outstanding accuracy. For an even broader coverage, combining methanol-based precipitation with solid-phase extraction (SPE) methods shows high orthogonality, though this must be balanced against increased time, sample consumption, and potential reproducibility issues.
The SYNHMET Workflow: A Fusion Paradigm
The SYNHMET (SYnergic use of NMR and HRMS for METabolomics) strategy provides a robust protocol for fusing data to achieve accurate concentration of a high number of compounds without analytical standards [65].
- Parallel Analysis: The same sample is analyzed by both
H-NMR(e.g., 600 MHz) andUHPLC-HRMS(e.g., Orbitrap-based) with multiple chromatographic conditions (e.g., Reversed-Phase and HILIC). - Initial NMR Deconvolution: NMR spectra are initially deconvoluted using a database of known chemical shifts (e.g., Chenomx) to obtain a first approximation of metabolite concentrations.
- HRMS-Assisted Peak Assignment: The initial concentration estimates from NMR are correlated with the intensities of MS-detected peaks that match the accurate mass of the metabolites. The MS feature showing the highest correlation with the NMR concentration is identified.
- Concentration Refinement: The intensity of the correctly assigned MS chromatographic peak is converted into a concentration value using the correlation slope. This MS-derived concentration is then used to constrain and refine the final round of NMR spectral deconvolution, yielding a highly accurate concentration value that leverages the strengths of both techniques.
Data Fusion Strategies and Modeling
The fusion of data from LC-HRMS and NMR can occur at different levels, each with specific advantages [86].
- Low-Level Data Fusion (LLDF): The raw or pre-processed data vectors from each platform (e.g., NMR spectral bins and LC-MS peak intensities) are simply concatenated into a single large matrix before multivariate statistical analysis. Block scaling (e.g., weighting blocks to equal sums of standard deviations) is often required [85] [86].
- Mid-Level Data Fusion (MLDF): Feature selection is performed on each data block separately. Only the most relevant variables (e.g., identified via Variable Importance in Projection (VIP) scores) are then fused for the final analysis. This can be unsupervised or supervised and often yields superior classification performance [83] [85].
- High-Level Data Fusion (HLDF): Also known as decision-level fusion, this approach involves building separate models for each data platform and then fusing the model outputs (e.g., scores from a PCA model). Hierarchical modeling is a common implementation of this strategy [86].
Table 2: Key Data Fusion Strategies and Their Applications
| Fusion Level | Description | Advantages | Best-Suited Applications |
|---|---|---|---|
| Low-Level (LLDF) | Concatenation of raw or pre-processed data. | Simple to implement; retains all original information. | Exploratory analysis when prior knowledge is limited. |
| Mid-Level (MLDF) | Fusion of selected features from each platform. | Reduces data dimensionality; improves model performance and interpretability. | Classification and prediction tasks (e.g., sample origin, quality). |
| High-Level (HLDF) | Fusion of model outputs/scores from each platform. | Allows for different modeling of each data block; robust to platform-specific noise. | Verifying trends and classifying complex sample sets. |
The Scientist's Toolkit: Essential Research Reagents and Materials
A successful fusion experiment depends on high-quality materials and reagents. The following table details essential items for a typical workflow based on the cited protocols.
Table 3: Essential Research Reagent Solutions for LC-HRMS and NMR Fusion
| Item | Function / Application | Example from Literature |
|---|---|---|
| LC/MS Grade Solvents (Methanol, Acetonitrile, Water) | Mobile phase preparation and metabolite extraction; critical for minimizing background noise in MS. | Used in plasma protein precipitation and for scraping adherent cells [84] [82]. |
| Deuterated NMR Solvent (e.g., D₂O) | Provides the lock signal for stable NMR acquisition. | Essential for urine and biofluid NMR profiling [65]. |
| Internal Standards (e.g., Succinic acid-²,³-¹³C₂, TSP-d₄ for NMR) | Normalization and quality control; corrects for instrumental variance. | Used for data quality control in plasma/serum metabolomics [82]. |
| Solid-Phase Extraction (SPE) Cartridges | Phospholipid removal and sample clean-up; reduces matrix effects in MS. | Phree phospholipid removal tubes used in hybrid-SPE protocols [82]. |
| Standard Compound Mixes | Metabolite identification and calibration. | Thirty-three metabolomics organic acids mix for semi-targeted approaches [82]. |
Conceptual Workflows and Signaling Pathways
The following diagrams illustrate the logical relationships and workflows described for data fusion in metabolomics.
Diagram 1: Data Fusion Conceptual Workflow
Diagram 2: SYNHMET Workflow for Accurate Quantification
The experimental data and protocols presented in this guide unequivocally demonstrate that the fusion of LC-HRMS and NMR data delivers quantifiable value over the use of either technique in isolation. The synergy between the high sensitivity of LC-HRMS and the structural precision and quantitative robustness of NMR results in a significant expansion of metabolome coverage, more confident metabolite identification, and the creation of more accurate and reliable classification models.
For researchers and drug development professionals, adopting a fusion approach is no longer just an advanced option but a strategic necessity for orthogonal validation. It enhances the reliability of biomarkers, provides a deeper understanding of biological systems, and ultimately supports better decision-making in both research and clinical applications. By implementing the detailed experimental protocols and fusion strategies outlined herein, scientists can fully leverage the complementary power of modern analytical platforms to unravel the complexity of the metabolome.
In regulated industries such as pharmaceuticals and food safety, demonstrating the accuracy and reliability of analytical data is paramount. Regulatory submissions for drug approvals or food authentication dossiers require robust scientific evidence that analytical methods are precisely controlled, accurate, and reproducible. Within this framework, the orthogonal validation of findings—where two or more technically distinct methods confirm the same result—substantially enhances data confidence and regulatory acceptance. Liquid Chromatography-High Resolution Mass Spectrometry (LC-HRMS) and Nuclear Magnetic Resonance (NMR) spectroscopy represent two powerful but fundamentally different analytical platforms. This guide objectively compares their performance and illustrates how their synergistic application creates a compelling validation package that meets stringent regulatory standards.
Technical Comparison: LC-HRMS and NMR as Orthogonal Techniques
The complementary nature of LC-HRMS and NMR stems from their underlying physical principles. LC-HRMS separates compounds and provides information on their exact mass and fragmentation pattern, while NMR probes the magnetic environment of atomic nuclei, revealing detailed structural connectivity. The following table summarizes their core characteristics.
Table 1: Core Technical Characteristics of LC-HRMS and NMR
| Feature | LC-HRMS | NMR |
|---|---|---|
| Principle of Detection | Mass-to-charge ratio of ionized molecules [30] [67] | Magnetic properties of atomic nuclei (e.g., ^1H, ^13C) in a magnetic field [65] [67] |
| Primary Information | Accurate mass, isotopic pattern, fragment ions [30] [27] | Chemical shift, J-coupling, signal intensity [65] [21] |
| Sensitivity | High (pico- to nanomolar) [67] [87] | Moderate (micromolar) [65] [67] |
| Quantification | Semi-quantitative; requires internal standards for accuracy [67] [87] | Highly accurate and absolute without calibration curves [65] [67] |
| Key Strength | High sensitivity, broad metabolite coverage, specific detection [30] [67] | Non-destructive, provides definitive structural elucidation, inherently quantitative [65] [67] [21] |
| Key Limitation | Indirect structural information, matrix effects, semi-quantitative [30] [67] | Lower sensitivity, signal overlap in complex mixtures [12] [65] |
This orthogonality is critical for validation. A compound identified by its exact mass and retention time in LC-HRMS and subsequently by its unique proton network in NMR has been confirmed through two independent physical properties, drastically reducing the chance of misidentification.
Experimental Protocols for Orthogonal Analysis
Implementing a coherent workflow that integrates both techniques is essential for generating mutually reinforcing data. The following protocols outline a standardized approach for analyzing a complex sample, such as a plant extract or a biofluid, to support regulatory submissions.
Sample Preparation Workflow
Consistent sample preparation is the foundation for any valid analytical comparison.
- Sample Homogenization: The sample (e.g., plant material, food commodity, or biological fluid) is first homogenized to ensure a representative aliquot [27].
- Metabolite Extraction: A hydroalcoholic solvent (e.g., methanol/water mixture) is commonly used for broad-range metabolite extraction from plant or food matrices [27] [78]. For biofluids like urine, simple dilution or protein precipitation may be sufficient [65] [87].
- Splitting and Drying: The total extract is split into two equal portions. Each portion is dried under a gentle stream of nitrogen or in a vacuum concentrator.
- Reconstitution: One dried portion is reconstituted in a solvent compatible with LC-HRMS (e.g., water/methanol with 0.1% formic acid). The other portion is reconstituted in a deuterated NMR solvent (e.g., D₂O or deuterated methanol) containing a reference standard like TSP (trimethylsilylpropanoic acid) for chemical shift referencing and quantification [65] [78].
LC-HRMS Analysis Protocol
- Chromatography: Employ a reversed-phase UHPLC system with a C18 column (e.g., 2.1 x 100 mm, 1.7 µm). Use a binary gradient of water (A) and acetonitrile or methanol (B), both modified with 0.1% formic acid, to enhance ionization. The gradient typically runs from 5% B to 95% B over 10-20 minutes, followed by a wash and re-equilibration step [27] [87].
- Mass Spectrometry: Data is acquired using an HRMS instrument such as an Orbitrap or Q-TOF mass analyzer. The analysis should be performed in both positive and negative electrospray ionization (ESI) modes to maximize metabolite coverage. The method should include:
- Data Processing: Raw data is processed using software (e.g., Compound Discoverer, XCMS) for peak picking, alignment, and deconvolution. Metabolites are tentatively identified by matching the accurate mass (± 5 ppm) and MS/MS spectra against databases like mzCloud or HMDB [27]. Confidence levels for identification follow the Metabolomics Standards Initiative (MSI) guidelines [27].
NMR Spectroscopy Analysis Protocol
- Data Acquisition: NMR spectra are acquired on a spectrometer operating at 600 MHz for ^1H observation or higher. Standard experiments include:
- 1D ^1H NMR: A simple pulse sequence with water suppression (e.g., presaturation) is used. A sufficient number of transients (64-128) are collected to achieve a good signal-to-noise ratio [65] [78].
- 2D J-Resolved (JRES): This experiment separates chemical shift and J-coupling, simplifying the interpretation of complex overlapped regions in the 1D spectrum [78].
- 2D ^1H-^13C HSQC/HMBC: For deeper structural elucidation of unknown compounds, these correlation maps connect protons to their directly bonded and long-range carbon atoms, respectively [88].
- Data Processing and Analysis: The Free Induction Decay (FID) is processed with exponential line broadening (0.3-1.0 Hz) and Fourier transformation. Spectra are referenced to the internal standard (TSP at 0.0 ppm). Spectral bins are created, and multivariate statistical analysis (e.g., PCA) can be performed to identify significant biomarkers [12] [78]. Compounds are identified by comparing chemical shifts and coupling constants to reference databases like BMRB or Chenomx [65].
The following workflow diagram visualizes the synergistic relationship between these two analytical processes.
Application in Regulatory Scenarios: Case Studies and Data Fusion
Pharmaceutical Development: Biosimilar Glycosylation Analysis
A critical requirement for biosimilar approval is demonstrating similarity in post-translational modifications, such as glycosylation, which impact drug efficacy and safety [21]. A comparative study of the innovator drug Rituxan and a proposed biosimilar used a panel of orthogonal methods, including HILIC-FLD, HRMS, and NMR, to characterize N-glycan profiles.
Table 2: Orthogonal Methods for Monoclonal Antibody Glycosylation Analysis
| Analytical Method | Technique Principle | Key Data Output | Role in Orthogonal Validation |
|---|---|---|---|
| Released Glycan HILIC-FLD | Chromatographic separation of fluorescently labeled glycans [21] | Relative quantification of major glycoforms [21] | Establishes the baseline glycan distribution profile. |
| HRMS (Intact & Peptide Level) | Accurate mass measurement of intact mAbs or glycopeptides [21] | Confirmation of glycan mass and site-specific occupancy [21] | Confirms the molecular weight and identity of glycoforms observed by HILIC-FLD. |
| Middle-Down NMR | Analysis of isotopic chemical shifts from isolated Fc domains [21] | Quantification of monosaccharide constituents (e.g., galactose) [21] | Provides orthogonal, quantitative data on carbohydrate content, confirming trends from chromatographic and MS data. |
The study concluded that while HRMS provided high precision for specific glycoforms, NMR offered complementary quantitative information on monosaccharide composition. The agreement across all methods for major glycoforms significantly increased confidence in the final analytical comparability assessment submitted to regulators [21].
Food Authentication: Geographic Origin Verification
Foodomics leverages advanced analytics to combat fraud related to the geographic or botanical origin of high-value products. A study on Greek table olives (Kalamon, Konservolia cultivars) effectively demonstrated this.
Researchers performed untargeted metabolomics using both UPLC-HRMS/MS and ^1H NMR on the same set of olive samples [12]. The two datasets were integrated using a multilevel approach and Statistical HeterospectroscopY (SHY), which identifies correlations between signals from the two different platforms across a sample set [12] [65]. This fusion allowed researchers to pinpoint biomarkers like phenyl alcohols, flavonoids, and secoiridoids with higher confidence. The combined model provided a more robust classification of olives based on geographical and botanical origin than either technique alone, creating a powerful authentication tool acceptable for regulatory quality control [12].
The Scientist's Toolkit: Essential Reagent Solutions
Successful implementation of these protocols requires specific high-quality reagents and materials.
Table 3: Essential Research Reagents for LC-HRMS and NMR Metabolomics
| Item | Function | Example Use Case |
|---|---|---|
| Deuterated NMR Solvents | Provides a magnetic field lock and deuterium signal for shimming; does not produce interfering ^1H signals [65]. | Dissolving samples for ^1H NMR analysis (e.g., D₂O, CD₃OD) [78]. |
| Internal Standards (NMR) | Provides a reference peak for chemical shift (δ = 0 ppm) and enables absolute quantification [65]. | TSP (Trimethylsilylpropanoic acid) added to every sample in NMR analysis [65]. |
| Stable Isotope-Labeled Internal Standards (MS) | Corrects for matrix-induced ionization suppression/enhancement and losses during sample preparation, improving quantitative accuracy [87]. | ^13C- or ^2H-labeled amino acids added to biofluids prior to LC-HRMS analysis [87]. |
| LC-MS Grade Solvents | Minimizes chemical noise and ion suppression in the mass spectrometer, ensuring high-sensitivity detection [27]. | Preparing mobile phases for UHPLC separation [27] [87]. |
| Chemical Derivatization Kits | Enhances detection (e.g., fluorescence, MS ionization) of specific analyte classes. | 2-AB labeling for sensitive HILIC-FLD analysis of released N-glycans [21]. |
LC-HRMS and NMR are not competing technologies but rather powerful allies in the quest for regulatory compliance. LC-HRMS offers high sensitivity and specific detection for broad metabolome coverage, while NMR provides unparalleled structural elucidation and absolute quantification in a non-destructive manner. By adopting integrated workflows and data fusion strategies like SHY [12] [65], scientists can generate a comprehensive and orthogonal validation package. This synergistic approach delivers the highest level of confidence in analytical results, effectively supporting drug submissions to agencies like the FDA and EMA and strengthening food authentication claims in the global marketplace.
Best Practices for Reporting Orthogonally Validated Findings
Orthogonal validation is a fundamental principle in analytical science that involves verifying results using two or more independent methods based on different physical or chemical principles. This approach is particularly critical in pharmaceutical and clinical research, where the accuracy and reliability of data directly impact drug development and patient safety. The core strength of orthogonal validation lies in its ability to control for methodological biases and provide conclusive evidence of result validity by cross-referencing antibody-dependent experiments with data derived from non-antibody-based methods [18]. When liquid chromatography-high resolution mass spectrometry (LC-HRMS) findings are validated with nuclear magnetic resonance (NMR) spectroscopy, researchers leverage the complementary strengths of both techniques: LC-HRMS provides exceptional sensitivity and specificity, while NMR offers unparalleled structural elucidation capabilities and inherent quantitative properties without requiring identical standards [11].
The practice of orthogonal validation has gained significant traction across biological research and development. A 2024 study highlighted how combining multiple orthogonal analytical techniques significantly increases confidence in glycan characterization for monoclonal antibody therapeutics [10]. Similarly, in antibody development, suppliers have reported conducting over 14,000 orthogonal validations for commercial antibodies, demonstrating the widespread adoption of this approach [18]. The International Working Group on Antibody Validation has formally recognized orthogonal strategies as one of the "five conceptual pillars for antibody validation," establishing it as a standard practice for ensuring research reproducibility [18].
Comparative Analysis of Orthogonal Analytical Techniques
Technical Capabilities and Performance Metrics
Table 1: Comparative analytical capabilities of LC-HRMS and NMR spectroscopy
| Parameter | LC-HRMS | NMR Spectroscopy |
|---|---|---|
| Sensitivity | Femtomole range (10⁻¹³ mol) [11] | Microgram range (10⁻⁹ mol) [11] |
| Structural Information | Molecular weight, elemental composition via exact mass, fragmentation patterns from MS/MS [11] | Detailed structural information including chemical shift, splitting patterns, atomic connectivity via multi-dimensional experiments [11] |
| Quantitation | Relative quantitation possible; requires standards for absolute quantitation | Inherently quantitative without requiring identical standards [11] |
| Sample Throughput | High (seconds per sample for MS analysis) [11] | Low (minutes to hours for 1D spectrum; hours to days for 2D experiments) [11] |
| Destructive Nature | Destructive technique [67] | Non-destructive; sample recovery possible [11] |
| Isomer Discrimination | Limited ability to distinguish isomers [11] | Excellent capability to distinguish isobaric compounds and positional isomers [11] |
| Matrix Effects | Susceptible to ion suppression/enhancement [11] | Minimal matrix effects; signals directly proportional to concentration [11] |
| Data Reproducibility | Variable across instruments and ionization conditions [11] | Highly reproducible across different instruments and field strengths [11] |
Orthogonal Validation Performance Across Applications
Table 2: Orthogonal method performance in published studies
| Application Domain | Primary Method | Orthogonal Validation Method | Key Performance Findings | Reference |
|---|---|---|---|---|
| mAb Glycan Analysis | HILIC-FLD | HRMS and NMR | Agreement across all methods for major glycoforms; increased confidence through orthogonal approaches [10] | PMC (2024) |
| Wine Metabolomics | LC-HRMS | ¹H NMR | Data fusion approach improved predictive accuracy; limited correlation between datasets (RV-score=16.4%) highlighted complementarity [16] | Food Chemistry: X (2024) |
| Antibody Specificity Validation | Western Blot | RNA-seq data from Human Protein Atlas | Correspondence between protein expression and RNA data confirmed antibody specificity [18] | CST Blog (2024) |
| Clinical WGS | Whole Genome Sequencing | Multiple established methods (CMA, WES) | Demonstration of superior or equivalent performance for SNVs, indels, and CNVs [89] | npj Genomic Medicine (2020) |
| DLL3 Protein Expression | Immunohistochemistry | LC-MS peptide counts | Strong correlation between IHC staining intensity and MS peptide counts across tissues [18] | CST Blog (2024) |
Experimental Protocols for Orthogonal LC-HRMS and NMR Analysis
Sample Preparation Workflow
Proper sample preparation is critical for successful orthogonal analysis. For monoclonal antibody glycan analysis as demonstrated in rituximab characterization, the process begins with buffer exchange using 10-kDa molecular weight cut-off (MWCO) filters, followed by enzymatic release of N-glycans using PNGase F [10]. The released glycans are then labeled with fluorophores such as 2-aminobenzamide (2-AB) or modern reagents like RapiFluor-MS, which provides reduced sample preparation times and improved MS performance [10]. For mass spectrometry analysis, proteins are typically digested with trypsin after reduction with dithiothreitol (DTT) and alkylation with iodoacetic acid (IAA) [10]. The digestion is quenched with formic acid, and samples are desalted using appropriate columns before analysis.
For NMR analysis, specific considerations must be addressed to overcome sensitivity challenges. The use of higher field spectrometers (e.g., 900 MHz) provides a 5.2-fold increase in signal-to-noise ratio compared to 300 MHz instruments [11]. Additionally, specialized NMR probes including microcoil probes (with active volumes as low as 1.5 μL) and cryogenically cooled probes (cryoprobes) can improve sensitivity by 2-4 fold [11]. For LC-NMR applications, mobile phase considerations are crucial; while deuterated water is commonly used, the high cost of deuterated organic phases often leads researchers to use protonated organic modifiers, which can cause solvent signal interference [11].
LC-HRMS Analytical Parameters
For comprehensive glycan analysis using HRMS, the following parameters have been successfully employed in orthogonal validation studies. Separation is typically performed using reversed-phase or hydrophilic interaction liquid chromatography (HILIC) with sub-2μm particle columns [10]. Mass spectrometry is conducted on high-resolution instruments such as Orbitrap-based systems, with resolutions greater than 100,000 enabling accurate mass measurements [10]. For glycopeptide analysis in the multi-attribute method (MAM), tryptic digests are separated using UHPLC systems with C18 columns maintained at 50°C, with a typical injection amount of 5μg [10]. Data processing employs specialized software such as BioPharmaFinder or Chromeleon for attribute identification and quantification [10].
NMR Analytical Parameters
For NMR-based orthogonal validation, standard ¹H NMR experiments are typically performed with acquisition times ranging from minutes to hours, depending on sample concentration and desired signal-to-noise ratio [11]. For structural elucidation of unknown compounds, two-dimensional experiments such as ¹H-¹³C HSQC, HMBC, and COSY may be required, significantly increasing analysis time [11]. In the middle-down NMR approach for mAb analysis, the Fc and Fab domains are first separated from intact mAbs, followed by urea denaturation of the Fc domain to profile intact N-glycan distributions [10]. This method monitors monosaccharide content rather than specific glycan moieties, providing complementary information to MS-based techniques [10].
Data Integration and Fusion Strategies
The integration of data from orthogonal techniques requires sophisticated statistical approaches to maximize the value of complementary information. Data fusion strategies are generally classified into three levels based on the stage at which integration occurs [67].
Data Fusion Methodologies
Low-level data fusion (LLDF), also known as block concatenation, represents the most straightforward approach by directly combining raw or pre-processed data matrices from different analytical platforms [67]. This method requires careful pre-processing to correct for acquisition artifacts and equalize contributions from different data sources through techniques such as mean centering or unit variance scaling [67]. Mid-level data fusion (MLDF) addresses the challenge of high-dimensional data by first extracting important features from each dataset before concatenation [67]. Principal Component Analysis (PCA) is commonly used for dimensionality reduction in first-order data, while more advanced techniques like Parallel Factor Analysis (PARAFAC) or Multivariate Curve Resolution-Alternating Least Squares (MCR-ALS) are employed for complex higher-order data [67]. High-level data fusion represents the most complex approach, combining model outputs rather than raw data or features, typically using heuristic rules or Bayesian inference to reach consolidated conclusions [67].
Statistical Validation Approaches
Both unsupervised and supervised methods are employed in orthogonal data validation. Unsupervised approaches like Principal Component Analysis (PCA) identify inherent patterns and clusters without prior knowledge of sample classes [16]. Supervised methods such as Partial Least Squares-Discriminant Analysis (PLS-DA) utilize class information to maximize separation between predefined groups [16]. In the Amarone wine classification study, the integration of LC-HRMS and ¹H NMR datasets through supervised sPLS-DA models correctly classified samples based on withering time and yeast strains with significantly lower error rates (7.52%) than individual techniques alone [16].
Experimental Workflow Visualization
LC-HRMS and NMR Orthogonal Validation Workflow
This workflow illustrates the parallel analytical pathways employed in orthogonal validation studies. Sample preparation is followed by independent analysis using LC-HRMS and NMR techniques, with subsequent data processing, fusion, and final validation integrating results from both methodologies.
The Scientist's Toolkit: Essential Research Reagents and Materials
Table 3: Essential research reagents and materials for orthogonal validation studies
| Reagent/Material | Function in Orthogonal Validation | Application Examples |
|---|---|---|
| PNGase F | Enzymatic release of N-glycans from glycoproteins | N-glycan analysis of therapeutic monoclonal antibodies [10] |
| RapiFluor-MS Labeling Reagent | Fluorescent tagging of glycans for improved MS sensitivity | Enhanced detection and quantification of released glycans in LC-MS workflows [10] |
| Trypsin | Proteolytic digestion for peptide mapping | Multi-attribute method (MAM) analysis of biotherapeutics [10] |
| Deuterated Solvents (D₂O, CD₃CN) | NMR-compatible mobile phases | LC-NMR and LC-MS-NMR applications to reduce solvent interference [11] |
| Reference Standard Cell Lines | Binary validation systems with known expression levels | Antibody specificity testing (e.g., RT4, MCF7, HDLM-2, MOLT-4 for Nectin-2 validation) [18] |
| 10-kDa MWCO Filters | Buffer exchange and sample cleanup | Desalting and concentration of protein samples prior to analysis [10] |
| Cryoprobes and Microcoil Probes | Enhanced sensitivity for NMR detection | Analysis of low-concentration analytes in complex mixtures [11] |
| HILIC SPE Cartridges | Solid-phase extraction for glycan purification | Cleanup of fluorescently labeled N-glycans before HILIC-FLD analysis [10] |
Reporting Standards and Best Practices
Comprehensive reporting of orthogonally validated findings requires transparent documentation of methodological details, results from all techniques, and integrated conclusions. Statistical measures beyond p-values should be prioritized, including effect sizes, confidence intervals, and measures of variability [90]. The reporting should clearly articulate how each orthogonal method contributed to the overall validation, noting any discrepancies between techniques and their potential sources.
For LC-HRMS and NMR integration, specific technical details must be documented, including NMR solvent conditions, MS ionization parameters, and any modifications made to standard protocols to enable hyphenation [11]. The specific data fusion strategy employed (low-, mid-, or high-level) should be explicitly stated with justification for the selected approach [67]. When public data sources such as the Human Protein Atlas, Cancer Cell Line Encyclopedia, or DepMap Portal are used for orthogonal validation, the specific datasets and access methods should be clearly referenced [18].
Effective reporting also requires clear statements on methodological limitations for each technique, such as the limited sensitivity of NMR or the potential for matrix effects in MS [11]. By addressing these elements comprehensively, researchers can ensure their orthogonally validated findings provide maximum scientific value and contribute to the advancement of robust analytical practices in pharmaceutical and clinical research.
Conclusion
The orthogonal validation of LC-HRMS findings with NMR spectroscopy represents a paradigm shift in analytical chemistry, moving beyond the limitations of single-platform analyses. By synergistically combining the high sensitivity of MS with the unparalleled structural elucidation power and quantitative robustness of NMR, researchers can achieve a more comprehensive and confident characterization of complex samples. As demonstrated across pharmaceutical, food, and clinical applications, this integrated approach enhances classification accuracy, reduces identification errors, and provides a deeper, more holistic view of the metabolome. Future directions will likely focus on advancing seamless instrumental coupling, developing more sophisticated AI-driven data fusion algorithms, and establishing standardized protocols to make this powerful strategy a mainstay in routine analytical workflows, thereby accelerating discovery and ensuring product quality and safety.
References
- 1. Recent Advances in Mass Spectrometry-Based Structural ... [https://pmc.ncbi.nlm.nih.gov/articles/PMC9572214/]
- 2. Sensitive Quantification and Structural Elucidation of Steroids [https://www.technologynetworks.com/analysis/application-notes/sensitive-quantification-and-structural-elucidation-of-steroids-383802]
- 3. Breaking the Sensitivity Barrier of NMR Spectroscopy [https://www.bruker.com/en/landingpages/bbio/resolution-in-a-new-dimension-for-solving-challenges-of-society/customer-insight-patrick-giraudeau.html]
- 4. Maximizing NMR Sensitivity: A Guide to Receiver Gain ... [https://pmc.ncbi.nlm.nih.gov/articles/PMC12059252/]
- 5. Advantages and disadvantages of nuclear magnetic ... [https://www.sciencedirect.com/science/article/abs/pii/S0003267003011346]
- 6. Comparing the sensitivity of a low- and a high-resolution ... [https://www.sciencedirect.com/science/article/pii/S0003267023009613]
- 7. Accurate and Efficient Structure Elucidation from Routine One ... [https://pmc.ncbi.nlm.nih.gov/articles/PMC11613330/]
- 8. Validation of two LCHRMS methods for large-scale ... [https://www.sciencedirect.com/science/article/pii/S0021967324006046]
- 9. Integration of LC-HRMS and 1H NMR metabolomics data ... [https://pmc.ncbi.nlm.nih.gov/articles/PMC11279979/]
- 10. a comparative study using HRMS, NMR, and HILIC-FLD - PMC [https://pmc.ncbi.nlm.nih.gov/articles/PMC11541336/]
- 11. The integration of LC-MS and NMR for the analysis of low ... [https://pmc.ncbi.nlm.nih.gov/articles/PMC6339611/]
- 12. A multilevel LC-HRMS and NMR correlation workflow ... [https://www.sciencedirect.com/science/article/abs/pii/S0039914024010208]
- 13. Combination of Pseudo-LC-NMR and HRMS/MS-Based ... [https://pmc.ncbi.nlm.nih.gov/articles/PMC8569130/]
- 14. 2025 Pharma Trends: Structure elucidation services by NMR [https://resolvemass.ca/structure-elucidation-services-by-nmr/]
- 15. A comparison of quantitative nuclear magnetic resonance ... [https://pubmed.ncbi.nlm.nih.gov/24002733/]
- 16. Integration of LC-HRMS and 1H NMR metabolomics data ... [https://www.sciencedirect.com/science/article/pii/S2590157524004954]
- 17. A multilevel LC-HRMS and NMR correlation workflow towards foodomics advancement: Application in table olives - ScienceDirect [https://www.sciencedirect.com/science/article/pii/S0039914024010208]
- 18. Antibody Validation Essentials: Orthogonal Strategy - CST Blog [https://blog.cellsignal.com/hallmarks-of-validation-orthogonal-strategy]
- 19. AI redefines mass spectrometry chemicals identification [https://pmc.ncbi.nlm.nih.gov/articles/PMC12647117/]
- 20. UHPLC-(ESI)-HRMS and NMR-Based Metabolomics Approach to Access the Seasonality of Byrsonima intermedia and Serjania marginata From Brazilian Cerrado Flora Diversity - PMC [https://www.ncbi.nlm.nih.gov/pmc/articles/PMC8290060/]
- 21. Assessment of monoclonal antibody glycosylation: a comparative study using HRMS, NMR, and HILIC-FLD | Analytical and Bioanalytical Chemistry [https://link.springer.com/article/10.1007/s00216-024-05261-5]
- 22. Segmented Flow Strategies for Integrating Liquid Chromatography–Mass Spectrometry with Nuclear Magnetic Resonance for Lipidomics - PMC [https://pmc.ncbi.nlm.nih.gov/articles/PMC10870252/]
- 23. Integrating NMR and MS for Improved Metabolomic Analysis [https://pmc.ncbi.nlm.nih.gov/articles/PMC12196070/]
- 24. Nuclear Magnetic Resonance-Based Approaches for the ... [https://www.mdpi.com/2312-7481/11/6/47]
- 25. Metabolomics in drug research and development: The recent ... [https://pmc.ncbi.nlm.nih.gov/articles/PMC10465962/]
- 26. Metabolomics and Pharmacometabolomics [https://www.mdpi.com/2218-1989/15/11/750]
- 27. Untargeted LC-HRMS Metabolomics and Chemometrics of ... [https://pmc.ncbi.nlm.nih.gov/articles/PMC12157740/]
- 28. The Use of Metabolomics Approach in the Combination ... [https://www.kosfaj.org/archive/view_article?pid=kosfa-2025-e36]
- 29. Mass spectrometry-based metabolomics in health and ... [https://pubs.rsc.org/en/content/articlehtml/2020/ra/c9ra08985c]
- 30. Liquid and gas-chromatography-mass spectrometry ... [https://www.sciencedirect.com/science/article/pii/S0021967325000779]
- 31. A multi-technique data fusion approach applied to a case ... [https://www.sciencedirect.com/science/article/pii/S2211715625005156]
- 32. A Review of Data Fusion Techniques - PMC - PubMed Central [https://pmc.ncbi.nlm.nih.gov/articles/PMC3826336/]
- 33. A Comparative Analysis of Three Data Fusion Methods and ... [https://www.mdpi.com/2227-7390/13/8/1218]
- 34. mid- and high-level fusion strategies for combining Raman ... [https://www.sciencedirect.com/science/article/abs/pii/S0308814621011602]
- 35. Data fusion and multivariate analysis for food authenticity ... [https://www.nature.com/articles/s41467-023-38382-z]
- 36. Orthogonal Comparison of GC−MS and 1H NMR ... [https://pmc.ncbi.nlm.nih.gov/articles/PMC6334302/]
- 37. a comparison of the sequential and simultaneous injection ... [https://pubmed.ncbi.nlm.nih.gov/12717809/]
- 38. AI-coupled HPC Workflow Applications, Middleware and ... [https://arxiv.org/html/2406.14315v1]
- 39. Workflows for automated downstream data analysis and ... [https://pmc.ncbi.nlm.nih.gov/articles/PMC4415483/]
- 40. NMR-based metabolomics: Where are we now and where ... [https://www.sciencedirect.com/science/article/abs/pii/S0079656525000081]
- 41. Combining Mass Spectrometry and NMR Improves Metabolite ... [https://pmc.ncbi.nlm.nih.gov/articles/PMC6668615/]
- 42. Statistical Heterospectroscopy, an Approach to the ... [https://pubmed.ncbi.nlm.nih.gov/16408915/]
- 43. Application in Metabonomic Toxicology Studies [https://www.academia.edu/100234789/Statistical_Heterospectroscopy_an_Approach_to_the_Integrated_Analysis_of_NMR_and_UPLC_MS_Data_Sets_Application_in_Metabonomic_Toxicology_Studies]
- 44. High-confidence structural annotation of metabolites ... [https://www.nature.com/articles/s41587-021-01045-9]
- 45. Impurity profiling and HPLC methods for drug quality ... [https://amsbiopharma.com/drug-impurity-profiling-analysis-methods/]
- 46. Forced degradation and impurity profiling: Recent trends in ... [https://www.sciencedirect.com/science/article/abs/pii/S0731708513003099]
- 47. The role of degradant profiling in active pharmaceutical ... [https://www.sciencedirect.com/science/article/abs/pii/S0169409X06002730]
- 48. How To Overcome The Critical Challenges Faced In ... [https://www.lhasalimited.org/blog/key-challenges-forced-degradation/]
- 49. Identification and characterization of forced degradation ... [https://www.sciencedirect.com/science/article/pii/S2949771X25000362]
- 50. LC-HRMS and NMR studies for the characterization of ... [https://pubmed.ncbi.nlm.nih.gov/38522383/]
- 51. Advancements in foodomics: Transformative applications ... [https://www.sciencedirect.com/science/article/pii/S2772753X25002497]
- 52. Foodomics as a Tool for Evaluating Food Authenticity and ... [https://pmc.ncbi.nlm.nih.gov/articles/PMC11719641/]
- 53. Geographical origin and botanical type honey ... [https://www.sciencedirect.com/science/article/abs/pii/S0308814620317982]
- 54. Geographical Origin Authentication of Agri-Food Products [https://pmc.ncbi.nlm.nih.gov/articles/PMC7230915/]
- 55. Geographical Origin Authentication—A Mandatory Step in ... [https://www.mdpi.com/2304-8158/13/4/532]
- 56. Authentication of the Botanical and Geographical Origin ... [https://www.mdpi.com/2304-8158/10/7/1565]
- 57. Unlocking the Future of Personalized Medicine [https://communities.springernature.com/posts/unlocking-the-future-of-personalized-medicine-call-for-papers-on-pharmacometabolomics-and-drug-development-metabolite-interaction]
- 58. Metabolomics profiling identifies diagnostic metabolic ... [https://pmc.ncbi.nlm.nih.gov/articles/PMC12018233/]
- 59. Metabolic profiling and early prediction models for gestational ... [https://eurjmedres.biomedcentral.com/articles/10.1186/s40001-025-02526-2]
- 60. Applications of Solution NMR Spectroscopy in Quality ... [https://www.mdpi.com/2304-8158/12/17/3240]
- 61. Comparison of the metabolic profiles and their ... [https://www.sciencedirect.com/science/article/pii/S0168822725001226]
- 62. Comparative analysis of targeted metabolomic profiles ... [https://www.nature.com/articles/s41598-025-23058-z]
- 63. Serum metabolic profiling enables diagnosis, prognosis ... [https://www.nature.com/articles/s41467-025-61163-9]
- 64. Dietary Modulation of Metabolic Health: From Bioactive ... [https://pmc.ncbi.nlm.nih.gov/articles/PMC12471629/]
- 65. Personalized Metabolic Profile by Synergic Use of NMR and ... [https://pmc.ncbi.nlm.nih.gov/articles/PMC8304707/]
- 66. Text has enhanced contrast | ACT Rule | WAI [https://www.w3.org/WAI/standards-guidelines/act/rules/09o5cg/]
- 67. Integrating NMR and MS for Improved Metabolomic Analysis [https://www.mdpi.com/1420-3049/30/12/2624]
- 68. Chemical Profiling and Quality Assessment of Food Products ... [https://pmc.ncbi.nlm.nih.gov/articles/PMC12294631/]
- 69. A Review of Retention Time Alignment Methods and Tools ... [https://pubmed.ncbi.nlm.nih.gov/40059493/]
- 70. Critical review on in silico methods for structural annotation of ... [https://pmc.ncbi.nlm.nih.gov/articles/PMC11700063/]
- 71. Modern sample preparation approaches for small ... [https://www.sciencedirect.com/science/article/pii/S2772582022000146]
- 72. Comparison of multiple bioanalytical assay platforms for ... [https://pmc.ncbi.nlm.nih.gov/articles/PMC11389733/]
- 73. Top 10 Bioinformatics Tools in 2025: Features, Pros, Cons ... [https://www.cotocus.com/blog/top-10-bioinformatics-tools-in-2025-features-pros-cons-comparison/]
- 74. Top 10 Bioinformatics Tools in 2025: Features, Pros, Cons ... [https://www.devopsschool.com/blog/top-10-bioinformatics-tools-in-2025-features-pros-cons-comparison/]
- 75. Evaluating LC-HRMS metabolomics data processing ... [https://pmc.ncbi.nlm.nih.gov/articles/PMC12087353/]
- 76. Liquid Chromatography–High-Resolution Mass ... [https://www.mdpi.com/1420-3049/29/1/232]
- 77. LC-HRMS fingerprinting and chemometrics for the ... [https://www.frontiersin.org/journals/molecular-biosciences/articles/10.3389/fmolb.2025.1646758/full]
- 78. UHPLC-(ESI)-HRMS and NMR-Based Metabolomics ... [https://www.frontiersin.org/journals/chemistry/articles/10.3389/fchem.2021.710025/full]
- 79. Exploring non-target screening variability in unsupervised ... [https://link.springer.com/article/10.1007/s00216-025-06225-z]
- 80. Early Fusion vs. Late Fusion in Multimodal Data Processing [https://www.geeksforgeeks.org/deep-learning/early-fusion-vs-late-fusion-in-multimodal-data-processing/]
- 81. Multimodal Models and Fusion - A Complete Guide [https://medium.com/@raj.pulapakura/multimodal-models-and-fusion-a-complete-guide-225ca91f6861]
- 82. Comparison between 5 extractions methods in either plasma ... [https://cmbl.biomedcentral.com/articles/10.1186/s11658-023-00452-x]
- 83. Comparison of Metabolites and Species Classification ... [https://www.mdpi.com/2304-8158/12/20/3714]
- 84. Comparison of Various Extraction Approaches for ... [https://pmc.ncbi.nlm.nih.gov/articles/PMC11122815/]
- 85. Artificial intelligence decision making tools in food ... [https://www.sciencedirect.com/science/article/pii/S0963996924009438]
- 86. Evaluation of different techniques for data fusion of LC/MS ... [https://www.sciencedirect.com/science/article/abs/pii/S0169743906000864]
- 87. Ultra-Performance Liquid Chromatography–High-Resolution ... [https://pmc.ncbi.nlm.nih.gov/articles/PMC6184476/]
- 88. 13C Metabolomics: NMR and IROA for Unknown ... [https://pmc.ncbi.nlm.nih.gov/articles/PMC5204070/]
- 89. Best practices for the analytical validation of clinical whole ... [https://www.nature.com/articles/s41525-020-00154-9]
- 90. How to report orthogonal contrast codes? - Cross Validated [https://stats.stackexchange.com/questions/422053/how-to-report-orthogonal-contrast-codes]