LC-HRMS Metabolomics for Antifungal Discovery in Orchidaceae: From Metabolic Profiling to Novel Bioactive Leads
This article explores the application of Liquid Chromatography-High Resolution Mass Spectrometry (LC-HRMS) metabolomics for the discovery of antifungal compounds from Orchidaceae species.
LC-HRMS Metabolomics for Antifungal Discovery in Orchidaceae: From Metabolic Profiling to Novel Bioactive Leads
Abstract
This article explores the application of Liquid Chromatography-High Resolution Mass Spectrometry (LC-HRMS) metabolomics for the discovery of antifungal compounds from Orchidaceae species. It covers the foundational knowledge of orchid biochemistry, detailed methodologies for untargeted analysis and data processing, strategies to overcome analytical challenges, and the validation of bioactive metabolites. Aimed at researchers and drug development professionals, this review synthesizes current research to provide a comprehensive guide for leveraging Orchidaceae's chemical diversity in the development of new antifungal agents.
The Chemical Defense Arsenal of Orchidaceae: Unveiling Antifungal Metabolites
Orchidaceae as a Reservoir of Bioactive Secondary Metabolites
Orchidaceae, one of the largest and most diverse plant families with over 28,000 species across 763 genera, represents a vast reservoir of chemically diverse secondary metabolites with significant biological activities [1] [2] [3]. These medicinal orchids have been cultivated in China for over 2,000 years, with several species documented in the Chinese Pharmacopoeia as traditional herbal medicines [3]. Secondary metabolites in orchids function as plant protectants that confer defensive capabilities against pathogens, predators, and environmental stresses [3]. The exploration of these compounds has gained considerable scientific interest due to their diverse biological activities and potential as lead compounds for pharmaceutical development.
Research has demonstrated that Orchidaceae species produce an extensive array of secondary metabolites, primarily classified into three major groups: terpenoids, phenols, and nitrogen-containing compounds [3]. The production and distribution of these specialized metabolites exhibit species specificity and often occur in particular organs, tissues, and developmental stages [3]. For instance, Dendrobium nobile produces a distinctive profile of sesquiterpene alkaloids, while Dendrobium chrysotoxum accumulates significant levels of bibenzyl compounds such as moscatilin, with stem tissue typically serving as the primary medicinal component [3]. This chemical diversity, coupled with species-specific biosynthesis, positions Orchidaceae as a promising family for discovering novel antifungal agents and other bioactive compounds.
Key Bioactive Metabolite Classes in Orchidaceae
Recent investigations have systematically identified and characterized numerous secondary metabolites from medicinal orchids, revealing their extensive chemical diversity and potential therapeutic applications. The table below summarizes the major classes of bioactive compounds identified in Orchidaceae species, their distribution, and demonstrated biological activities.
Table 1: Major Classes of Bioactive Secondary Metabolites in Orchidaceae
| Metabolite Class | Specific Types | Representative Compounds | Orchid Genera | Reported Biological Activities |
|---|---|---|---|---|
| Alkaloids | Sesquiterpene, Indolizine, Amide, Indole | Dendrobine, Crepidine | Dendrobium, Dendrobium nobile, D. crepidatum | Antimicrobial, Anticancer, Analgesic |
| Phenanthrenes | Dihydrophenanthrene, Phenanthraquinone, Phenanthrene furan | DHP trimer, Phenanthraquinones | Bletilla, Dendrobium | Antifungal, Anti-inflammatory, Cytotoxic |
| Bibenzyls | Bibenzyl derivatives | Dendrocandin X, Densiflorol A, Aloifol I | Dendrobium, Bletilla | Antioxidant, Antifungal, Neuroprotective |
| Flavonoids | Flavones, Flavonols, Flavanones | Tricin derivatives | Vanda, Cattleya, Dendrobium | Antifungal, Antioxidant, Anti-inflammatory |
| Stilbenoids | Hydroxylated stilbenes | Orchinol, Hircinol | Vanda, Cattleya | Antifungal, Phytoalexins, Defense response |
| Terpenoids | Diterpenoids, Monoterpenoids, Sesquiterpenoids | Loliolide | Vanda, Cattleya | Antifungal, Antimicrobial |
Among these compound classes, flavonoids and stilbenoids have demonstrated particularly promising antifungal properties. A comprehensive LC-HRMS/MS-based metabolomics study identified 35 flavonoid metabolites (22 flavones, 7 flavonols, 1 flavanone, and 5 isoflavones) and 10 stilbenoids across Vanda and Cattleya genera [1] [4]. The tricin derivative flavonoid and loliolide terpenoid were specifically identified as promising antifungal metabolites found exclusively in healthy plant samples [1]. The structural diversity of these compounds, particularly the prevalence of glycosylated forms, contributes to their biological activities and potential mechanisms of action against fungal pathogens.
LC-HRMS Metabolomics Protocol for Antifungal Compound Screening
Sample Preparation and Extraction
Table 2: Sample Preparation Protocol for Orchidaceae Metabolomics
| Step | Procedure | Parameters | Quality Control |
|---|---|---|---|
| Plant Material Collection | Collect healthy and fungal-infected plant samples | 20 ethanolic plant extracts from Vanda and Cattleya genera | Document physiological condition, collection site, developmental stage |
| Lyophilization | Freeze samples rapidly and lyophilize to constant weight | -50°C, 0.040 mBar for 48 hours | Assess moisture content (<5%) |
| Extraction | Macerate lyophilized material in ethanol | 1:20 plant:solvent ratio, ultrasonic bath 30 min, triple extraction | Include procedural blanks, standard reference materials |
| Concentration | Evaporate under reduced pressure | 40°C, rotary evaporator | Monitor to complete dryness |
| Reconstitution | Dissolve in LC-MS compatible solvent | 1 mg/mL in methanol:water (1:1) | Vortex 1 min, centrifuge at 14,000×g for 10 min |
| Storage | Transfer to LC vials | -80°C until analysis | Use inert vials to prevent adsorption |
The sample preparation protocol begins with careful selection and documentation of plant materials, including both healthy and fungal-infected specimens to enable comparative metabolomics [1]. Following collection, plant tissues are immediately frozen in liquid nitrogen to preserve metabolic profiles and prevent degradation. The frozen samples are then lyophilized to constant weight and finely powdered using a cryogenic grinder. The extraction process employs ethanol as the extraction solvent, which effectively solubilizes a broad range of secondary metabolites while maintaining compatibility with subsequent LC-MS analysis [1]. The extraction is performed using ultrasonic assistance to enhance efficiency, followed by concentration under reduced pressure. Finally, samples are reconstituted in an appropriate LC-MS compatible solvent mixture, typically methanol:water (1:1), and stored at -80°C until analysis to maintain metabolite stability.
LC-HRMS/MS Analysis Parameters
Table 3: LC-HRMS Instrumental Parameters for Metabolite Profiling
| Parameter | Configuration | Alternative Settings |
|---|---|---|
| Chromatography System | UHPLC with C18 reversed-phase column | HILIC for polar metabolites |
| Column Specifications | 100 × 2.1 mm, 1.7 μm particle size | 150 × 2.1 mm, 1.8 μm for better separation |
| Mobile Phase A | Water with 0.1% formic acid | 5 mM ammonium formate for negative mode |
| Mobile Phase B | Acetonitrile with 0.1% formic acid | Methanol for different selectivity |
| Gradient Program | 5-95% B over 25 min, hold 5 min | 2-98% B over 30 min for broader coverage |
| Flow Rate | 0.3 mL/min | 0.4 mL/min for faster analysis |
| Injection Volume | 5 μL | 2-10 μL depending on sensitivity needs |
| Mass Spectrometer | Orbitrap high-resolution mass analyzer | Q-TOF as alternative platform |
| Ionization Mode | ESI positive and negative | APCI for less polar compounds |
| Resolution | >70,000 FWHM | 35,000 for faster scanning |
| Mass Range | m/z 100-1500 | m/z 50-2000 for broader coverage |
| Fragmentation | Data-dependent MS/MS (top 20) | Data-independent acquisition |
Liquid chromatography coupled to high-resolution tandem mass spectrometry (LC-HRMS/MS) represents the cornerstone technique for comprehensive metabolite profiling of Orchidaceae extracts [1]. The protocol employs reversed-phase chromatography with a C18 stationary phase, which provides excellent separation for a wide range of secondary metabolites. The use of a biphasic gradient with water-acetonitrile modified with acid ensures optimal peak shape and ionization efficiency. High-resolution mass analysis using Orbitrap technology enables accurate mass measurements with sub-ppm mass accuracy, facilitating confident molecular formula assignment [1]. Data-dependent acquisition automatically selects the most abundant ions for fragmentation, generating MS/MS spectra essential for structural annotation. The analysis is typically performed in both positive and negative electrospray ionization modes to achieve comprehensive coverage of metabolites with different ionization efficiencies.
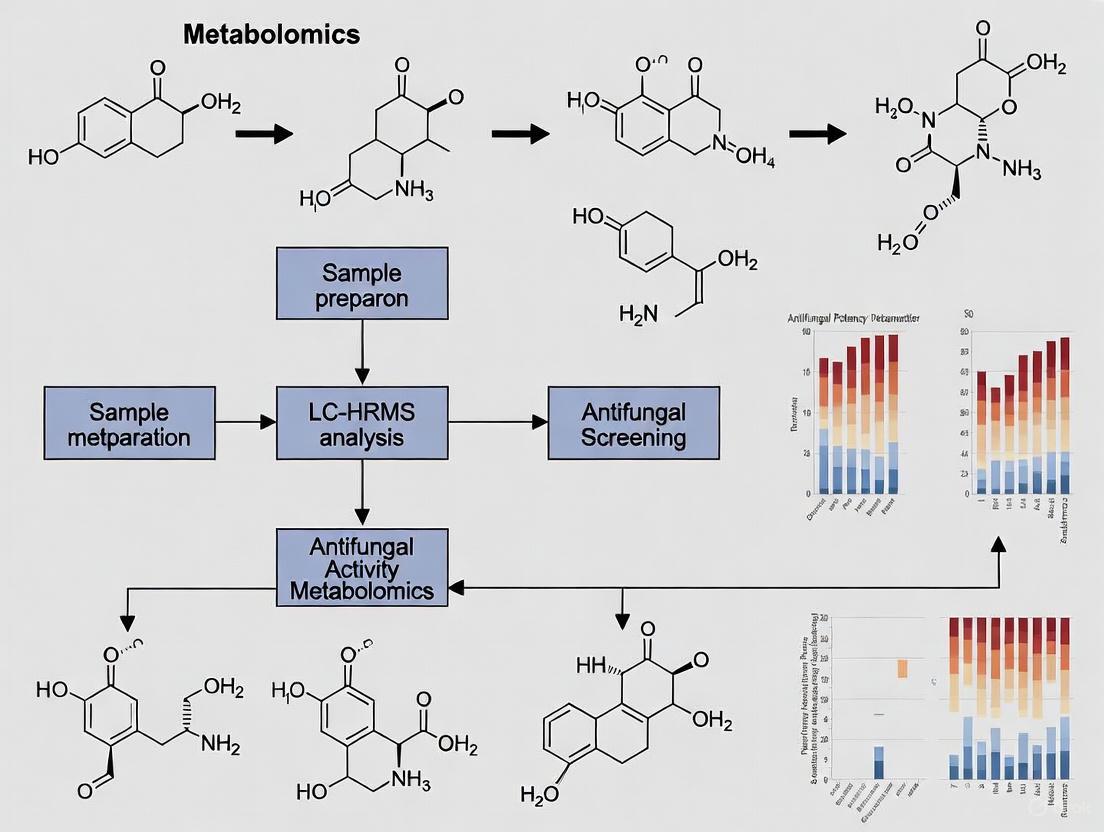
Figure 1: Experimental workflow for LC-HRMS-based antifungal metabolite screening in Orchidaceae
Data Processing and Metabolite Annotation
The raw LC-HRMS data processing begins with converting files to open formats (e.g., mzML) using conversion tools like MSConvert [1]. Subsequently, feature detection and alignment are performed using software such as MZmine or XCMS to extract accurate mass-retention time pairs and corresponding intensities across all samples. The resulting feature table is then subjected to multivariate statistical analysis including principal component analysis (PCA) and orthogonal projections to latent structures discriminant analysis (OPLS-DA) to identify metabolites that differentiate between healthy and fungal-infected samples [1].
For structural annotation, the processed data is uploaded to the Global Natural Products Social Molecular Networking (GNPS) platform, where molecular networking analysis groups related metabolites based on MS/MS spectral similarity [1] [4]. The cosine score threshold for spectral similarity is typically set to 0.7 to balance network specificity and sensitivity [1]. Dereplication tools including Dereplicator+, Network Annotation Propagation (NAP), and MolDiscovery are employed to annotate metabolites by comparing experimental MS/MS spectra against natural product databases [1]. Annotation confidence is classified according to the Metabolomic Standards Initiative, with level 2 identification achieved through spectral library matching and in silico fragmentation tools [1].
Advanced Data Integration and Analysis Methods
Integration of Metabolomics with Transcriptomics
The integration of metabolomic data with transcriptomic analyses provides unprecedented insights into the molecular mechanisms underlying secondary metabolite biosynthesis in Orchidaceae under stress conditions. A recent study on Dendrobium nobile Lindl. under drought stress employed combined transcriptome and metabolome analysis, revealing that differentially expressed genes (DEGs) were enriched in plant hormone signal transduction; cutin, suberin, and wax biosynthesis; starch and sucrose metabolism; and the biosynthesis of various plant secondary metabolites [5]. Weighted gene co-expression network analysis (WGCNA) identified key modules associated with physiological properties, facilitating the construction of regulatory networks for drought tolerance [5].
This integrated approach revealed that arginine and proline metabolism, glucosinolate biosynthesis, and tyrosine metabolism pathways participated in regulating drought stress response in D. nobile [5]. Within these pathways, genes such as ALDH18A, rocF, proC, P4HA, arginine decarboxylase, and speE showed increasing expression trends during drought stress, correlating with specific metabolite accumulation patterns [5]. Similar approaches can be applied to study fungal infection in orchids, enabling the identification of key regulatory genes involved in antifungal compound biosynthesis.
Data Fusion and Multiblock Analysis
Advanced data integration strategies such as SLIDE-ASCA (Structural Learning and Integrative Decomposition with ANOVA-simultaneous component analysis) enable the decomposition of global and partial common, as well as distinct variation sources arising from experimental factors and their possible interactions [6]. This method is particularly valuable for complex experimental designs involving multiple factors such as treatment type, time series, and different orchid species. The SLIDE-ASCA approach first extracts latent components from data sets using SLIDE, then breaks down common and distinct variations with ASCA, enabling structured decomposition aligned with factorial design [6].
For LC-HRMS data preprocessing, the ROIMCR (Region of Interest-Multivariate Curve Resolution-Alternating Least-Squares) method provides a robust alternative to conventional peak-picking by avoiding retention time alignment and peak shape modeling challenges [6]. This approach improves the resolution of coeluting compounds, separates true signals from irrelevant peaks, and groups related features into single components, reducing redundancy and simplifying interpretations of complex Orchidaceae metabolite profiles [6].
Figure 2: Advanced data integration workflow for multi-omics analysis of Orchidaceae bioactivity
The Scientist's Toolkit: Essential Research Reagents and Materials
Table 4: Essential Research Reagents and Materials for Orchidaceae Metabolomics
| Category | Item | Specification/Recommended Products | Application/Purpose |
|---|---|---|---|
| Chromatography | UHPLC System | Thermo Vanquish, Agilent 1290 Infinity II | High-resolution separation of metabolites |
| Reversed-Phase Column | C18, 100×2.1mm, 1.7μm (Waters Acquity) | Optimal separation of secondary metabolites | |
| Mobile Phase Modifiers | LC-MS grade formic acid, ammonium formate | Enhanced ionization efficiency | |
| Mass Spectrometry | High-Resolution Mass Spectrometer | Orbitrap Exploris series, Q-TOF systems | Accurate mass measurement and MS/MS fragmentation |
| Calibration Solution | Pierce LTQ Velos ESI Positive/Negative Ion | Mass accuracy calibration | |
| Data Analysis | Molecular Networking Platform | GNPS (Global Natural Products Social) | Spectral similarity networking and annotation |
| Dereplication Tools | Dereplicator+, NAP, MolDiscovery | Automated metabolite annotation | |
| Multivariate Analysis Software | SIMCA, MetaboAnalyst | Statistical analysis and biomarker discovery | |
| Sample Preparation | Solvents | LC-MS grade methanol, acetonitrile, water | High-purity extraction and analysis |
| Solid Phase Extraction | Strata-X, C18 cartridges | Sample clean-up and concentration | |
| Biological Validation | Fungal Strains | Candida albicans, Aspergillus fumigatus | Antifungal activity assessment |
| Culture Media | RPMI-1640, Sabouraud Dextrose Agar | Microbial cultivation for bioassays |
The selection of appropriate reagents, instruments, and software tools is critical for successful implementation of Orchidaceae metabolomics studies. High-quality LC-MS grade solvents are essential to minimize background interference and ensure reproducible results. The GNPS platform represents a cornerstone for data analysis, providing access to extensive spectral libraries and powerful computational tools for metabolite annotation [1]. For biological validation of antifungal activity, standard fungal strains and culture media enable standardized assessment of bioactive metabolites identified through metabolomic screening.
Concluding Remarks and Future Perspectives
Orchidaceae represents a largely untapped reservoir of bioactive secondary metabolites with significant potential for pharmaceutical development, particularly in the realm of antifungal agents. The application of LC-HRMS-based metabolomics, combined with advanced data integration strategies and bioactivity-guided fractionation, provides a powerful framework for unlocking this potential. The comprehensive protocols outlined in this application note offer researchers a standardized approach for metabolite profiling, annotation, and biological validation of antifungal compounds from Orchidaceae.
Future directions in this field should focus on expanding spectral libraries to include more orchid-specific metabolites, developing automated platforms for high-throughput screening, and integrating multi-omics data to elucidate the biosynthetic pathways of promising antifungal compounds. Additionally, the exploration of endophytic fungi associated with orchids may reveal novel synergies in metabolite production [7] [8]. As analytical technologies continue to advance and bioinformatics tools become more sophisticated, Orchidaceae will undoubtedly yield valuable chemical entities to address the growing challenge of antifungal resistance and contribute to the development of next-generation therapeutic agents.
Plant-derived natural products represent a rich source of chemical diversity for discovering new antifungal agents. Within the context of Orchidaceae metabolomics research using Liquid Chromatography-High Resolution Mass Spectrometry (LC-HRMS), three classes of specialized metabolites consistently emerge as critical players in plant defense mechanisms: stilbenoids, flavonoids, and terpenoids. These compounds constitute fundamental biochemical defenses in plants against fungal pathogens and are increasingly investigated as promising candidates for developing new antifungal therapies and agrochemicals. Advanced LC-HRMS-based metabolomics approaches have enabled researchers to rapidly identify and characterize these bioactive compounds within complex plant matrices, revealing their significant potential for addressing the growing challenge of fungal resistance [1] [9].
Orchidaceae species produce a diverse array of specialized metabolites as part of their biochemical defense system. When analyzing healthy versus fungal-infected orchid samples, LC-HRMS metabolomic profiling reveals distinct metabolic patterns, particularly in the production of stilbenoids, flavonoids, and terpenoids. These compound classes demonstrate direct antifungal activity and play crucial roles in the plant's induced defense responses [1]. The identification of these chemical defenses through targeted metabolomic studies provides valuable insights for developing novel antifungal strategies in both pharmaceutical and agricultural contexts.
Antifungal Compound Classes: Structures and Mechanisms
Stilbenoids
Stilbenoids are polyphenolic compounds characterized by a 1,2-diphenylethylene core structure, which exists as either cis or trans isomers, with the trans-isomer typically exhibiting greater stability and biological activity [9]. These phytoalexins are synthesized through the phenylpropanoid pathway and serve as crucial defense compounds in plants against fungal infections, herbivory, and environmental stressors such as UV radiation [9].
The most extensively researched stilbene is resveratrol (trans-3,5,4'-trihydroxystilbene), found predominantly in grapes, red wine, peanuts, and berries. Other significant stilbenes include pterostilbene (found in blueberries and grapes), piceatannol (present in grapes, passion fruit, and rhubarb), pinosylvin (from pine heartwood), and viniferins (produced in grapevines and red wine) [9]. In Orchidaceae species, research has identified specific stilbenoids such as orchinol and hircinol, which were isolated from the Orchis and Loroglossum genera and demonstrated significant antifungal activity, playing essential roles in defending orchid tubers against microbial attack [1].
Stilbenoids employ multiple mechanisms to exert their antifungal effects. They disrupt fungal cell membranes and cell walls, interfere with cellular respiration and energy production, and generate oxidative stress within fungal cells. Additionally, they inhibit critical fungal enzymes and can suppress virulence factors like biofilm formation [9]. Research on resveratrol has demonstrated its ability to inhibit both mycelial growth and spore germination in Botrytis cinerea, a significant fungal pathogen [10].
Flavonoids
Flavonoids constitute a diverse group of natural compounds with variable phenolic structures, all sharing a common 15-carbon skeleton consisting of two benzene rings (A and B) connected by a three-carbon heterocyclic ring (C) [11]. These compounds are classified into multiple subgroups based on their structural characteristics, with major classes including flavones, flavonols, flavanones, isoflavonoids, anthocyanins, flavanols (catechins), and chalcones [11].
In Orchidaceae species, LC-HRMS metabolomic profiling has revealed substantial production of polyphenols, with flavonoids representing a predominant class. Studies have annotated 35 flavonoid metabolites from orchid extracts, including 22 flavones, 7 flavonols, 1 flavanone, and 5 isoflavones [1]. The structural diversity of these compounds is enhanced by various glycosylation patterns, with O-glycosylated flavonoids being more prevalent than C-glycosylated forms in orchid species [1].
Flavonoids employ multiple antifungal mechanisms that contribute to their efficacy against fungal pathogens. They disrupt fungal cell membranes and inhibit cell wall synthesis, compromise membrane integrity, and inhibit critical fungal enzymes including those involved in energy metabolism and virulence factor production. Additionally, many flavonoids possess iron-chelating properties that induce iron starvation in fungal cells and can generate reactive oxygen species (ROS) leading to oxidative damage [11]. Their ability to act as potent enzyme inhibitors extends to enzymes like xanthine oxidase, further contributing to their antifungal activity [11].
Terpenoids
Terpenoids, also known as isoprenoids, represent one of the most abundant and structurally diverse classes of natural products, built from isoprene (C5) units. They are classified based on the number of carbon atoms: monoterpenes (C10), sesquiterpenes (C15), diterpenes (C20), sesterterpenes (C25), triterpenes (C30), and tetraterpenes (C40) [12]. Their biosynthesis occurs primarily through two pathways: the mevalonate (MVA) pathway in eukaryotes and the methylerythritol phosphate (MEP) pathway in prokaryotes and plant plastids [12] [13].
In Orchidaceae, terpenoid diversity is significant, with LC-HRMS analyses detecting 20 terpenoid compounds, including 9 diterpenoids, 2 monoterpenoids, 7 sesquiterpenoids, and 2 triterpenoids [1]. The antifungal activity of terpenoids varies considerably based on their specific structural features. For instance, in Tripterygium wilfordii, the α,β-unsaturated lactone ring in diterpenoids like triptolide serves as a key pharmacophore for bioactivity, while the quinone structure in triterpenoids such as celastrol correlates with antioxidant and anti-inflammatory effects [14].
Terpenoids employ complex mechanisms against fungal pathogens. They disrupt membrane integrity by interacting with lipid bilayers, leading to increased permeability and eventual cell lysis. Many terpenoids also target mitochondrial function, interfering with electron transport chains and energy production. Additional mechanisms include inhibition of fungal enzymes like those in ergosterol biosynthesis, disruption of cell wall formation, and induction of apoptosis in fungal cells [14] [12]. Their lipophilic nature enhances their ability to penetrate fungal cell membranes, contributing to their broad-spectrum antifungal activity.
Table 1: Key Antifungal Compounds in Orchidaceae and Their Activities
| Compound Class | Specific Examples | Reported Antifungal Activities | Sources in Orchidaceae |
|---|---|---|---|
| Stilbenoids | Orchinol, Hircinol | Growth inhibition against fungal pathogens in orchid tubers [1] | Orchis, Loroglossum genera |
| Flavonoids | Tricin derivatives, Various glycosylated flavonoids | Antifungal activity against plant pathogens; considered promising antifungal metabolites [1] | Vanda and Cattleya genera |
| Terpenoids | Loliolide | Identified as promising antifungal metabolite [1] | Healthy orchid plants |
Experimental Protocols for LC-HRMS-Based Antifungal Screening
Sample Preparation and Extraction
Protocol: Metabolite Extraction from Orchidaceae Tissues
- Plant Material Collection: Collect healthy and fungal-infected plant samples from Orchidaceae species (e.g., Vanda and Cattleya genera). Immediately freeze samples in liquid nitrogen and store at -80°C until extraction [1].
- Lyophilization: Lyophilize tissue samples for 48 hours to remove moisture completely while preserving thermolabile compounds.
- Homogenization: Grind lyophilized tissues to a fine powder using a ball mill or mortar and pestle cooled with liquid nitrogen.
- Extraction: Weigh 100 mg of powdered tissue and extract with 1 mL of ethanol (or ethyl acetate for broader polarity range) using ultrasonication for 30 minutes at room temperature [1] [15].
- Centrifugation: Centrifuge extracts at 14,000 × g for 15 minutes to pellet insoluble debris.
- Concentration: Transfer supernatant to new tubes and concentrate under a gentle stream of nitrogen gas.
- Reconstitution: Reconstitute dried extracts in 100 μL of methanol-water (1:1, v/v) containing 0.1% formic acid for LC-HRMS analysis.
- Filtration: Filter extracts through 0.22 μm membrane filters before LC-HRMS analysis to remove particulate matter.
LC-HRMS Analysis Conditions
Protocol: Liquid Chromatography-High Resolution Mass Spectrometry Analysis
- Chromatographic Separation:
- Column: C18 reversed-phase column (e.g., 100 × 2.1 mm, 1.8 μm particle size)
- Mobile Phase A: Water with 0.1% formic acid
- Mobile Phase B: Acetonitrile with 0.1% formic acid
- Gradient: 5% B to 95% B over 25 minutes, hold at 95% B for 5 minutes
- Flow Rate: 0.3 mL/min
- Column Temperature: 40°C
- Injection Volume: 5 μL [1]
- Mass Spectrometry Parameters:
- Ionization: Electrospray Ionization (ESI) in positive and negative modes
- Resolution: >70,000 full width at half maximum (FWHM)
- Mass Range: m/z 100-1500
- Spray Voltage: 3.5 kV (positive), 3.0 kV (negative)
- Capillary Temperature: 320°C
- Sheath Gas Flow: 40 arbitrary units
- Auxiliary Gas Flow: 10 arbitrary units
- Data Acquisition: Data-Dependent Acquisition (DDA) mode with top-N (e.g., 10) MS/MS fragmentation per cycle [1]
Data Processing and Metabolite Annotation
Protocol: Metabolite Annotation Using Molecular Networking
- Data Conversion: Convert raw LC-HRMS data to mzML format using conversion tools like MSConvert.
- Feature Detection: Process data using MZmine or similar software to detect chromatographic features, perform peak picking, alignment, and gap filling.
- Molecular Networking: Upload processed data to the Global Natural Products Social Molecular Networking (GNPS) platform
- Create Molecular Network: Set cosine score similarity threshold to 0.7 and minimum matched fragment ions to 4 to generate molecular families [1].
- Spectral Library Matching: Annotate metabolites by comparing experimental MS/MS spectra against reference spectra in GNPS libraries.
- In Silico Tools: Utilize DEREPLICATOR+, Network Annotation Propagation (NAP), and MS2LDA for additional structural annotations [1].
- Validation: Apply the Metabolomic Standard Initiative (MSI) level 2 identification criteria, requiring matching of retention time, accurate mass, and MS/MS fragmentation pattern with reference standards or library spectra [1].
The Scientist's Toolkit: Essential Research Reagents and Materials
Table 2: Key Research Reagent Solutions for LC-HRMS-Based Antifungal Metabolomics
| Reagent/Material | Function/Application | Examples/Specifications |
|---|---|---|
| LC-HRMS System | High-resolution metabolite separation and detection | Orbitrap-based mass spectrometers (e.g., Q-Exactive series); UHPLC systems with C18 columns [1] |
| Molecular Networking Platform | Metabolite annotation and dereplication | GNPS (Global Natural Products Social Molecular Networking) with Classical Molecular Networking workflow [1] |
| Spectral Libraries | Structural annotation of metabolites | GNPS spectral libraries, MassBank, HMDB; classifications: gold (fully characterized), silver (crude extract), bronze (partial annotation) [1] |
| In Silico Fragmentation Tools | Prediction of metabolite structures | DEREPLICATOR+, Network Annotation Propagation (NAP), Moldiscovery, MS2LDA [1] |
| Solvent Systems | Metabolite extraction and separation | Ethanol, ethyl acetate, methanol, acetonitrile with 0.1% formic acid for LC-MS compatibility [1] [15] |
| Chemometric Software | Statistical analysis of metabolomic data | XCMS Online, MetaboAnalyst, SIMCA-P for multivariate analysis [1] |
Workflow and Pathway Visualization
Workflow for LC-HRMS-Based Antifungal Compound Discovery
Biosynthetic Pathways of Key Antifungal Compound Classes
The integration of LC-HRMS-based metabolomics with advanced bioinformatics tools like molecular networking provides a powerful framework for discovering and characterizing antifungal compounds from Orchidaceae and other medicinal plants. Stilbenoids, flavonoids, and terpenoids represent three structurally diverse yet functionally complementary classes of specialized metabolites that constitute fundamental biochemical defenses against fungal pathogens.
The experimental protocols outlined in this application note provide a standardized approach for researchers to systematically investigate these antifungal compounds, from sample preparation through to metabolite annotation and biological validation. The continuing development of LC-HRMS technologies, coupled with increasingly sophisticated data analysis platforms, promises to accelerate the discovery of novel antifungal agents from plant sources, addressing the critical need for new therapeutic options in an era of increasing fungal resistance.
Historical and Ethnobotanical Use of Orchids in Traditional Medicine
Orchidaceae, one of the largest and most diverse families of flowering plants, has been deeply intertwined with human health and traditional medicine for millennia [16]. With over 28,000 species, orchids have evolved complex biochemical profiles that have been empirically harnessed by cultures worldwide to treat various ailments [17]. This application note situates these historical uses within the context of modern metabolomic research, particularly focusing on LC-HRMS-based antifungal screening. We provide a synthesized overview of ethnobotanical knowledge, quantitative data on traditionally used species, and detailed experimental protocols that bridge traditional wisdom with contemporary analytical methodologies aimed at validating and exploiting the medicinal potential of orchids for drug discovery.
Historical and Ethnobotanical Context
The medicinal use of orchids dates back to ancient civilizations. The first written records originate from China around 2800 B.C., while in the Ayurvedic tradition of India, orchids like Herminium edgeworthii and Habenaria intermedia were integral components of formulations such as Ashtavarga [17] [16]. In classical European medicine, Greek scholars like Theophrastus (c. 372–288 B.C.) named orchids for their tuberous resemblance to testicles ("όρχεις") and documented their use as aphrodisiacs, a belief perpetuated by later figures including Pliny the Elder and Dioscorides [17].
A survey of scientific literature reveals detailed ethnobotanical uses for at least 62 native European orchid species [17]. The primary organs harvested are the hypogean parts (tubers or rhizomes), with 75.8% of documented species used for Salep production—a flour and beverage made from ground tubers [17]. Furthermore, 66.13% of these species had tubers consumed as medicinal food, while other plant parts were used less frequently [17]. The most frequently cited species in European traditions include Anacamptis morio and Orchis mascula [17].
Table 1: Traditional Medicinal Uses of Selected Orchid Species
| Orchid Species | Traditional Preparation | Reported Medicinal Uses | Geographical Region |
|---|---|---|---|
| Anacamptis coriophora s.l. | Salep from tubers (decoction) | Cold, cough, inflammation, gastrointestinal problems, wounds, abscess; tonic and aphrodisiac | Bulgaria, Serbia, Turkey, Greece [17] |
| Anacamptis laxiflora | Salep from tubers | Astringent, expectorant, anti-diarrheal, bronchitis, convalescence | Southern Europe, Serbia, Turkey [17] |
| Dendrobium spp. | Medicinal tea | Cancer treatment, immune system strengthening, eyesight improvement | China [18] |
| Orchis mascula,O. militaris | Salep flour and beverage | Sore throat, digestive problems, diarrhea, gum disease | Turkey, Saudi Arabia, Iran [17] [18] |
| Laelia anceps | Ethanol extract from roots | Treatment of pain, postpartum pain | Mexico [19] |
| Cyrtopodium macrobulbon | Ethanol extract from roots | Painful urination, wounds, burns, antinociceptive activity | Mexico [19] |
Phytochemistry and Pharmacological Potential
Orchids produce a diverse array of secondary metabolites with significant pharmacological potential. Modern phytochemical investigations have identified numerous bioactive compounds, which can be broadly categorized as follows:
- Polyphenols: This large class includes flavonoids, phenolic acids, stilbenoids, tannins, and chromones [1]. These compounds often possess antioxidant, anti-inflammatory, and antimicrobial properties.
- Alkaloids: Nitrogen-containing compounds that have been extensively studied in orchids, some with notable neurological and therapeutic effects [16].
- Terpenoids: A vast group of compounds including monoterpenoids, sesquiterpenoids, diterpenoids, and triterpenoids, with a wide range of biological activities [1].
- Bibenzyls and Phenanthrenes: Specific to orchids, compounds like orchinol, hircinol, and loroglossol are phytoalexins with demonstrated antifungal activity, playing a role in plant defense [1] [19].
Recent LC-HRMS/MS-based metabolomic studies have significantly advanced our ability to rapidly profile these constituents. For instance, an analysis of Vanda and Cattleya genera putatively annotated 53 metabolites, including 35 flavonoids, 10 stilbenoids, and 20 terpenoids, showcasing the chemical diversity within the family [1]. Such detailed metabolic profiling is crucial for linking traditional uses to specific bioactive compounds.
LC-HRMS/MS Metabolomics for Antifungal Screening: A Detailed Protocol
This protocol outlines an LC-HRMS/MS-based untargeted metabolomics workflow for detecting antifungal compounds in Orchidaceae extracts, leveraging the historical knowledge of their medicinal use. The method is adapted from contemporary research investigating the metabolic differences between healthy and fungal-infected orchid plants [1].
Experimental Workflow
The diagram below illustrates the complete experimental workflow from sample preparation to data analysis.
Materials and Reagents
Table 2: Essential Research Reagents and Materials
| Item | Specification / Function | Application Notes |
|---|---|---|
| Plant Material | Healthy and fungal-infected tissues of target orchid species. | Vouchers must be deposited in a recognized herbarium for taxonomic validation [19]. |
| Extraction Solvent | Ethanol (HPLC/MS grade). Acts as a versatile solvent for a broad range of secondary metabolites [1]. | Other solvents (e.g., methanol, dichloromethane) can be used for targeted compound classes. |
| LC Mobile Phases | A: Water with 0.1% Formic Acid;B: Acetonitrile with 0.1% Formic Acid. | Acidification improves protonation and peak shape in ESI+. LC-MS grade solvents are critical. |
| LC Column | C18 reversed-phase column (e.g., 2.1 x 100 mm, 1.8 µm). | Provides high-resolution separation of complex plant metabolite mixtures. |
| Mass Spectrometer | High-resolution mass spectrometer (e.g., Orbitrap). | Enables accurate mass measurement (<5 ppm error) and MS/MS fragmentation for structural elucidation [1]. |
Step-by-Step Procedure
Step 1: Sample Preparation and Extraction
- Lyophilization: Freeze fresh orchid plant material (e.g., leaves, roots, pseudobulbs) in liquid nitrogen and lyophilize for 48-72 hours. Pulverize the material using a ball mill.
- Extraction: Weigh 100 mg of the dry powder accurately. Add 1 mL of ethanol (HPLC grade) and subject to ultrasonic-assisted extraction for 30 minutes at room temperature.
- Clarification: Centrifuge the extracts at 14,000 × g for 15 minutes. Carefully collect the supernatant.
- Storage: Filter the supernatant through a 0.22 µm PTFE membrane and store at -20 °C until LC-HRMS/MS analysis [1] [19].
Step 2: LC-HRMS/MS Analysis
- Chromatography:
- Column: Maintain a C18 column at 40 °C.
- Flow Rate: 0.3 mL/min.
- Injection Volume: 5 µL.
- Gradient: Use a linear gradient from 5% to 100% B over 30 minutes, followed by a 5-minute wash and re-equilibration.
- Mass Spectrometry:
- Ionization Mode: Electrospray Ionization (ESI), positive mode.
- Full Scan Parameters: Resolution > 60,000; mass range 100–1500 m/z.
- Data-Dependent MS/MS: Top N (e.g., 10) most intense ions from the full scan should be selected for fragmentation per cycle. Set collision energy to a stepped value (e.g., 20, 40, 60 eV) [1].
Step 3: Data Processing and Metabolite Annotation
- Convert raw data files to an open format (e.g., .mzML) using vendor software or ProteoWizard.
- Process with Feature-Based Molecular Networking (FBMN) on the GNPS platform:
- Upload the files to GNPS.
- Set precursor and fragment ion mass tolerances (e.g., 0.02 Da and 0.05 Da, respectively).
- Create a molecular network with a minimum cosine score of 0.7.
- Dereplication and Annotation:
Step 4: Data Analysis and Target Identification
- Chemometric Analysis: Perform multivariate statistical analysis (e.g., PCA, OPLS-DA) on the processed feature table to identify ions that are significantly more abundant in fungal-infected samples compared to healthy controls.
- Prioritization: Cross-reference these statistically significant features with the annotated metabolites, focusing on known antifungal classes like stilbenoids (e.g., orchinol, hircinol) [1]. These are the primary hits for further antifungal validation.
Table 3: Key Resources for Orchid Metabolomics and Antifungal Screening
| Category / Resource | Description & Function | Example Tools / Databases |
|---|---|---|
| Analytical Instrumentation | LC-HRMS/MS system for high-resolution separation and structural characterization of metabolites. | Orbitrap-based Mass Spectrometers, UHPLC systems. |
| Data Analysis Platforms | Cloud-based platform for processing MS/MS data, molecular networking, and spectral matching. | Global Natural Products Social Molecular Networking (GNPS) [1]. |
| Spectral Libraries | Reference databases for comparing experimental MS/MS spectra to known compounds. | GNPS Libraries, MassBank, NIST MS/MS Library. |
| In Silico Tools | Software for predicting molecular formulas, fragmentation trees, and compound classes. | SIRIUS, Dereplicator+, Network Annotation Propagation (NAP) [1]. |
| Bioactivity Assays | Methods to validate the hypothesized antifungal activity of prioritized metabolites. | Microbroth dilution assays against pathogenic fungi (e.g., Candida albicans). |
The historical and ethnobotanical record provides an invaluable roadmap for modern pharmacological investigation into the Orchidaceae family. The protocol detailed herein offers a robust, reproducible framework for applying LC-HRMS/MS-based metabolomics to screen orchid extracts for antifungal compounds efficiently. This integrated approach—from traditional knowledge to cutting-edge analytical science—significantly accelerates the targeted discovery of bioactive natural products, paving the way for the development of new antifungal agents while scientifically validating centuries of traditional use. Researchers are encouraged to apply this workflow to the vast number of unexplored orchid species, particularly those with documented ethnobotanical uses, ensuring that this work is conducted within the frameworks of CITES and local regulations to protect these often-threatened plants.
Integrating Transcriptomics and Metabolomics to Decipher Biosynthetic Pathways
The discovery of novel bioactive compounds, such as antifungal agents from Orchidaceae, is often limited by the complexity of their biosynthetic pathways. Integrative transcriptomic and metabolomic analyses provide a powerful framework to overcome this challenge, enabling the systematic identification of key genes and enzymes responsible for the production of valuable specialized metabolites. Within the context of Orchidaceae metabolomics and LC-HRMS antifungal screening, this approach allows researchers to move from simple metabolite detection to a comprehensive understanding of the underlying genetic regulation and biochemical transformations. This Application Note details a standardized protocol for integrating these multi-omics datasets to elucidate biosynthetic pathways, accelerating the discovery of new antifungal leads from orchid species.
Experimental Design and Workflow
The successful integration of transcriptomics and metabolomics requires a carefully planned experimental design and a structured bioinformatic workflow. The core of the approach involves parallel generation of gene expression and metabolite abundance data from the same biological samples, followed by coordinated bioinformatic analysis to find correlated patterns.
The general workflow, detailed in the diagram below, encompasses all stages from sample preparation to pathway validation.
Key Considerations for Orchidaceae Studies
When applying this workflow to Orchidaceae antifungal research, several specific factors are critical:
- Sample Selection: Include both healthy and fungal-infected plant tissues to capture the dynamic biochemical response to pathogen challenge [4] [20].
- Time-Series Design: Collect samples across multiple time points to distinguish transient from sustained metabolic responses, which is crucial for capturing the induction of defense compounds [5].
- Tissue Specificity: Consider that bioactive compounds may be synthesized in specific organs; analysis of roots, stems, leaves, and flowers separately can provide localized pathway information [21].
Materials and Reagents
Research Reagent Solutions
The following table lists essential reagents and materials required for the transcriptomic and metabolomic profiling of Orchidaceae samples.
| Category | Item | Function & Application Notes |
|---|---|---|
| Sample Collection & Stabilization | Liquid Nitrogen | Instantaneous freezing of tissue to preserve RNA and metabolite integrity. |
| RNAlater Solution | Stabilizes and protects cellular RNA in tissue samples during storage. | |
| Ceramic Beads | Homogenization of tough orchid tissue in mechanical grinders. | |
| RNA Sequencing | RNAprep Pure Plant Kit (Polysaccharide-rich) | Total RNA extraction, optimized for polyphenol-rich plants like orchids [21]. |
| Illumina NovaSeq 6000 Platform | High-throughput sequencing (e.g., PE150 mode) for transcriptome generation [21]. | |
| LC-HRMS Metabolomics | Methanol, Acetonitrile (HPLC grade) | Organic solvents for metabolite extraction from plant powder [4] [21]. |
| Formic Acid (Optima LC/MS grade) | Mobile phase additive for improved ionization in ESI positive mode. | |
| Acquity UPLC HSS T3 Column (1.8 µm) | Reversed-phase column for resolving complex plant metabolite mixtures [21]. | |
| Waters Xevo G2-XS QTof Mass Spectrometer | High-resolution mass spectrometer for accurate mass and MS/MS data [4] [21]. | |
| Data Analysis | GNPS (Global Natural Products Social) Platform | Molecular networking and spectral library matching for metabolite annotation [4]. |
| MEANtools Software | Predicts candidate metabolic pathways by integrating correlated transcript and metabolite data [22]. |
Protocol: Data Generation and Integration
Metabolite Profiling via LC-HRMS/MS
This protocol is adapted from methodologies successfully applied to Orchidaceae species [4] [21].
Steps:
Metabolite Extraction:
- Weigh 50 mg of lyophilized and powdered orchid tissue (e.g., leaf, stem).
- Add 1,000 µL of ice-cold extraction solution (Methanol:Acetonitrile:Water, 2:2:1, v/v) containing an internal standard.
- Homogenize using a tissue grinder with ceramic beads at 45 Hz for 10 minutes.
- Sonicate the samples in an ice-water bath for 10 minutes.
- Incubate at -20°C for 1 hour to precipitate proteins.
- Centrifuge at 12,000-14,000 rpm for 15 minutes at 4°C.
- Transfer 500 µL of the supernatant to a new tube and dry completely in a vacuum concentrator.
- Reconstitute the dried metabolite pellet in 160 µL of 50% acetonitrile, vortex, sonicate, and centrifuge. Transfer 120 µL of the supernatant to a LC-MS vial for analysis [21].
LC-HRMS/MS Analysis:
- Chromatography: Use a reversed-phase UPLC column (e.g., HSS T3) maintained at 40°C. The mobile phase consists of (A) 0.1% formic acid in water and (B) 0.1% formic acid in acetonitrile. Apply a linear gradient from 5% B to 95% B over 15-20 minutes.
- Mass Spectrometry: Acquire data in data-dependent acquisition (DDA) mode on a high-resolution mass spectrometer (e.g., Orbitrap or Q-ToF). Collect full-scan MS data (e.g., m/z 100-1500) in both positive and negative electrospray ionization (ESI) modes. Select the top N most intense ions from the MS1 scan for fragmentation to generate MS/MS spectra.
Metabolite Annotation:
- Process raw data (peak picking, alignment, normalization) using software like MS-DIAL or XCMS.
- Annotate metabolites by querying MS1 and MS/MS data against public databases (e.g., GNPS, HMDB, LipidMaps) [4]. A confidence level (e.g., Level 1 for confirmed structure with standard, Level 2 for putative annotation based on spectral similarity) should be assigned to each annotation according to metabolomics standards [4].
Transcriptome Sequencing and Analysis
This protocol outlines RNA sequencing for gene expression analysis in orchid tissues [5] [21].
Steps:
RNA Extraction and QC:
- Extract total RNA from the same source tissue used for metabolomics using a kit designed for polysaccharide- and polyphenol-rich plants (e.g., RNAprep Pure Plant Kit).
- Assess RNA integrity and purity using an Agilent Bioanalyzer or similar. Ensure RNA Integrity Number (RIN) > 8.0 for high-quality libraries.
Library Preparation and Sequencing:
- Construct cDNA libraries using a standard kit (e.g., Illumina TruSeq Stranded mRNA).
- Perform quality control on the final libraries using qPCR or a Bioanalyzer.
- Sequence the libraries on an Illumina platform (e.g., NovaSeq 6000) to generate a minimum of 40 million paired-end (e.g., 150 bp) reads per sample [21].
Bioinformatic Analysis:
- Quality-trim raw reads using Trimmomatic or Fastp.
- Map the clean reads to a reference genome (if available) or perform de novo transcriptome assembly using tools like Trinity.
- Quantify gene expression levels (e.g., as TPM or FPKM).
- Identify Differentially Expressed Genes (DEGs) between conditions (e.g., infected vs. healthy) using tools like DESeq2 or edgeR, with typical thresholds of |log2FC| > 1 and adjusted p-value < 0.05 [5].
Multi-Omics Data Integration and Pathway Analysis
This is the crucial step for deciphering biosynthetic pathways.
Steps:
Correlation Analysis:
Co-expression Network Construction:
- Perform Weighted Gene Co-expression Network Analysis (WGCNA) to group genes with highly correlated expression patterns into modules.
- Correlate these gene modules with metabolite abundance data or key phenotypic traits (e.g., antifungal activity) to identify modules of biological interest [5].
Pathway Enrichment and Reconstruction:
- Conduct KEGG pathway enrichment analysis separately on the lists of DEGs and DAMs.
- Identify pathways that are significantly enriched in both datasets (e.g., phenylpropanoid biosynthesis, terpenoid backbone biosynthesis) [5] [24].
- Overlay the correlated DEGs and DAMs onto these shared pathways to visualize the integrated network and pinpoint key regulatory nodes and potential pathway gaps.
Candidate Gene Identification and Validation:
- Within the enriched pathways, prioritize genes that are highly correlated with metabolites of interest (e.g., a stilbenoid with antifungal activity). These are candidate genes for encoding biosynthetic enzymes.
- Validate the function of candidate genes through techniques such as qRT-PCR to confirm expression patterns [21], or heterologous expression in systems like E. coli or N. benthamiana to confirm enzyme activity [22].
Data Analysis and Interpretation
Key Analytical Results
The following table summarizes the types of quantitative results and their biological interpretations that can be expected from a typical integrated study on Orchidaceae, based on recent research.
| Analysis Type | Exemplary Data from Orchidaceae Studies | Biological Interpretation |
|---|---|---|
| Differential Metabolites | 106 DAMs between control and severe drought stress in D. nobile [5]; 53 metabolites annotated in Vanda and Cattleya, including stilbenoids and flavonoids [4]. | Indicates metabolic pathways actively responding to the experimental condition (e.g., stress, infection). |
| Differentially Expressed Genes | 718 common DEGs across progressive drought stress time points in D. nobile [5]; 2,767 DEGs between flower bud and open flower in D. officinale [21]. | Reveals the genetic reprogramming underlying the observed metabolic changes. |
| Enriched Pathways (KEGG) | Phenylpropanoid biosynthesis; Stilbenoid, diarylheptanoid biosynthesis; Terpenoid biosynthesis [24] [21]; Arginine and proline metabolism [5]. | Pinpoints the core biochemical routes involved in the plant's response, highlighting potential antifungal biosynthetic pathways. |
| Key Candidate Genes | PAL, 4CL (upstream phenylpropanoid); DXS, HMGCS (terpenoid backbone); Polyphenol oxidase, C4H [5] [24]. | Prioritizes targets for functional validation and genetic engineering. |
| Key Candidate Metabolites | Stilbenoids (e.g., orchinol), flavonoids, phenolic acids [4]. | Identifies the final or intermediate chemical products of the activated pathways, with potential antifungal activity. |
Pathway Mapping and Visualization
Integrating the results from the correlation and enrichment analyses allows for the reconstruction of a putative biosynthetic pathway. The diagram below illustrates a generalized pathway for the biosynthesis of antifungal phenylpropanoids (e.g., stilbenoids) in Orchidaceae, showing the interaction between genes and metabolites.
Application in Orchidaceae Antifungal Research
The integrated transcriptomic and metabolomic approach is particularly powerful for discovering antifungal compounds in Orchidaceae. LC-HRMS-based metabolomics can rapidly profile the metabolic dynamic between healthy and fungal-infected orchid plants, pinpointing metabolites that are induced upon infection [4]. Concurrent transcriptomics reveals the genetic machinery activated during this defense response. Molecular networking on platforms like GNPS can then group these induced metabolites with known antifungal compounds, such as stilbenoids (e.g., orchinol), based on spectral similarity [4]. By integrating these datasets, researchers can directly link the induction of a specific antifungal metabolite to the upregulation of its biosynthetic genes, providing a clear target pathway for further investigation and biotechnological application [4] [20]. This strategy transforms the process from a simple screening of extracts to a rational dissection of plant defense mechanisms.
LC-HRMS Workflows in Action: From Sample to Annotation
Designing an Untargeted Metabolomics Workflow for Orchid Extracts
Orchidaceae represents one of the largest and most diverse plant families, with immense potential for discovering novel bioactive compounds. In the context of antifungal screening research, untargeted metabolomics using liquid chromatography-high-resolution mass spectrometry (LC-HRMS) has emerged as a powerful technology for comprehensively identifying specialized metabolites involved in plant defense mechanisms [1] [4]. This application note provides a detailed protocol for designing an untargeted metabolomics workflow specifically optimized for orchid extracts, enabling the discovery of antifungal compounds through advanced analytical and computational approaches.
The protocol outlined below leverages state-of-the-art tools for structural annotation and data analysis, offering researchers a standardized methodology for investigating the metabolic dynamics of orchid species in response to fungal infection [1]. By implementing this workflow, scientists can rapidly annotate metabolites, discriminate between healthy and fungal-infected plant samples, and identify promising antifungal candidates such as stilbenoids, flavonoids, and terpenoids previously detected in Orchidaceae species [1] [25].
The complete untargeted metabolomics workflow for orchid extracts encompasses sample preparation, LC-HRMS analysis, data processing, and metabolite annotation, culminating in the identification of potential antifungal compounds. This integrated approach facilitates the metabolic dynamic assessment of Orchidaceae species under pathological conditions.
Materials and Reagents
Research Reagent Solutions
Table 1: Essential reagents and materials for untargeted metabolomics of orchid extracts
| Item | Function/Purpose | Specifications/Alternatives |
|---|---|---|
| Orchid Plant Material | Source of metabolites for analysis | Healthy and fungal-infected samples of Vanda, Cattleya, or other Orchidaceae genera [1] |
| Extraction Solvent | Metabolite extraction from plant tissue | Acetone/water (70:30 v/v) or methanol/water mixtures [26] [27] |
| LC-MS Grade Solvents | Mobile phase for chromatographic separation | Acetonitrile, methanol, and water with 0.1% formic acid [1] [26] |
| Analytical Column | Chromatographic separation of metabolites | Reversed-phase (e.g., PFP column) or HILIC for polar metabolites [26] [27] |
| Reference Standards | Metabolite identification and quantification | Commercial standards for key orchid metabolites (e.g., chrysin, orchinol) [25] |
| Quality Control (QC) Sample | Monitoring instrument performance | Pooled aliquot of all experimental samples [26] |
Experimental Protocols
Sample Preparation and Extraction
Proper sample preparation is critical for comprehensive metabolite extraction from orchid tissues. The following protocol has been optimized for various orchid organs, including pseudobulbs, leaves, and flowers [25] [27].
Plant Material Collection and Preservation: Collect orchid tissues (approximately 50-200 mg) from both healthy and fungal-infected plants. Immediately freeze samples in liquid nitrogen and store at -80°C until extraction [26].
Lyophilization: Freeze-dry samples overnight at -80°C to remove water content and preserve labile metabolites [1].
Tissue Homogenization: Pulverize the lyophilized tissue using a mixer mill or similar homogenization device. Maintain samples at low temperature during processing to prevent metabolite degradation.
Metabolite Extraction:
Sample Preparation for Analysis:
- Aliquot 200 µL of extract, dry under nitrogen or vacuum, and reconstitute in 200 µL of MilliQ-water/methanol (90:10 v/v) [26].
- Filter through 0.22 µm membrane before LC-HRMS analysis.
LC-HRMS Analysis Parameters
Liquid chromatography coupled to high-resolution mass spectrometry provides the analytical foundation for untargeted metabolomics. The following method has been successfully applied to orchid extracts [1] [26].
Table 2: Optimized LC-HRMS parameters for analysis of orchid metabolites
| Parameter | Specifications | Alternative Options |
|---|---|---|
| LC System | UHPLC with binary pump | Conventional HPLC for lower throughput |
| Column | Reversed-phase (e.g., PFP, 2.1 × 100 mm, 2.7 µm) | HILIC for polar metabolites [27] |
| Mobile Phase | A: Water + 0.1% formic acidB: Acetonitrile + 0.1% formic acid | Acid replaced with ammonium acetate for negative mode |
| Gradient Program | 1-41% B in 20 min, 41-60% B in 4 min, 60-80% B in 0.1 min, hold 1.9 min, return to 1% B in 0.1 min, re-equilibration [26] | Adjust gradient steepness based on metabolite polarity |
| Flow Rate | 0.35 mL/min | 0.2-0.5 mL/min depending on column dimensions |
| Injection Volume | 2-5 µL | Adjust based on metabolite concentration |
| MS Instrument | Q-Exactive Orbitrap or similar high-resolution mass spectrometer | Other HRMS platforms (Q-TOF, FT-ICR) |
| Ionization Mode | ESI positive and/or negative mode | Both modes recommended for comprehensive coverage |
| Mass Resolution | 140,000 (FWHM @ m/z 200) for full scan17,500 for MS/MS | Adjustable based on instrument capabilities |
| Mass Range | m/z 140-1800 | Expand for specialized metabolite classes |
| Data Acquisition | Full scan/dd-MS² (top 7 most abundant ions) | DIA methods for comprehensive fragmentation |
Data Processing and Metabolite Annotation
The computational workflow transforms raw LC-HRMS data into biologically meaningful metabolite annotations, with particular emphasis on antifungal compounds in orchid extracts.
Raw Data Conversion: Convert vendor-specific raw files to open formats (e.g., mzML) using tools like ProteoWizard or MSConvert [28].
Feature Detection and Alignment:
Multivariate Statistical Analysis:
- Perform unsupervised methods (PCA) to assess data quality and overall grouping.
- Apply supervised methods (PLS-DA, OPLS-DA) to identify metabolites discriminating healthy and fungal-infected samples.
Molecular Networking and Dereplication:
- Create molecular networks using GNPS platform with cosine similarity threshold ≥0.7 [1].
- Annotate metabolites through spectral library matching (GNPS, mzCloud) and in silico fragmentation tools (Dereplicator+, NAP, MolDiscovery) [1] [29].
- Confirm annotations using manual inspection of MS/MS fragmentation patterns and chromatographic data.
Pathway Analysis:
- Map annotated metabolites to biochemical pathways using KEGG or PlantCyc databases.
- Identify enriched pathways related to plant defense mechanisms.
Antifungal Metabolite Discovery in Orchidaceae
Implementation of this workflow has demonstrated particular efficacy in identifying antifungal compounds in Orchidaceae species. The table below summarizes key metabolite classes implicated in plant defense mechanisms against fungal pathogens.
Table 3: Antifungal metabolite classes identified in Orchidaceae species using untargeted metabolomics
| Metabolite Class | Specific Examples | Relative Abundance | Antifungal Significance |
|---|---|---|---|
| Stilbenoids | Orchinol, Hircinol | Increased in fungal-infected plants [1] | Phytoalexins responsible for protection against microbial attacks [1] |
| Flavonoids | Tricin derivatives, C-diglycosylated chrysin | Variable across species [1] [25] | Promising antifungal metabolites; some exclusive to healthy plants [1] |
| Phenolic Acids | Hydroxybenzaldehydes, cinnamic acids | Consistent across samples [1] | Associated with biochemical responses to microbial attacks [1] |
| Terpenoids | Loliolide, diterpenoids | Higher in healthy plants [1] | Promising antifungal metabolites [1] |
| Phenanthrenes | Various substituted phenanthrenes | Abundant in certain species [30] | Contributing to antioxidant and defense activities [30] |
Applications in Antifungal Screening Research
The integration of this untargeted metabolomics workflow within antifungal screening research provides powerful insights into plant-pathogen interactions and facilitates the discovery of novel bioactive compounds.
Metabolic Dynamic Assessment
The workflow enables tracking of metabolic changes in orchid species in response to fungal infection. Key applications include:
Discrimination of Physiological States: Molecular networking and chemometric methods effectively discriminate ions that differentiate healthy and fungal-infected plant samples, revealing defense-related metabolic reprogramming [1].
Stilbenoid Synthesis Monitoring: The protocol facilitates evaluation of metabolic dynamics through the synthesis of stilbenoids in fungal-infected plants, identifying phytoalexins with documented antifungal activity [1].
Species-Specific Defense Responses: Comparative analysis across multiple orchid genera (e.g., Vanda, Cattleya, Oncidium) reveals species-specific defense mechanisms and specialized metabolite production [1] [25].
Identification of Novel Antifungal Leads
The untargeted approach has successfully identified rare bioactive compounds with potential pharmaceutical applications:
Rare Chrysin Derivatives: Analysis of Oncidium sotoanum revealed strong accumulation of C-diglycosylated chrysin derivatives, which are rarely found in nature and exhibit diverse pharmaceutical properties [25].
Specialized Phenolic Compounds: The workflow has enabled identification of 53+ metabolites in orchid extracts, with specialized polyphenols representing dominant classes associated with defense functions [1].
Compound Prioritization: By correlating metabolite abundance with antifungal activity, researchers can prioritize leads for further investigation, focusing on compounds that are either induced by infection or constitutively present in resistant varieties.
Method Customization and Optimization
While the presented workflow provides a robust foundation, specific applications may require method optimization:
Sample Preparation Adjustments: The extraction protocol can be modified based on target metabolite polarity. Methanol-based extractions generally provide better coverage of polar metabolites, while acetone-water mixtures may enhance extraction of medium-polarity compounds [27].
Chromatographic Optimization: Gradient programs should be adjusted based on the specific orchid species and tissues analyzed. Pseudobulbs, leaves, and flowers may exhibit distinct metabolite profiles requiring tailored separation methods [25].
Data Processing Refinement: For large-scale studies, implementing tools like NOREVA can optimize processing workflows by evaluating multiple normalization strategies and processing sequences to identify the best-performing approach for specific datasets [28].
This comprehensive protocol provides researchers with a standardized yet flexible framework for implementing untargeted metabolomics in Orchidaceae antifungal research, facilitating the discovery of novel bioactive compounds and advancing our understanding of plant defense mechanisms.
Chromatographic Separation and High-Resolution Mass Spectrometry Detection
The identification of novel antifungal agents is a critical pursuit in modern drug discovery. Within this context, Orchidaceae species represent a promising reservoir of bioactive secondary metabolites. This protocol details the application of liquid chromatography coupled to high-resolution tandem mass spectrometry (LC-HRMS/MS) for the comprehensive metabolomic analysis of Orchidaceae species, specifically targeting the discovery of antifungal compounds [4]. The methodology outlined enables the efficient fingerprinting of complex plant extracts, discrimination of metabolic profiles between healthy and fungal-infected plants, and rapid annotation of potentially novel bioactive molecules through advanced dereplication strategies [4] [1].
Experimental Workflow and Protocol
The following section provides detailed methodologies for the key experimental procedures in Orchidaceae metabolomics research, from sample preparation to instrumental analysis.
Sample Preparation Protocol
- Plant Material Collection: Collect healthy and fungal-infected plant material from Orchidaceae species (e.g., Vanda and Cattleya genera). Immediately freeze the samples in liquid nitrogen and store at -80°C until extraction [4] [1].
- Extraction Procedure:
- Lyophilize the plant material and pulverize it to a fine powder using a ball mill.
- Weigh 100 mg ± 5 mg of the powdered material into a 15 mL centrifuge tube.
- Add 10 mL of ethanol (HPLC grade) and vortex for 1 minute.
- Subject the mixture to ultrasonic extraction for 30 minutes at 25°C.
- Centrifuge at 4,000 × g for 10 minutes.
- Carefully transfer the supernatant to a new tube.
- Repeat the extraction twice on the pellet and combine the supernatants.
- Evaporate the combined extracts to dryness under a gentle stream of nitrogen gas.
- Reconstitute the dry residue in 1 mL of methanol (LC-MS grade) and filter through a 0.22 µm PTFE membrane prior to LC-HRMS/MS analysis [4] [1] [31].
LC-HRMS/MS Analysis Parameters
The table below summarizes the representative chromatographic and mass spectrometric conditions used for untargeted metabolomics of Orchidaceae species.
Table 1: Standard LC-HRMS/MS Parameters for Orchidaceae Metabolite Profiling
| Parameter | Specification |
|---|---|
| Chromatography System | UHPLC (e.g., Vanquish or equivalent) |
| Column | C18 reversed-phase (e.g., 2.1 × 100 mm, 1.7 µm) |
| Mobile Phase A | Water with 0.1% Formic Acid |
| Mobile Phase B | Acetonitrile with 0.1% Formic Acid |
| Gradient Program | 5% B (0-1 min), 5-100% B (1-25 min), 100% B (25-28 min), 100-5% B (28-29 min), 5% B (29-32 min) [31] [32] |
| Flow Rate | 0.3 mL/min |
| Injection Volume | 2-5 µL |
| Mass Spectrometer | Orbitrap-based HRMS (e.g., Q-Exactive series) |
| Ionization Mode | Electrospray Ionization (ESI), positive and/or negative mode |
| MS1 Resolution | ≥ 70,000 Full Width at Half Maximum (FWHM) |
| MS/MS Resolution | ≥ 17,500 FWHM |
| Scan Range | m/z 100-1500 |
| Fragmentation | Data-Dependent Acquisition (DDA) with stepped normalized collision energy (e.g., 20, 30, 40 eV) [4] [1] |
The following diagram illustrates the complete experimental workflow from sample preparation to data acquisition:
Data Processing and Metabolite Annotation
Raw data processing is a critical step for converting instrumental data into biologically meaningful information. The workflow involves feature detection, alignment, and compound identification.
Data Pre-processing and Statistical Analysis
- Convert Raw Data: Use conversion tools (e.g., MSConvert) to transform raw vendor files into open formats (.mzML, .mzXML).
- Feature Detection and Alignment: Process files using software such as MZmine3, XCMS, or MS-DIAL for peak picking, retention time alignment, and feature grouping [33].
- Quality Control (QC): Inject and process pooled QC samples throughout the analytical batch. Use QC data to perform signal correction and remove features with high variance (typically >30% RSD) to ensure data quality [33].
- Multivariate Statistical Analysis:
- Differential Analysis: Generate volcano plots by plotting the -log10(p-value) against the log2(fold change) to visualize metabolites that are significantly altered between experimental conditions [34].
Metabolite Annotation and Dereplication
Annotation is performed using a combination of spectral libraries and in silico tools to determine metabolite identities with varying confidence levels as defined by the Metabolomics Standards Initiative (MSI) [4] [33].
Table 2: Key Bioinformatics Tools for Metabolite Annotation in Orchidaceae Research
| Tool Name | Type | Primary Function | Application in Orchidaceae Analysis |
|---|---|---|---|
| GNPS Platform | Spectral Library | Classical Molecular Networking & spectral matching [4] [1] | Annotate known metabolites via MS/MS spectral similarity (Level 2 annotation) |
| Dereplicator+ | In Silico Tool | Molecular formula & fragmentation prediction [4] | Rapid identification of known natural products in complex extracts |
| Network Annotation Propagation (NAP) | In Silico Tool | Propagates annotations within a molecular network [4] | Extends identification to analogs of known compounds |
| SIRIUS | In Silico Tool | Molecular formula & structure prediction | Provides Level 3 annotation for unknown compounds |
The following diagram outlines the core data processing and annotation pipeline:
Key Findings and Antifungal Compound Profiles
Application of the above protocol to Orchidaceae species has yielded specific insights into their chemical defense mechanisms and potential antifungal leads.
Annotated Metabolite Classes in Orchidaceae
LC-HRMS/MS-based metabolomics of Vanda and Cattleya genera reveals a rich diversity of secondary metabolites. The following table quantifies the major annotated classes [4] [1]:
Table 3: Diversity of Secondary Metabolites Annotated in Orchidaceae Extracts
| Chemical Class | Number of Annotated Metabolites | Specific Examples | Putative Role in Defense |
|---|---|---|---|
| Flavonoids | 35 | Flavones, Flavonols, Isoflavones | Antioxidant, direct antimicrobial activity [4] |
| Stilbenoids | 10 | Orchinol, Hircinol | Phytoalexins, induced antifungal activity [4] [1] |
| Phenolic Acids | 10 | Cinnamic acid derivatives | Precursors to defense compounds, antimicrobial |
| Terpenoids | 20 | Diterpenoids, Sesquiterpenoids | Direct toxicity to fungal pathogens [4] |
| Alkaloids | 8 | Tryptophan, Nicotinic acid alkaloids | Bioactive defense compounds [4] |
Promising Antifungal Metabolites
Comparative analysis of healthy and fungal-infected plants highlights key metabolites involved in biochemical responses:
- Stilbenoids: Compounds such as orchinol and hircinol show induced synthesis in fungal-infected plants, confirming their role as phytoalexins [4] [1].
- Flavonoids and Terpenoids: A tricin derivative flavonoid and the terpenoid loliolide, found exclusively in healthy plants, are proposed as promising constitutive antifungal metabolites [4].
- Metabolic Dynamics: The metabolic profiling indicates that the relative abundance of polyphenols, including flavonoids, phenolic acids, and stilbenoids, varies significantly between species and physiological conditions, underscoring their association with defense responses [4] [31].
The Scientist's Toolkit: Essential Research Reagents and Materials
The table below lists critical reagents, materials, and software solutions essential for executing the Orchidaceae LC-HRMS metabolomics workflow.
Table 4: Essential Research Reagents and Solutions for Orchidaceae LC-HRMS Metabolomics
| Item | Specification / Example | Function in Workflow |
|---|---|---|
| Extraction Solvent | Ethanol, HPLC Grade (≥99.9%) | Extraction of semi-polar and polar metabolites from plant tissue [4] [1] |
| LC-MS Solvents | Water & Acetonitrile with 0.1% Formic Acid (LC-MS Grade) | Mobile phase for chromatographic separation; acid enhances ionization [31] |
| Chromatography Column | C18 reversed-phase (e.g., 1.7 µm, 2.1 x 100 mm) | High-resolution separation of complex metabolite mixtures prior to MS detection |
| Internal Standards | Stable Isotope-Labeled Compounds | Monitoring instrument performance and correcting for matrix effects |
| Quality Control Material | Pooled QC Sample from all extracts | Assessing system stability, reproducibility, and data quality throughout the run [33] |
| Data Processing Software | MZmine3, XCMS, GNPS | Feature detection, alignment, and metabolite annotation [4] [33] |
| Statistical Software | MetaboAnalyst, R packages | Performing multivariate statistics (PCA, PLS-DA) and biomarker discovery [31] |
Molecular Networking and Chemometrics for Data Analysis and Sample Classification
In the context of Orchidaceae metabolomics for antifungal screening, Liquid Chromatography-High Resolution Tandem Mass Spectrometry (LC-HRMS/MS) enables the detection of hundreds to thousands of ions from a single sample [35]. Molecular networking (MN) and chemometrics provide a powerful framework to organize and interpret this complex data, facilitating the discovery of novel antifungal compounds [1] [36]. This application note details the protocols for applying these techniques to classify samples and identify metabolic dynamics in Orchidaceae species under fungal challenge.
Experimental Protocols
Sample Preparation and LC-HRMS/MS Analysis
Protocol: Sample Extraction and Analysis for Orchidaceae Metabolomics
- Sample Material: Use healthy and fungal-infected plant material from Orchidaceae genera (e.g., Vanda and Cattleya). Lyophilize the plant tissue and homogenize it into a fine powder [1].
- Extraction: Extract 1 mg of lyophilized powder with 1 mL of methanol or ethanol. Vortex for 1 minute, sonicate at 25°C for 10 minutes, and filter through a 0.22 μm nylon filter [1] [36].
- LC Separation: Employ a reversed-phase C18 column (e.g., 30 x 2.1 mm, 2.6 μm). Use a binary mobile phase system: (A) 10 mM ammonium formate + 0.1% formic acid in water and (B) 0.1% formic acid in acetonitrile. Apply a linear gradient from 5% B to 100% B over 9 minutes, hold at 100% B for 2 minutes, and re-equilibrate [36].
- HRMS/MS Analysis: Perform data-dependent acquisition (DDA) on a high-resolution mass spectrometer (e.g., Orbitrap) in positive electrospray ionization (ESI+) mode. Full MS scan parameters: resolution of 35,000 (FWHM), mass range 50-850 m/z. Data-dependent MS/MS parameters: resolution of 17,500 (FWHM), normalized collision energies (NCE) of 20, 30, and 40 [1] [36].
Data Preprocessing and Molecular Networking
Protocol: Creating a Molecular Network on GNPS
- Data Conversion: Convert raw LC-HRMS/MS data files (.raw) to open formats (.mzXML or .mzML) using tools like MSConvert from ProteoWizard. Ensure spectra are in centroid mode [36].
- File Upload: Navigate to the Global Natural Products Social Molecular Networking (GNPS) platform and select the "Create Molecular Network" job. Upload the converted files and a metadata table specifying sample groups (e.g., Healthy vs. Fungal-Infected) [37].
- Parameter Setup: Configure the analysis parameters. The table below summarizes key parameters and values optimized for Orchidaceae metabolomics data from high-resolution instruments [1] [37].
Table 1: Key GNPS Molecular Networking Parameters for LC-HRMS/MS Data from Orchidaceae
| Parameter | Description | Recommended Value for Orchidaceae Metabolomics |
|---|---|---|
| Precursor Ion Mass Tolerance | Mass tolerance for clustering similar MS1 ions. | 0.02 Da [37] |
| Fragment Ion Mass Tolerance | Mass tolerance for comparing MS2 fragment ions. | 0.02 Da [37] |
| Minimum Cosine Score | Spectral similarity threshold for edge formation. | 0.7 [1] |
| Minimum Matched Peaks | Minimum number of shared fragments for a connection. | 6 [37] |
| Network TopK | Maximum number of neighbors per node. | 10 [37] |
| Minimum Cluster Size | Minimum spectra to form a consensus spectrum. | 2 [37] |
| Library Search Min Matched Peaks | Minimum peaks for spectral library matching. | 6 [37] |
| Library Search Score Threshold | Minimum cosine score for a library match. | 0.7 [37] |
- Job Submission and Monitoring: Submit the job. Processing time varies from minutes for small datasets to hours for large datasets. Monitor the job status on the GNPS results page [37].
Advanced Annotation and Chemometrics
Protocol: Enhanced Annotation and Data Mining
- In-Silico Annotation Propagation: Use the Network Annotation Propagation (NAP) tool within GNPS to improve structural annotation in clusters with few or no library matches. NAP uses the molecular network topology and structural similarity of in-silico candidates to re-rank and propagate annotations [35].
- Feature-Based Molecular Networking (FBMN): For quantitative analysis, process the LC-HRMS data with software like MZmine to align chromatographic peaks and extract ion abundances. Export the feature table and MS2 data for FBMN in GNPS to create a network where node size can be proportional to ion abundance across samples [1].
- Chemometric Analysis: Export the feature abundance table from FBMN and import it into statistical software (e.g., R, SIMCA). Perform multivariate analysis such as Principal Component Analysis (PCA) and Orthogonal Projections to Latent Structures-Discriminant Analysis (OPLS-DA) to identify ions that significantly differentiate sample groups (e.g., healthy vs. infected) [1].
Key Results and Workflow
In a study on Vanda and Cattleya genera, this workflow enabled the rapid annotation of 53 metabolites, including flavonoids, stilbenoids, and terpenoids. Metabolomic profiling revealed a large production of polyphenols that varied in abundance between healthy and fungal-infected plants [1]. Chemometric methods and molecular networking successfully discriminated ions that differentiated the sample groups, identifying promising antifungal metabolites like a tricin derivative flavonoid and loliolide terpenoid found exclusively in healthy plants [1].
The following diagram illustrates the integrated workflow from sample preparation to biological insight.
Diagram 1: Integrated LC-HRMS/MS Metabolomics Workflow for Antifungal Screening.
The Scientist's Toolkit
Table 2: Essential Research Reagents and Computational Tools for LC-HRMS/MS-Based Metabolomics
| Item | Function/Description | Relevance to Orchidaceae Antifungal Screening |
|---|---|---|
| Methanol / Ethanol | High-purity solvents for metabolite extraction from plant tissue. | Used for preparing ethanolic extracts from healthy and fungal-infected Orchidaceae material [1]. |
| C18 UHPLC Column | Stationary phase for reversed-phase chromatographic separation of complex metabolite mixtures. | Critical for separating diverse secondary metabolites like polyphenols and terpenoids in orchid extracts [36]. |
| High-Resolution Mass Spectrometer (Orbitrap) | Instrument for accurate mass measurement and data-dependent MS/MS fragmentation. | Enables untargeted detection and provides high-quality fragmentation spectra for annotating novel antifungal compounds [1] [36]. |
| GNPS Platform | Web-based ecosystem for processing tandem MS data and molecular networking. | Core platform for creating molecular networks, spectral library matching, and using tools like NAP for annotation propagation [1] [35] [37]. |
| MSConvert (ProteoWizard) | Open-source software for converting and pre-processing raw mass spectrometry data files. | Prepares data in the correct format (.mzXML) for upload and analysis on the GNPS platform [36]. |
| MZmine / XCMS | Software for chromatographic alignment, peak detection, and feature quantification. | Used for Feature-Based Molecular Networking (FBMN) to integrate relative quantitation of metabolites across sample groups [1]. |
| Metadata Table | A text file (.txt or .csv) organizing input files into experimental groups (e.g., Healthy, Infected). | Essential for grouping samples in GNPS and for downstream chemometric analysis to find biomarkers of fungal infection [37]. |
Table 3: Summary of Key Metabolite Classes Annotated in Orchidaceae Species via LC-HRMS/MS and Molecular Networking [1]
| Metabolite Class | Number of Compounds Annotated | Examples | Notes on Abundance |
|---|---|---|---|
| Flavonoids | 35 | Flavones, Flavonols, Isoflavones | Most were glycosylated; varied significantly between healthy and infected samples. |
| Stilbenoids | 10 | Orchinol, Hircinol | Associated with biochemical defense responses; synthesis was dynamic in fungal-infected plants. |
| Terpenoids | 20 | Loliolide, Diterpenoids, Sesquiterpenoids | Loliolide was identified as a promising antifungal metabolite found only in healthy plants. |
| Phenolic Acids | 10 | Cinnamic acid derivatives | -- |
| Alkaloids | 8 | Tryptophan, Anthranilic acid derivatives | -- |
The integration of LC-HRMS/MS-based molecular networking and chemometrics provides a robust and efficient pipeline for antifungal discovery in Orchidaceae. This approach enables the rapid annotation of known compounds, the discovery of new structural leads, and the identification of metabolic biomarkers associated with plant defense mechanisms, significantly accelerating natural product-based drug development.
{# The Application of Dereplication Strategies in Orchidaceae Metabolomics LC-HRMS Antifungal Screening}
{: .no_toc}
- Authors: [Your Name/Institution]
- Correspondence: [Email Address]
- {.column-section}
Table of Contents
- Table of Contents
- Abstract and Introduction
- Foundational Concepts
- Integrated Dereplication Workflow
- Experimental Protocol
- Reagents and Software
- Application in Orchidaceae Research
- Conclusions
- References {.no_toc}
This application note details a comprehensive dereplication strategy for identifying known antifungal compounds in Orchidaceae species using Liquid Chromatography-High-Resolution Tandem Mass Spectrometry (LC-HRMS/MS). We provide a standardized protocol integrating spectral library matching and in silico fragmentation tools within the Global Natural Products Social Molecular Networking (GNPS) infrastructure to accelerate the discovery of novel bioactive metabolites. The methodology enables the rapid annotation of metabolites such as stilbenoids, flavonoids, and terpenoids, directly supporting antifungal screening efforts by minimizing the re-isolation of known compounds. By framing the protocols within an active Orchidaceae metabolomics research context, we offer a practical framework for researchers and drug development professionals to enhance the efficiency of their natural product discovery pipelines.
In natural product research, a significant bottleneck is the continual re-discovery of known compounds. Dereplication—the process of rapidly identifying known molecules in a crude extract—is therefore crucial for prioritizing resources toward the discovery of truly novel bioactive entities [38] [39]. This is particularly relevant in LC-HRMS-based metabolomics, where a single analysis can generate thousands of MS/MS spectra from complex biological samples like plant extracts [40] [4].
Orchidaceae species represent a rich source of specialized metabolites, including stilbenoids and flavonoids, with documented antifungal properties [4]. The integration of robust dereplication strategies is indispensable for efficiently mapping their chemical diversity and identifying lead compounds. This note outlines a practical dereplication workflow, combining the power of public spectral libraries with the predictive capability of in silico fragmentation tools, specifically contextualized for Orchidaceae LC-HRMS antifungal screening research.
Foundational Concepts and Tools
Spectral Library Matching
Spectral library matching is a cornerstone of dereplication, involving the comparison of an experimental MS/MS spectrum against a curated database of reference spectra. A high similarity score suggests a confident, tentative annotation [40].
- Key Databases: Popular libraries include MassBank, MassBank of North America (MoNA), NIST, and the extensive spectral libraries within the GNPS platform [40] [39].
- Similarity Metrics: The cosine score is a widely used metric for spectral comparison [40]. Recent advancements include alternative metrics like spectral entropy and MS2DeepScore, a deep learning-based approach that predicts structural similarity from MS/MS spectra [40].
In Silico Fragmentation Tools
For compounds absent from experimental libraries, in silico tools predict fragmentation spectra from candidate structures, bridging the annotation gap [40] [41].
- Mechanisms: These tools use various strategies, including combinatorial fragmentation (e.g., MetFrag), competitive fragmentation modeling (e.g., CFM-ID), and rule-based approaches [40] [41].
- Performance: A critical comparison demonstrated that while standalone tools have varying success rates, their strategic combination can achieve high identification accuracy [41].
Table 1: Comparison of Key In Silico Fragmentation Tools
| Tool | Algorithm Type | Key Features | Typical Use Case in Dereplication |
|---|---|---|---|
| MetFrag [40] [41] | Combinatorial Fragmentation | Bond dissociation approach; can integrate various metadata (e.g., bond dissociation energy) in scoring. | Retrieving candidate structures from large chemical databases (e.g., PubChem) based on precursor m/z. |
| CFM-ID [40] [41] | Competitive Fragmentation Modeling | Uses a machine learning-trained generative model to predict spectra at multiple energy levels. | Predicting full MS/MS spectra for a given candidate structure; can be used for both spectral matching and candidate ranking. |
| MAGMa+ [41] | Fragment Annotation/Scoring | Analyses substructures and assigns scores based on bond disconnection penalties; optimized for MS/MS annotation. | Automated annotation of MS/MS data in untargeted metabolomics; particularly effective for molecular families. |
| MS-FINDER [41] | Rule-Based & Hydrogen Rearrangement | Considers alpha-cleavage, bond dissociation energies, and hydrogen rearrangement rules. Integrates database existence in scoring. | Structure elucidation for unknowns, offering comprehensive analysis including formula prediction and structure ranking. |
| DEREPLICATOR+ [38] | Hybrid (Peptide-focused, extended) | Originally for peptidic natural products (PNPs), now extends to polyketides, terpenes, benzenoids, etc. Uses a detailed fragmentation model and molecular networking. | High-throughput identification of known natural products and their variants directly within the GNPS analysis pipeline. |
Integrated Dereplication Workflow
A synergistic approach, combining multiple tools and data types, significantly enhances annotation confidence and coverage. The following workflow diagram illustrates the integrated strategy for analyzing LC-HRMS data from Orchidaceae samples.
Experimental Protocol: Dereplication of Orchidaceae Extracts
This protocol is adapted from successful applications in profiling antifungal metabolites from Vanda and Cattleya genera [4] [29].
Sample Preparation and LC-HRMS/MS Analysis
- Extraction: Homogenize 50 mg of lyophilized Orchidaceae root/leaf powder. Extract using a solvent mixture of methanol/water/formic acid (49:49:2, v/v/v) via sonication for 60 minutes. Centrifuge, combine supernatants, and dry under a gentle nitrogen stream. Reconstitute the dried extract in H₂O/ACN (95:5, v/v) to a final concentration of 10 mg/mL, and filter through a 0.22 µm membrane [4] [42].
- LC Conditions:
- Column: Reversed-phase C18 (e.g., 2.1 x 150 mm, 1.8 µm).
- Mobile Phase: A) 8 mM ammonium acetate in water; B) Acetonitrile.
- Gradient: 3-5% B (0-3 min), 5-15% B (5-8 min), 15-60% B (8-12 min), 60-98% B (12-20 min), hold at 98% B (20-21 min).
- Flow Rate: 0.3 mL/min; Column Temperature: 40°C; Injection Volume: 2 µL [42].
- HRMS/MS Conditions (Q-TOF or Orbitrap):
- Ionization: ESI positive mode.
- Source Parameters: Ionization voltage: +5.5 kV; Source temperature: 550°C; Nebulizing and auxiliary gas: 55 psi.
- Data Acquisition: Employ both Data-Dependent Acquisition (DDA) and Data-Independent Acquisition (DIA/SWATH) for comprehensive coverage.
- DDA: Acquire full MS scan (m/z 100-2000), then fragment the top 4 most intense ions per cycle.
- DIA/SWATH: Isolate sequential 50 Da windows across m/z 100-1000 for fragmentation [42].
Data Processing and Dereplication
- Data Conversion: Convert raw data files to an open format (e.g., .mzML) using tools like MSConvert (ProteoWizard) [42].
- Spectral Library Matching:
- Upload the converted DDA files directly to the GNPS platform.
- Perform a spectral library search against public libraries (GNPS, NIST, etc.). Set a cosine score threshold of >0.7 for relatedness and >0.8 for confident annotations. Annotate spectra with high similarity scores (e.g., cosine >0.9, mass error <5 ppm) [4].
- Molecular Networking:
- On the GNPS website, create a molecular network from your DDA data using the Molecular Networking job. The same dataset from Step 2.2 can be used.
- Use the network to visualize chemical families and propagate annotations from known nodes to structurally similar, unknown nodes (Network Annotation Propagation) [4].
- In Silico Annotation:
- For features lacking a library match, use in silico tools.
- Export the peak list (m/z, retention time) and MS/MS spectra for unannotated features.
- Input this data into tools like MetFrag or CFM-ID, querying databases such as PubChem or AntiMarin within a narrow mass tolerance (e.g., 5 ppm) to generate and rank candidate structures [40] [41].
- Data Integration and Validation:
- Cross-reference all annotations from library matching, molecular networking, and in silico predictions.
- Use extracted ion chromatograms (EICs) to resolve isomeric compounds based on retention time [42].
- Where possible, confirm identities by comparing with authentic standards analyzed under identical LC-MS conditions [4].
The Scientist's Toolkit: Essential Research Reagents and Software
Table 2: Key Resources for LC-HRMS-based Dereplication
| Category | Item/Software | Specific Function in Protocol | Key Reference/Source |
|---|---|---|---|
| Spectral Libraries | GNPS Libraries | Primary repository for experimental MS/MS spectra for library matching. | [40] [4] |
| MassBank / MoNA | Public, curated repositories of mass spectral data. | [40] | |
| In Silico Tools | MetFrag | Retrieves candidate structures from chemical databases and scores them via in silico fragmentation. | [40] [41] |
| CFM-ID | Predicts MS/MS spectra for candidate structures using a machine learning model. | [40] [41] | |
| DEREPLICATOR+ | Dereplicates peptides and diverse classes of natural products directly within GNPS. | [38] | |
| Data Analysis Platforms | GNPS Platform | Web-based ecosystem for molecular networking, library search, and community data analysis. | [4] [42] |
| MS-DIAL | Software for processing DIA data (e.g., SWATH) to extract pseudo-MS/MS spectra. | [42] | |
| MZmine | Flexible, open-source platform for processing LC-MS data for metabolomics. | [42] | |
| matchms | Open-source Python package for MS/MS data processing, cleaning, and comparison. | [43] | |
| Chemical Databases | PubChem / AntiMarin | Large structural databases used as candidate sources for in silico tools. | [38] [41] |
Application in Orchidaceae Antifungal Research
The practical application of this dereplication strategy is exemplified by its use in studying the metabolic dynamic between healthy and fungal-infected Orchidaceae plants [4]. In one study, this approach enabled the annotation of 53 metabolites, including flavonoids, stilbenoids (e.g., orchinol, hircinol), phenolic acids, and terpenoids [4]. The workflow allowed researchers to:
- Rapidly annotate the majority of detectable metabolites, focusing efforts on unknowns.
- Identify metabolic shifts by comparing the relative abundance of specific compound classes (e.g., stilbenoids) between healthy and infected plants.
- Prioritize lead compounds for antifungal testing, such as a tricin-derived flavonoid and the terpenoid loliolide, which were exclusively detected in healthy plants, suggesting a potential defensive role [4] [29].
The integration of spectral library matching and in silico fragmentation tools into a cohesive dereplication pipeline is no longer optional but essential for efficient natural products research. The protocol detailed herein, contextualized within Orchidaceae antifungal screening, provides a robust, scalable, and high-throughput method for identifying known compounds and prioritizing novel chemical entities. By leveraging open-source platforms like GNPS and continuously improving in silico predictions, researchers can significantly accelerate the discovery of new antifungal leads from the vast and underexplored chemical space of the Orchidaceae family.
- Mohimani et al. Dereplication of microbial metabolites through database search of mass spectra. Nat Commun 9, 4035 (2018). [38]
- A. Critical review on in silico methods for structural annotation of ... Anal Bioanal Chem 417, 473–493 (2024). [40]
- Lima et al. LC-HRMS/MS-Based Metabolomics Approaches Applied to the Detection of Antifungal Compounds and a Metabolic Dynamic Assessment of Orchidaceae. Molecules 27, 7937 (2022). [4]
- Gurevich et al. Dereplication of peptidic natural products through database search of mass spectra. Nat Chem Biol 13, 30–37 (2017). [39]
- A. Comprehensive comparison of in silico MS/MS fragmentation tools of the CASMI contest. J Cheminform 9, 32 (2017). [41]
- A dereplication strategy was developed for the screening of secondary metabolites from Sophora flavescens. Sci Rep 15, 10148 (2025). [42]
- Reproducible MS/MS library cleaning pipeline in matchms. J Cheminform 16, 88 (2024). [43]
Within the broader scope of a thesis on Orchidaceae metabolomics for antifungal screening, this case study exemplifies the application of Liquid Chromatography-High Resolution Tandem Mass Spectrometry (LC-HRMS/MS) in plant defense mechanism research. The study investigates the metabolic reprogramming in Vanda and Cattleya genera (Orchidaceae) when challenged by fungal infection, with the aim of identifying discriminant metabolites with potential antifungal properties [44] [4]. The LC-HRMS-based metabolomics approach serves as a powerful technology for discovering novel biologically active molecules and understanding biochemical responses to microbial attacks [4] [1]. This research aligns with the critical need for efficient methodologies to screen new antimicrobial agents from natural products [4].
Experimental Design and Workflow
Sample Collection and Preparation
The study analyzed twenty ethanolic plant extracts from ten species of the Orchidaceae family, belonging to the genera Vanda (five samples) and Cattleya (five samples) [4] [1]. Samples were categorized into two distinct groups for comparative analysis:
- Healthy Plants: Specimens with no signs of fungal infection.
- Fungal-Infected Plants: Specimens showing visible symptoms of microbial attack.
Lyophilized extracts from both groups were prepared and submitted for metabolite analysis [4]. This careful sample selection enabled a direct investigation of the metabolic dynamics and biochemical responses induced by fungal infection.
LC-HRMS/MS Analysis
Metabolomic profiling was performed using ultrahigh-resolution mass spectrometry coupled with liquid chromatography (Orbitrap LC-MS) [4] [1]. The analytical procedure included:
- Separation Technique: Liquid chromatography for reducing sample complexity prior to MS analysis.
- Ionization Mode: Positive ionization mode (ESI(+)) for mass spectrometry detection.
- Data Acquisition: MS/MS data collection for structural characterization of metabolites.
This platform provided high selectivity, sensitivity, and the ability to detect a wide range of analytes with different physicochemical properties, which is essential for comprehensive metabolomic coverage [4].
Data Processing and Metabolite Annotation
Raw data processing and metabolite annotation followed a structured bioinformatics workflow [33]:
- Peak Detection and Integration: Using specialized software for quantitative analysis of compounds.
- Data Normalization: To reduce systematic bias or technical variation.
- Compound Identification: Comparing experimental data against spectral libraries.
The structural annotation of metabolites was based on:
- Accurate mass (m/z) measurements
- MS/MS fragmentation patterns
- Chromatographic retention times
- Chemotaxonomic data from the Orchidaceae family [4]
Annotation confidence was classified according to the Metabolomics Standards Initiative (MSI), with most identifications achieving level 2 (presumptively annotated compounds) [33] [4].
Diagram 1: Experimental workflow for Orchidaceae metabolomics.
Key Methodologies and Tools
Molecular Networking and Dereplication Strategies
Advanced data analysis tools were employed for comprehensive metabolic profiling and annotation:
- Classical Molecular Networking (MN): Performed on the GNPS platform with a cosine score similarity threshold set to 0.7 to group structurally related metabolites [4] [1].
- Dereplication Tools: Multiple state-of-the-art algorithms were applied:
- Dereplicator+ for rapid identification of known metabolites
- Network Annotation Propagation (NAP) for extending annotations across molecular families
- Moldiscovery for compound discovery
- MS2LDA and MolNetEnhancer for enhanced metabolic network analysis [4]
- Feature-Based Molecular Networking (FBMN): Used for ion abundance assessment across sample groups [4].
This multi-pronged approach enabled efficient discrimination of ions that differentiate healthy and fungal-infected plant samples, facilitating the discovery of potential antifungal compounds [44].
Statistical and Chemometric Analysis
Chemometric methods were applied to process the complex metabolomics data and identify statistically significant differences between sample groups. The analysis focused on:
- Discriminating ions with significant abundance changes between healthy and infected samples
- Evaluating metabolic dynamics through synthesis patterns of specific compound classes
- Identifying promising antifungal metabolites based on their exclusive presence or significant abundance changes [44] [4]
Results and Metabolic Findings
Comprehensive Metabolite Profiling
The LC-HRMS/MS-based untargeted metabolomics approach revealed considerable variation in secondary metabolites, with fifty-three metabolites rapidly annotated through spectral library matching and in silico fragmentation tools [44] [4]. The metabolomic profiling showed a large production of polyphenols, including flavonoids, phenolic acids, chromones, stilbenoids, and tannins, which varied in relative abundance across species [44].
Table 1: Annotated Metabolite Classes in Vanda and Cattleya Genera
| Metabolite Class | Number of Compounds | Subclasses and Examples |
|---|---|---|
| Flavonoids | 35 | Flavones (22), Flavonols (7), Flavanones (1), Isoflavones (5) |
| Stilbenoids | 10 | Including orchinol and hircinol derivatives |
| Phenolic Acids | 10 | 50% cinnamic acids derivatives |
| Terpenoids | 20 | Diterpenoids (9), Monoterpenoids (2), Sesquiterpenoids (7), Triterpenoids (2) |
| Alkaloids | 8 | Tryptophan (1), Anthranilic acid (3), Nicotinic acid (3), Histidine (1) |
| Other Aromatics | 8 | Coumarins (5), Anthraquinones (1), Xanthones (1), Chromones (1) |
The library matches using classical molecular networking from Cattleya and Vanda genera assessment in both physiological conditions yielded a total of 1,220 hits with 315 unique library compounds [4]. Sixty hits demonstrated high confidence levels, represented by spectral similarity greater than 90% (cosine score > 0.9), mass error less than 5 ppm, and a high number of shared peaks in the MS/MS spectrum [4].
Discriminant Metabolites Between Healthy and Fungal-Infected Plants
The comparative analysis between healthy and fungal-infected plants revealed significant differences in metabolite abundance and presence:
Table 2: Key Discriminant Metabolites with Antifungal Potential
| Metabolite Name | Chemical Class | Presence in Healthy Plants | Presence in Infected Plants | Proposed Biological Role |
|---|---|---|---|---|
| Tricin derivative flavonoid | Flavonoid | Exclusive | Absent | Promising antifungal metabolite [44] |
| Loliolide terpenoid | Terpenoid | Exclusive | Absent | Promising antifungal metabolite [44] |
| Stilbenoids (e.g., orchinol, hircinol) | Stilbenoid | Lower abundance | Significantly increased | Phytoalexins, defense response [4] [1] |
| O-glycosylated flavonoids | Flavonoid | Varied patterns | Varied patterns | Biochemical response to microbial attack [44] |
The metabolic dynamic assessment revealed increased synthesis of stilbenoids in fungal-infected plants [44]. Stilbenoids, including orchinol and hircinol, function as phytoalexins responsible for protection against predation and demonstrating antimicrobial activities [4] [1]. These compounds were first isolated from the Orchis and Loroglossum genera and were previously reported with antifungal activity, playing a role in the defense of orchid tubes [4].
Diagram 2: Metabolic dynamics in fungal-infected orchids.
The Scientist's Toolkit: Essential Research Reagents and Materials
Successful implementation of this LC-HRMS/MS-based metabolomics workflow requires specific reagents, instruments, and software tools:
Table 3: Essential Research Reagents and Solutions for Orchidaceae Metabolomics
| Item | Specification/Example | Function/Purpose |
|---|---|---|
| Solvents for Extraction | Ethanol (for plant extracts) [4] | Extraction of medium-polarity metabolites including polyphenols |
| Chromatography Columns | Reverse-phase LC columns | Separation of complex metabolite mixtures prior to MS analysis |
| Mass Spectrometry System | Orbitrap LC-MS with ESI source [4] | High-resolution mass analysis for accurate metabolite identification |
| Quality Control Materials | QC samples [33] | Monitoring analytical performance and signal correction |
| Data Processing Software | XCMS, MZmine3, MAVEN [33] | Peak detection, alignment, and quantitative analysis |
| Molecular Networking Platform | GNPS (Global Natural Products Social) [4] | Spectral similarity networking and metabolite annotation |
| In Silico Tools | Dereplicator+, NAP, MS2LDA [4] | Fragmentation prediction and compound identification |
| Reference Standards | Authentic chemical standards [33] | Verification of metabolite identifications |
Detailed Experimental Protocols
Sample Preparation Protocol
For reproducible metabolite extraction from Orchidaceae plant material:
- Plant Material Processing:
- Collect healthy and fungal-infected plant samples
- Lyophilize tissues to preserve labile metabolites
- Grind to a fine powder using liquid nitrogen
- Metabolite Extraction:
- Weigh 100 mg of lyophilized powder per sample
- Add 1 mL of ethanol (or other appropriate solvent)
- Sonicate for 15 minutes at room temperature
- Centrifuge at 14,000 × g for 10 minutes
- Collect supernatant and evaporate under nitrogen stream
- Reconstitute in appropriate LC mobile phase for analysis [4] [45]
LC-HRMS/MS Data Acquisition Parameters
For comprehensive metabolomic coverage using Orbitrap technology:
- Chromatographic Conditions:
- Column: C18 reverse-phase column (e.g., 2.1 × 100 mm, 1.8 μm)
- Mobile Phase: Water (A) and acetonitrile (B), both with 0.1% formic acid
- Gradient: 5-95% B over 25-30 minutes
- Flow Rate: 0.3 mL/min
- Column Temperature: 40°C
- Injection Volume: 5 μL
- Mass Spectrometry Parameters:
Data Analysis Workflow Protocol
For processing raw LC-HRMS/MS data to biological insights:
- Raw Data Preprocessing:
- Convert raw files to open formats (e.g., mzML)
- Perform peak detection, alignment, and integration using XCMS or MZmine3
- Generate feature table with m/z, retention time, and intensity values
Multivariate Statistical Analysis:
- Apply quality control filters (remove features with >30% RSD in QC samples)
- Perform data normalization (e.g., probabilistic quotient normalization)
- Conduct principal component analysis (PCA) to assess data quality
- Use partial least squares-discriminant analysis (PLS-DA) to identify discriminant features
Metabolite Annotation:
This case study demonstrates that LC-HRMS/MS-based metabolomics, combined with chemometric methods and dereplication tools, provides a rapid and reliable technique for fingerprinting medicinal plants and discovering new bioactive compounds [44]. The approach successfully identified discriminant metabolites between healthy and fungal-infected Orchidaceae plants, revealing significant metabolic reprogramming in response to microbial attack.
The tricin derivative flavonoid and the loliolide terpenoid, found exclusively in healthy plant samples, represent promising antifungal metabolites worthy of further investigation [44]. The enhanced production of stilbenoids in infected plants confirms their role as phytoalexins in the Orchidaceae defense system [4] [1]. These findings contribute valuable insights to the broader thesis on Orchidaceae metabolomics and LC-HRMS antifungal screening research, highlighting the potential of metabolomics-driven approaches for natural product discovery and plant defense mechanism studies.
Navigating Analytical Challenges in Orchid Metabolomics
Overcoming Matrix Effects and Ion Suppression in Complex Plant Extracts
Liquid Chromatography coupled to High-Resolution Mass Spectrometry (LC-HRMS) has become the technique of choice in plant metabolomics due to its high selectivity, sensitivity, and ability to detect a wide range of analytes [4] [1]. However, the analysis of complex plant extracts, such as those from Orchidaceae species, is significantly challenged by matrix effects and ion suppression. These phenomena can dramatically decrease measurement accuracy, precision, and sensitivity, potentially obscuring crucial antifungal compounds [47]. This application note outlines practical strategies and detailed protocols to overcome these challenges, specifically within the context of Orchidaceae metabolomics research for antifungal screening.
Understanding the Challenge: Matrix Effects in Plant Metabolomics
Ion suppression occurs when co-eluting compounds interfere with the ionization efficiency of target analytes, leading to reduced signal intensity and inaccurate quantification [47]. In plant metabolomics, this is particularly problematic because:
- Complex Matrices: Plant extracts contain a diverse range of primary and secondary metabolites (e.g., flavonoids, alkaloids, terpenoids) at varying concentrations, which can co-elute and suppress each other's ionization [4] [25].
- Concentration Variability: Metabolites of interest may be present at low abundance alongside highly abundant compounds, making them susceptible to severe suppression [47].
- Impact on Discovery: In antifungal screening of Orchidaceae, key bioactive compounds like stilbenoids, flavonoids, and terpenoids can be suppressed, leading to false negatives or inaccurate abundance measurements [4] [44].
Recent research demonstrates that ion suppression can affect up to 100% of detected metabolites in certain chromatographic systems, with signal reduction ranging from 1% to over 90% [47]. The following workflow summarizes the primary causes and consequences of ion suppression in the context of plant-based antifungal discovery.
Strategic Solutions and Research Reagent Toolkit
Addressing ion suppression requires a multi-faceted approach, combining sample preparation, chromatographic separation, and advanced data acquisition techniques. The table below outlines key reagents and materials essential for implementing these strategies in Orchidaceae metabolomics.
Table 1: Research Reagent Solutions for Mitigating Matrix Effects
| Reagent/Material | Function & Application in Orchidaceae Metabolomics |
|---|---|
| Stable Isotope-Labeled Internal Standards (IROA-IS) | Corrects for variable ionization efficiency and ion suppression across all detected metabolites; enables accurate quantification [47]. |
| Acetonitrile (LC/MS Grade) | Primary extraction solvent; effective for precipitating proteins and extracting a wide range of secondary metabolites [48]. |
| Formic Acid (LC/MS Grade) | Mobile phase additive; improves chromatographic peak shape and enhances ionization in positive ESI mode [48]. |
| Solid Phase Extraction (SPE) Cartridges | Sample clean-up to remove interfering salts and phospholipids; particularly useful for crude plant extracts [49]. |
| IROA Long-Term Reference Standard (IROA-LTRS) | A 1:1 mixture of IROA-IS standards used to model and correct for ion suppression in every sample [47]. |
| Ba/Ag/H Cartridges | Specific removal of chloride and sulfate ions that cause severe suppression for polar analytes [49]. |
Detailed Experimental Protocols
Protocol 1: Sample Preparation and Clean-up for Orchidaceae Extracts
This protocol is optimized for the extraction of antifungal compounds (e.g., stilbenoids, flavonoids) from orchid tissues while minimizing matrix components.
- Homogenization: Freeze-dry plant material (e.g., leaves, pseudobulbs, tubers) and grind to a fine powder using a cryogenic mill [48] [25].
- Extraction: Weigh 50 ± 1 mg of lyophilized powder. Add 1 mL of acidified acetonitrile/water (ACN/H₂O, 80:20 v/v with 0.1% formic acid) [48]. Sonicate for 15 minutes in an ice bath.
- Clean-up: Pass the extract through a Ba/Ag/H cartridge to precipitate inorganic anions [49]. Alternatively, for a broader clean-up, use a C18 SPE cartridge conditioned with methanol and water. Elute metabolites with 2 mL of methanol.
- Concentration: Evaporate the eluent to dryness under a gentle nitrogen stream. Reconstitute the residue in 100 µL of initial mobile phase for LC-HRMS analysis.
- Internal Standard Addition: Spike the reconstituted sample with the IROA-IS or IROA-LTRS mixture prior to injection to correct for suppression occurring during the ionization process [47].
Protocol 2: LC-HRMS Analysis with Ion Suppression Monitoring
This method details the LC-HRMS parameters for profiling Orchidaceae extracts and simultaneously quantifying ion suppression.
Chromatographic Conditions:
- Column: Reversed-Phase C18 (e.g., 100 x 2.1 mm, 1.7 µm)
- Mobile Phase A: Water with 0.1% formic acid
- Mobile Phase B: Acetonitrile with 0.1% formic acid
- Gradient: 5% B to 95% B over 25 minutes, hold for 5 minutes [4] [50]
- Flow Rate: 0.3 mL/min
- Injection Volume: 5 µL
Mass Spectrometric Conditions:
- Ionization: ESI positive and negative modes
- Mass Analyzer: Orbitrap-based HRMS
- Resolution: >60,000 FWHM
- Scan Range: m/z 100–1500
- Data Acquisition: Data-Dependent Acquisition (DDA) or Data-Independent Acquisition (DIA) for untargeted profiling [4] [25]
Ion Suppression Calculation:
The IROA TruQuant workflow uses the following equation to correct for ion suppression for each metabolite [47]:
AUC-12Ccorrected = AUC-12Cobserved × (AUC-13Cexpected / AUC-13Cobserved)
Where:
AUC-12Cobserved: Measured peak area of the endogenous metabolite (^12^C channel)AUC-13Cobserved: Measured peak area of the internal standard (^13^C channel)AUC-13Cexpected: The known, constant value of the internal standard
Protocol 3: Data Processing and Molecular Networking for Antifungal Discovery
- Pre-processing: Convert raw files to open formats (e.g., .mzML). Use software like MZmine or XCMS for peak picking, alignment, and gap filling.
- Ion Suppression Correction: Process the data with ClusterFinder software or a custom script to apply the IROA-based correction formula to all metabolite peaks [47].
- Molecular Networking: Upload the processed MS/MS data to the GNPS platform . Create a Feature-Based Molecular Networking (FBMN) job with a cosine score threshold of 0.7 to cluster structurally related metabolites and annotate known antifungal compounds (e.g., stilbenoids like orchinol) [4] [1].
- Dereplication: Use GNPS tools (Dereplicator+, NAP) to compare MS/MS spectra against natural product libraries and rapidly annotate compounds, reducing rediscovery of known metabolites [4].
The integration of these protocols into a cohesive workflow, from sample preparation to data interpretation, ensures robust results in antifungal screening.
Application in Orchidaceae Antifungal Screening: Key Findings
Implementing these protocols in the study of Orchidaceae species has yielded critical insights. Research comparing healthy and fungal-infected plants of genera like Vanda and Cattleya successfully annotated 53 metabolites, identifying specific flavonoids and terpenoids with promising antifungal activity [4] [44]. The following table summarizes quantitative data that highlight the importance of robust methods.
Table 2: Annotated Antifungal Compounds in Orchidaceae via LC-HRMS/MS
| Chemical Class | Number of Annotated Metabolites | Example Compounds | Key Finding in Antifungal Context |
|---|---|---|---|
| Flavonoids | 35 | Tricin derivatives, C-diglycosylated chrysins | A tricin derivative was found only in healthy plants, indicating a promising antifungal lead [4] [25]. |
| Stilbenoids | 10 | Orchinol, Hircinol | Synthesis is promoted in fungal-infected plants; known phytoalexins with documented antifungal activity [4] [51]. |
| Terpenoids | 20 | Loliolide, Diterpenoids | Loliolide was identified as a potential antifungal metabolite in healthy plant samples [4]. |
| Phenolic Acids | 10 | Cinnamic acid derivatives | Vary in abundance and are associated with biochemical responses to microbial attack [4] [1]. |
| Alkaloids | 8 | Calystegine B2 | Accumulation of Calystegine B2 was promoted in orchid tubers during interaction with fungi, contributing to defense [51]. |
Matrix effects and ion suppression are significant but surmountable obstacles in LC-HRMS-based metabolomics. By adopting a comprehensive strategy that includes rigorous sample clean-up, the use of stable isotope-labeled internal standards like the IROA system, and advanced data processing workflows, researchers can achieve highly accurate and sensitive profiling of complex plant extracts. In the context of Orchidaceae research, these methods are indispensable for reliably uncovering novel antifungal compounds and understanding plant-pathogen interactions, thereby accelerating natural product drug discovery.
Optimizing Chromatography for Separation of Isomeric Polyphenols
In the field of Orchidaceae metabolomics research focused on antifungal screening, the comprehensive profiling of polyphenolic compounds is essential for identifying novel bioactive leads [4]. A significant analytical challenge in this endeavor is the effective separation of isomeric polyphenols—molecules sharing identical molecular formulas but distinct atomic arrangements—which can exhibit vastly different biological activities [52]. The complexity of plant extracts, particularly from orchids which produce a vast array of secondary metabolites including flavonoids, stilbenoids, and phenolic acids, demands highly resolving chromatographic techniques [4] [25]. This application note details optimized chromatographic strategies, leveraging Liquid Chromatography coupled to High-Resolution Mass Spectrometry (LC-HRMS), to achieve the high-resolution separation necessary for accurate identification and characterization of these critical isomers within a non-targeted metabolomics workflow.
Current Analytical Challenges in Orchidaceae Metabolomics
The detection of antifungal compounds from Orchidaceae species via LC-HRMS-based metabolomics involves analyzing complex mixtures where isomeric polyphenols are prevalent [4]. For instance, molecular networking of Cattleya and Vanda genera annotated numerous isomeric flavonoids and stilbenoids [4]. A specific study on Oncidium sotoanum identified chrysin C-glycosides, where structural isomers exhibited nearly identical MS/MS fragmentation patterns, making their distinction solely by mass spectrometry problematic [25]. Failure to chromatographically resolve such isomers can lead to misannotation and an incomplete understanding of structure-activity relationships, ultimately hindering the discovery of true bioactive hits.
A primary challenge in non-targeted analysis is the inherent uncertainty in structural assignment when relying on in-silico predictions. As demonstrated in a systematic study, predictions for retention time and collision cross-section (CCS) values often lack the precision to reliably distinguish between isomeric candidate structures, with current models having confidence intervals that are too wide for definitive identification [52]. This underscores the indispensable role of optimized experimental chromatography in providing the orthogonal data needed for confident structural annotation.
Chromatographic Method Optimization for Isomer Separation
Liquid Chromatography (LC) Conditions
Reversed-phase liquid chromatography (RPLC) on C18 stationary phases is the cornerstone for polyphenol separation. Optimal resolution of isomers is achieved by carefully controlling mobile phase composition and gradient conditions.
Table 1: Optimized UPLC-UV Conditions for Polyphenol Separation from Dendrobium Orchids [53]
| Parameter | Specification |
|---|---|
| Column | ACQUITY UPLC BEH C18 (2.1 × 50 mm, 1.7 µm) |
| Mobile Phase A | Water + 1% Trifluoroacetic Acid (TFA) |
| Mobile Phase B | Acetonitrile + 1% TFA |
| Gradient | Linear gradient (specific profile optimized for target analytes) |
| Flow Rate | 0.2 mL/min |
| Column Temperature | Controlled (typically 25-40°C) |
| Detection | UV at 280 nm |
| Injection Volume | Optimized for sensitivity and resolution |
The use of acidic additives like trifluoroacetic acid (TFA) is critical, as it suppresses silanol activity on the stationary phase, improving peak shape and reducing tailing for phenolic compounds [53]. The low particle size (1.7 µm) of the column provides high efficiency, which is essential for resolving subtle differences in isomeric structures.
For a broader metabolomic coverage, especially encompassing very polar polyphenols not well-retained on standard RPLC, a two-pronged approach is recommended:
- Reversed-Phase LC (RPLC) on a C18 column with ESI+ detection.
- Hydrophilic Interaction Chromatography (HILIC) on a zwitterionic column with ESI- detection [54]. This combination significantly expands the range of metabolites detected in a single sample, capturing both hydrophobic and hydrophilic isomers.
Supercritical Fluid Chromatography (SFC) as an Emerging Alternative
Supercritical Fluid Chromatography (SFC), which uses supercritical CO₂ as the primary mobile phase, presents a complementary green alternative to LC [55]. SFC offers different selectivity and is particularly well-suited for separating very polar compounds and performing chiral separations, which can be challenging for RPLC. The technique is highly compatible with MS detection. While currently less utilized for complex polyphenol mixtures, SFC holds significant potential for resolving specific isomeric pairs where LC reaches its limitations. Successful implementation requires careful optimization of co-solvents (e.g., methanol) and additives in the mobile phase [55].
Ion Mobility Spectrometry (IMS) as an Orthogonal Technique
The integration of Ion Mobility Spectrometry (IMS) between the LC and HRMS steps adds a powerful orthogonal separation dimension. IMS separates ions in the gas phase based on their collision cross-section (CCS)—a measure of their size and shape—which is a unique physicochemical property [52]. Isomers with different three-dimensional structures will often have distinct CCS values, providing an additional identifier for confirmation. However, a recent study cautions that the resolving power of IMS alone may not always be sufficient to distinguish all isomeric candidate structures, and its greatest utility is realized when combined with high-resolution chromatographic separation [52].
The following workflow diagram illustrates the integration of these techniques for definitive isomer identification:
Experimental Protocols
Sample Preparation for Orchid Tissues
A robust and reproducible sample preparation protocol is fundamental for reliable LC-HRMS analysis.
- Homogenization: Fresh orchid plant material (leaves, pseudobulbs, roots) is rapidly frozen in liquid nitrogen and lyophilized. The dried tissue is ground into a fine, homogeneous powder using a ball mill [25] [56].
- Extraction: A measured quantity (e.g., 50 mg) of the powdered tissue is mixed with an appropriate extraction solvent. Methanol, or mixtures of methanol/water, are commonly used for polyphenols due to their high efficiency and compatibility with LC-MS [25] [56]. The mixture is vortexed vigorously (5 min) and then sonicated (30 min at 40°C) to enhance extraction yield [56].
- Clean-up: The homogenate is centrifuged (e.g., 13,000 rpm for 5-15 min) to pellet insoluble debris [56]. The supernatant (crude extract) is carefully collected and may be filtered through a 0.22 µm membrane filter prior to LC-MS analysis to protect the chromatographic system.
LC-HRMS/MS Analysis for Non-Targeted Screening
This protocol is designed for the detection and characterization of isomeric polyphenols, including unknown compounds, in orchid extracts.
- Chromatographic System: Utilize a UHPLC system capable of delivering precise, high-pressure gradients.
- Column Selection: Employ two complementary columns:
- Core-shell C18 column (e.g., 150 mm x 2.1 mm, 1.7 µm) for RPLC separation.
- Zwitterionic HILIC column (e.g., 150 mm x 2.1 mm, 1.8 µm) for polar metabolites.
- Mobile Phase:
- For RPLC: Use (A) 0.1% Formic Acid in Water and (B) 0.1% Formic Acid in Acetonitrile [52].
- For HILIC: Use (A) Water with buffer/additive and (B) Acetonitrile.
- Apply a linear gradient from 5% B to 95-100% B over 15-20 minutes, followed by re-equilibration.
- Mass Spectrometry:
- Instrument: High-resolution mass spectrometer (e.g., Q-TOF, Orbitrap).
- Ionization: Use both ESI+ and ESI- modes in separate runs to maximize metabolite coverage.
- Data Acquisition: Employ data-dependent acquisition (DDA or FAST-DDA [25]). A full MS1 scan (e.g., m/z 100-1500) is followed by MS/MS fragmentation of the most intense ions.
Structural Annotation and Data Analysis
- Preprocessing: Convert raw data files and perform peak picking, alignment, and deconvolution using software like XCMS, MZmine, or commercial platforms.
- Dereplication: Use computational tools to cross-reference acquired MS/MS spectra against public spectral libraries (e.g., GNPS) [4] [25]. This step rapidly identifies known compounds and flags novel or isomeric features for further investigation.
- Isomer Differentiation: For isomeric candidate structures, leverage all available orthogonal data:
- Compare chromatographic retention times against authentic standards if available [52].
- Utilize experimental CCS values from IMS and compare against databases or predicted values [52].
- Carefully interpret MS/MS fragmentation patterns. Even subtle differences can indicate isomeric structures, as seen with C-glycosylated chrysin derivatives [25].
Table 2: Key Parameters for Differentiating Isomeric Polyphenols in LC-HRMS [52]
| Parameter | Role in Isomer Differentiation | Current Practical Limitations |
|---|---|---|
| LC Retention Time | Primary separator; reflects hydrophobicity/ polarity. | Requires standards for absolute confirmation; prediction error ~1.5 min. |
| IMS Collision Cross-Section (CCS) | Orthogonal separator; reflects molecular size & shape. | Prediction error >2%; may not resolve all isomers. |
| MS/MS Fragmentation | Provides structural clues based on bond cleavage. | Isomers can have nearly identical spectra; requires expert interpretation. |
The Scientist's Toolkit: Essential Research Reagents & Materials
Table 3: Key Reagents and Materials for LC-HRMS Metabolomics of Orchid Polyphenols
| Item | Function / Application | Example / Specification |
|---|---|---|
| UHPLC System | High-pressure, high-resolution chromatographic separation. | Systems from Waters, Agilent, Thermo, etc. |
| C18 LC Column | Reversed-phase separation of medium to non-polar metabolites. | ACQUITY UPLC BEH C18, 1.7 µm [53] |
| HILIC Column | Separation of polar and hydrophilic metabolites. | Zwitterionic stationary phase (e.g., SeQuant ZIC-HILIC) [54] |
| High-Resolution Mass Spectrometer | Accurate mass measurement and structural elucidation. | Orbitrap, Q-TOF instruments |
| Formic Acid / TFA | Mobile phase additive to improve ionization and peak shape. | LC-MS Grade, 0.1% v/v [53] [52] |
| Methanol & Acetonitrile | Extraction solvents and mobile phase components. | LC-MS Grade [56] |
| Solid Phase Extraction (SPE) | Sample clean-up and pre-concentration of metabolites. | C18 or polymer-based cartridges |
| Spectral Libraries & Software | Dereplication, metabolite annotation, and data analysis. | GNPS, Dereplicator+, MS-DIAL [4] |
The successful separation and identification of isomeric polyphenols in Orchidaceae extracts for antifungal discovery is a multi-faceted challenge. No single technique provides a universal solution. Instead, a synergistic approach is required, combining optimized chromatographic methods (RPLC, HILIC, and emerging SFC) with orthogonal separations (IMS) and high-resolution mass spectrometry. By implementing the detailed protocols and strategies outlined in this application note, researchers can significantly enhance the resolution and confidence of their annotations, thereby accelerating the discovery of novel antifungal compounds from the remarkable chemical diversity of orchids.
Within LC-HRMS-based antifungal screening of Orchidaceae, the confidence assigned to metabolite identities is paramount. The Metabolomics Standards Initiative (MSI) provides a community-developed framework to standardize reporting and define confidence levels for metabolite annotation and identification [57]. This protocol details the practical implementation of MSI guidelines, specifically within the context of researching antifungal compounds in orchid species, to ensure results are reliable, reproducible, and communally meaningful.
The MSI Confidence Levels: A Framework for Annotation
The MSI guidelines establish a tiered system for communicating the confidence of a metabolite's identity, ranging from Level 1 (identified compound) to Level 4 (unknown compound) [58]. Precise definitions are critical for rigorous reporting.
Table: MSI Metabolite Identification Confidence Levels
| Confidence Level | Description | Minimum Required Evidence | Typical Workflow in Orchidaceae Antifungal Screening |
|---|---|---|---|
| Level 1: Identified Compound | Unequivocal identification using at least two orthogonal properties. | Comparison to an authentic chemical standard analyzed in the same laboratory with the same analytical methods. Match of properties such as retention time and MS/MS spectrum. | Co-analysis of commercially available stilbenoid or flavonoid standards with the orchid extract to confirm the identity of antifungal compounds like hircinol or orchinol [44]. |
| Level 2: Annotated Compound | Probable structural characterization based on spectral similarity. | Match of experimental MS/MS data to a reference spectrum in a public or library database. No requirement for a standard analyzed in the same lab. | Annotation of a tricin derivative flavonoid by matching its high-resolution MS/MS spectrum to a spectral library, suggesting it as a promising antifungal metabolite [44]. |
| Level 3: Tentative Candidate | Characterized by a chemical class or putative structure. | Evidence from analytical techniques (e.g., exact mass, precursor ion fragmentation) that can be assigned to a compound class. | Use of exact mass and in-silico fragmentation tools to propose a compound as a member of the stilbenoid class, associated with plant defense [44]. |
| Level 4: Unknown Compound | Unidentified or uncharacterized metabolite. | Distinguishing analytical signals (e.g., m/z, RT) but no structural information available. | A peak detected only in fungal-infected orchid samples whose structure remains unknown but is statistically significant in multivariate models. |
A critical distinction is that Level 1 requires data from authentic standards analyzed in the researcher's own laboratory, whereas Levels 2 and 3 do not [58]. Clearly defining this level in publications and data submissions is a core tenet of the MSI and is essential for providing clarity and preventing overstatement of results [58].
Experimental Protocol: Applying MSI Guidelines to Orchidaceae Antifungal Screening
The following protocol outlines a comprehensive LC-HRMS/MS workflow for antifungal metabolite discovery in Orchidaceae, incorporating MSI-recommended reporting standards at each stage [59].
Sample Preparation and Metadata Reporting
Proper sample preparation and detailed reporting are critical for experimental reproducibility.
- Biological Replication and Harvesting: Collect a minimum of five biological replicates (n=5) for each experimental group (e.g., healthy vs. fungal-infected orchid tissues) [59]. Immediately freeze tissues in liquid nitrogen upon resection to preserve metabolic integrity. Record the time duration from resection to freezing.
- Extraction: Homogenize ~50 mg of lyophilized tissue using a bead-based homogenizer. Perform extraction with 1 mL of ice-cold methanol. Conduct two sequential extractions, combining the supernatants after centrifugation [44] [59].
- Sample Preparation for LC-MS: Dry the combined extracts under a gentle nitrogen stream. Resuspend the residue in 100 µL of mobile phase (e.g., water/methanol 95:5) containing a known internal standard for quality control. Transfer to an LC vial for analysis.
- Metadata Recording: Document all parameters as per MSI guidelines, including tissue harvesting method, solvent volumes, extraction time, storage conditions, and instrument make/model [59].
LC-HRMS/MS Data Acquisition and Pre-processing
- Chromatographic Separation: Utilize a reversed-phase C18 column (e.g., 2.1 x 100 mm, 1.8 µm particle size). Employ a binary solvent gradient with a flow rate of 0.3 mL/min. Mobile Phase A: Water with 0.1% formic acid; Mobile Phase B: Acetonitrile with 0.1% formic acid.
- Mass Spectrometric Analysis: Operate the HRMS instrument in data-dependent acquisition (DDA) mode. Acquire full-scan MS data in the range of m/z 100-1500 at a resolution of >70,000. Select the top 5 most intense ions for fragmentation in the MS/MS stage per cycle.
- Quality Control: Inject a pooled quality control (QC) sample from all extracts at regular intervals (e.g., every 6 injections) to monitor instrument stability.
- Data Pre-processing: Convert raw data files to an open format (e.g., mzML). Use software tools (e.g., MS-DIAL, XCMS) for peak picking, alignment, and integration to create a feature table containing m/z, retention time, and intensity values [19].
Metabolite Annotation and Identification (Dereplication)
This is the core step for assigning MSI confidence levels.
Level 3 and 4 Annotations:
- Input the feature table into chemometric software for multivariate statistical analysis (e.g., PCA, OPLS-DA) to discriminate ions that differentiate healthy and fungal-infected samples [44].
- Calculate exact mass and use it for a database search (e.g., PubChem, HMDB) to obtain a putative molecular formula and identity.
- Use in-silico fragmentation tools (e.g., CFM-ID, SIRIUS) to predict the MS/MS spectrum and propose a tentative structure (Level 3).
Level 2 Annotations:
- Subject the MS/MS spectra of statistically significant features to spectral library matching.
- Use public libraries (e.g., GNPS) or commercial libraries. A high spectral similarity score (e.g., >0.7) supports a Level 2 annotation [44].
Level 1 Identification:
- For key antifungal candidates, procure an authentic chemical standard.
- Analyze the standard using the identical LC-HRMS method used for the orchid samples.
- Confirm identity by matching both the retention time (a tolerance of ± 0.1 min) and the MS/MS spectrum (a tolerance of ± 10 ppm for precursor mass and high spectral similarity) [58].
Data Submission and Reporting
- Structural Codes: For any metabolite assigned Level 1-3, include its common name and a structural code (e.g., InChIKey or SMILES) in any publication or submission [58].
- Repository Submission: Submit the raw data, processed feature table, and all associated experimental metadata to a public repository such as MetaboLights or Metabolomics Workbench, ensuring compliance with MSI minimal reporting standards [60] [61].
The following workflow diagram summarizes the key experimental and computational steps in the protocol, highlighting the critical points for assigning MSI confidence levels.
The Scientist's Toolkit: Essential Research Reagents and Materials
Table: Key Reagents and Resources for LC-HRMS Metabolomics
| Item | Function/Description | Example in Orchidaceae Research |
|---|---|---|
| Authentic Chemical Standards | Pure compounds used for Level 1 identification by matching RT and MS/MS. | Stilbenoid standards (e.g., orchinol, hircinol) to confirm antifungal compounds [44]. |
| Spectral Libraries | Databases of reference MS/MS spectra for Level 2 annotation via spectral matching. | GNPS, MassBank, or in-house libraries for annotating flavonoids and terpenoids [44]. |
| Internal Standards | Isotopically-labeled compounds added to samples to monitor analytical performance. | Used during extraction to correct for variability and assess instrument stability. |
| Chromatography Column | The core component for separating complex metabolite mixtures prior to MS detection. | Reversed-Phase C18 column (e.g., 2.1 x 100 mm, 1.8 µm) for profiling polyphenols [44]. |
| In-silico Tools | Software for predicting MS/MS fragmentation and proposing structures (Level 3). | Used for tentative annotation of novel or rare metabolites in orchid species [44]. |
Implementing the MSI guidelines is not an administrative burden but a foundational practice that elevates the scientific rigor of metabolomics research. For Orchidaceae antifungal screening, it provides a clear, standardized language to communicate discoveries—from newly annotated defensive compounds to fully identified antifungal leads—ensuring that data is robust, interpretable, and impactful for future scientific and drug development efforts.
In the context of Orchidaceae metabolomics research utilizing LC-HRMS antifungal screening, the challenge of false positives represents a significant bottleneck in the discovery of novel bioactive compounds. Non-target screening (NTS) using liquid chromatography-high-resolution mass spectrometry (LC-HRMS) enables comprehensive detection of thousands of chemical features without prior knowledge, making it particularly valuable for identifying novel antifungal metabolites in complex plant matrices [62]. However, the sheer volume of detected features—often thousands per sample—creates substantial challenges in distinguishing true biologically relevant metabolites from analytical artifacts [63]. Within Orchidaceae species, which produce diverse polyphenols, flavonoids, phenolic acids, chromones, and stilbenoids with potential antifungal properties, proper management of false positives is essential for accurate metabolic profiling and biomarker discovery [44]. This application note addresses key data processing pitfalls and provides structured protocols for minimizing false positives, specifically framed within antifungal screening of Orchidaceae species.
The table below summarizes the primary sources and impacts of false positives in LC-HRMS-based non-target screening, particularly relevant to Orchidaceae metabolomics studies:
Table 1: Key Challenges in Non-Target Screening Contributing to False Positives
| Challenge Category | Specific Source of False Positives | Impact on Data Quality | Recommended Mitigation Strategy |
|---|---|---|---|
| Technical Variability | Instrument drift, batch effects, retention time shifts | Signal intensity fluctuations mistaken for biological variation | Batch effect correction, quality control samples, internal standards [64] |
| Sample Preparation | Inconsistent extraction, matrix effects, contamination | Artificial metabolic differences between sample groups | Standardized protocols, solid phase extraction, matrix-matched calibrants [62] |
| Data Processing | Peak detection errors, misalignment, poor peak shape | Missing true features or creating artificial ones | Advanced algorithms (e.g., MassCube), parameter optimization [65] |
| Compound Identification | Incorrect spectral matching, database limitations | Misannotation of metabolites | Multi-level confidence scoring, in silico fragmentation tools [44] |
| Biological Interpretation | Carrier effects, heterozygosity in plant samples | Elevated analyte levels not linked to true biological state | Genomic correlation, pathway analysis [66] |
Integrated Prioritization Strategies for False Positive Reduction
Effective reduction of false positives requires a multi-layered prioritization approach. Research demonstrates that integrating seven complementary strategies significantly improves identification accuracy in environmental samples, with similar applications possible in plant metabolomics [63]:
Table 2: Seven-Point Prioritization Framework for Non-Target Screening
| Strategy | Primary Focus | Application in Orchidaceae Antifungal Screening | Expected Outcome |
|---|---|---|---|
| Target and Suspect Screening (P1) | Predefined compound databases | Matching against known antifungal compounds in Orchidaceae | Rapid identification of known metabolites |
| Data Quality Filtering (P2) | Removal of artifacts and unreliable signals | Filtering based on blank occurrence, replicate consistency | Reduced technical false positives |
| Chemistry-Driven Prioritization (P3) | Compound-specific properties | Mass defect filtering for specialized metabolite classes | Enhanced detection of relevant chemical classes |
| Process-Driven Prioritization (P4) | Spatial, temporal, or technical processes | Comparing healthy vs. fungal-infected plant samples [44] | Identification of infection-responsive metabolites |
| Effect-Directed Prioritization (P5) | Biological response data | Correlation with antifungal activity assays | Focus on bioactive compounds |
| Prediction-Based Prioritization (P6) | In silico risk assessment | Predicting bioactive compounds from structural features | Prioritization of high-value candidates |
| Pixel/Tile-Based Approaches (P7) | Chromatographic region analysis | Focusing on metabolite-rich LC regions in complex samples | Early-stage data reduction |
Experimental Protocols for False Positive Minimization
Protocol 1: Sample Preparation and LC-HRMS Analysis for Orchidaceae Tissues
This protocol is adapted from methodologies applied to Orchidaceae species, specifically designed to maintain metabolite integrity while minimizing technical variability [44].
Reagents and Materials:
- Fresh or lyophilized Orchidaceae plant tissue (e.g., leaves, roots)
- Extraction solvent: Ethanol (HPLC grade) or methanol:water (80:20, v/v)
- Solid phase extraction cartridges (e.g., Oasis HLB, Strata WAX/WCX for comprehensive coverage) [62]
- Internal standards: IROA isotopic labeling standards or compound-specific stable isotope-labeled analogs [64]
- LC mobile phases: (A) Water with 0.1% formic acid; (B) Acetonitrile with 0.1% formic acid
- Quality control samples: Pooled quality control (QC) samples from all experimental samples
Procedure:
- Tissue Homogenization: Precisely weigh 100±5 mg of lyophilized and powdered Orchidaceae tissue. For fresh tissue, use 500±25 mg and include a freeze-drying step.
- Metabolite Extraction: Add 1 mL of ice-cold extraction solvent and 20 μL of internal standard mixture. Homogenize using a pre-cooled bead beater for 3×60 seconds with 30-second cooling intervals.
- Sample Cleanup: Centrifuge at 14,000×g for 15 minutes at 4°C. Transfer supernatant to SPE cartridges preconditioned with 3 mL methanol and 3 mL water. Elute with 2 mL of methanol.
- Solvent Evaporation: Evaporate extracts to dryness under a gentle nitrogen stream at 35°C. Reconstitute in 100 μL of initial mobile phase composition.
- LC-HRMS Analysis: Inject 5 μL onto a reversed-phase C18 column (2.1×100 mm, 1.8 μm) maintained at 40°C. Use a gradient elution: 5-95% B over 25 minutes, hold at 95% B for 5 minutes. Flow rate: 0.3 mL/min.
- Mass Spectrometry: Operate in both positive and negative ionization modes with data-dependent acquisition. Resolution: ≥70,000 full width at half maximum; mass accuracy: <5 ppm.
Protocol 2: Data Processing Workflow with Integrated False Positive Filters
This protocol incorporates modern computational tools and machine learning approaches to enhance data quality [62] [65].
Software Requirements:
- MassCube, MS-DIAL, MZmine3, or XCMS for data processing [65]
- R or Python with metabolomics packages (MetaboAnalyst, Python-based frameworks) for statistical analysis
- In-house or commercial databases for metabolite annotation (e.g., GNPS, PubChemLite)
Processing Steps:
- Raw Data Conversion: Convert vendor files to open formats (mzML, mzXML) using MSConvert or similar tools.
- Peak Detection and Alignment: Use MassCube with optimized parameters (sigma value = 1.2, prominence ratio = 0.1) for balanced sensitivity-specificity tradeoff [65].
- Quality Control Filtering:
- Remove features with >30% relative standard deviation in QC samples
- Eliminate features present in procedural blanks with signal intensity >5% of sample average
- Apply peak shape filters (symmetry factor: 0.8-1.5, width at half height: 2-30 seconds)
- Missing Value Imputation: Use k-nearest neighbors algorithm for missing value imputation with k=10, but only for features with <50% missing values across samples.
- Batch Effect Correction: Apply quality control-based robust spline correction (QCRSC) or similar algorithms to correct for instrumental drift.
- Multivariate Analysis:
- Perform Principal Component Analysis (PCA) to identify outliers and overall data structure
- Apply machine learning classifiers (Random Forest, Support Vector Machines) to identify discriminatory features between healthy and fungal-infected samples [62]
- Metabolite Annotation:
- Level 1: Confirmation with authentic standards (retention time, MS/MS spectrum)
- Level 2: Annotation by spectral library matching (e.g., GNPS, MassBank)
- Level 3: Putative characterization by in silico fragmentation tools [44]
The following workflow diagram illustrates the integrated approach for minimizing false positives throughout the non-target screening process:
The Scientist's Toolkit: Essential Research Reagents and Software
The table below details key reagents, materials, and software solutions essential for implementing robust false positive reduction strategies in Orchidaceae metabolomics research:
Table 3: Essential Research Reagents and Computational Tools for Non-Target Screening
| Category | Item | Specification/Example | Application in False Positive Reduction |
|---|---|---|---|
| Sample Preparation | Solid Phase Extraction | Multi-sorbent strategies (Oasis HLB + ISOLUTE ENV+) | Comprehensive metabolite coverage, reduced matrix effects [62] |
| Internal Standards | Isotopic Labeling | IROA [13C] biological matrix | Correction for sample loss, ion suppression, instrument drift [64] |
| LC Separation | Chromatography Columns | Reversed-phase C18 (2.1×100 mm, 1.8 μm) | Optimal separation of Orchidaceae specialized metabolites |
| Mass Spectrometry | HRMS Systems | Q-TOF, Orbitrap instruments (Resolution ≥70,000) | Accurate mass measurement for compound identification |
| Data Processing | Software Platforms | MassCube, XCMS, MS-DIAL | Robust peak detection with minimal false features [65] |
| Statistical Analysis | Machine Learning Tools | Random Forest, PLS-DA, SVM | Pattern recognition for discriminating true biomarkers [62] |
| Compound Annotation | Spectral Libraries | GNPS, MassBank, in-house databases | Confident metabolite identification through spectral matching |
| Validation | Reference Materials | Certified reference materials, authentic standards | Verification of putative identifications |
Minimizing false positives in non-target screening of Orchidaceae metabolomics data requires an integrated approach spanning careful experimental design, robust data acquisition, and sophisticated computational processing. By implementing the prioritization strategies, experimental protocols, and quality control measures outlined in this application note, researchers can significantly enhance the reliability of their antifungal metabolite discovery pipelines. The combination of advanced instrumentation, appropriate statistical tools, and systematic validation creates a foundation for generating high-confidence metabolic profiles that accurately represent the chemical diversity and biological responses of Orchidaceae species to fungal infection.
Strategies for Isolating and Purifying LC-HRMS-Annotated Hits for Bioassay
The discovery of new antifungal agents from natural products requires a seamless transition from the initial annotation of metabolites via Liquid Chromatography-High-Resolution Mass Spectrometry (LC-HRMS) to the isolation of pure compounds for bioassay. This process is particularly crucial in research on plant families like Orchidaceae, which produce a diverse array of defensive specialized metabolites. This application note details integrated strategies and provides standardized protocols for the efficient isolation and purification of LC-HRMS-annotated hits, framed within the context of an Orchidaceae metabolomics study targeting antifungal compounds. We demonstrate how modern dereplication and metabolomics-guided tools prevent the redundant re-isolation of known compounds and focus efforts on novel or target bioactive entities, such as the stilbenoids and flavonoids identified in Vanda and Cattleya genera [4].
In LC-HRMS-based antifungal screening of Orchidaceae, the initial untargeted metabolomics profiling provides a list of putatively annotated metabolites. The primary challenge is to prioritize and physically isolate these annotated "hits" from a complex crude extract for subsequent biological testing. The classical approach of bioassay-guided fractionation, while effective, is time-consuming and can lead to the re-isolation of known compounds [67] [68]. Herein, we outline a synergistic strategy that leverages the analytical power of LC-HRMS to guide the isolation process, thereby increasing efficiency and throughput. This strategy is built upon a workflow of Dereplication → Prioritization → Fractionation → Purification → Structure Confirmation.
The following workflow diagram outlines the critical decision points in this process:
From LC-HRMS Annotation to Isolation: Core Strategies
Pre-Isolation Dereplication and Metabolomics-Guided Prioritization
Before any preparative work, a thorough dereplication of the LC-HRMS data is essential to avoid isolating known compounds.
- Molecular Networking: Tools like Classical Molecular Networking on the GNPS platform can rapidly cluster metabolites based on MS/MS spectral similarity, visually grouping related compounds and highlighting unique chemical families within the Orchidaceae extract. In a study of Vanda and Cattleya, this approach was key in discriminating ions that differentiated healthy and fungal-infected samples [4].
- Orthogonal Data Analysis: Combining LC-HRMS data with multivariate statistical methods such as Principal Component Analysis (PCA) and Orthogonal Projections to Latent Structures Discriminant Analysis (OPLS-DA) can pinpoint ions that are statistically significant in differentiating bioactive samples (e.g., fungal-infected plants) from controls. This was successfully applied to prioritize anti-MRSA metabolites from actinomycetes, a strategy directly transferable to antifungal discovery [67].
- In silico Fragmentation Tools: Software such as SIRIUS/CSI:FingerID can predict molecular fingerprints and candidate structures directly from MS/MS data, providing a higher level of confidence in annotations before isolation begins [69].
Table 1: Key In Silico Tools for Dereplication and Annotation
| Tool/Platform | Primary Function | Application in Orchidaceae Research |
|---|---|---|
| GNPS Molecular Networking [4] | Clusters MS/MS spectra by similarity | Discriminate antifungal-related ions; rapidly annotate 50+ metabolites via spectral matching. |
| Dereplicator+ [4] | Identifies known natural products in a dataset | Rapidly annotate compounds like stilbenoids and flavonoids against known libraries. |
| SIRIUS/CSI:FingerID [69] | Predicts molecular formula and structure from MS/MS | Provides structural candidates for unknowns not found in spectral libraries. |
| MetFrag/CFM-ID [69] | In silico fragmentation of candidate structures | Scores candidate structures by matching predicted vs. experimental MS/MS spectra. |
Strategic Fractionation and Purification
Once targets are prioritized, the physical isolation process begins.
- Initial Fractionation: Liquid-liquid partitioning (e.g., with ethyl acetate [67]) or flash chromatography is used to fractionate the crude extract into less complex sub-fractions. These fractions should be profiled by LC-HRMS to track the target ions and tested in bioassays to confirm retention of antifungal activity.
- Metabolomics-Guided Purification: The use of feature-based molecular networking (FBMN) allows researchers to correlate LC-HRMS features (m/z, RT, and ion abundance) with bioactivity data. Ions that are abundant in active fractions and correlate with the statistical models from OPLS-DA are prioritized for purification [4] [67].
- High-Resolution Purification: Semi-preparative or preparative HPLC, ideally with MS-compatible mobile phases, is the method of choice for final purification. Utilizing the same stationary phase chemistry (e.g., C18) as in the analytical scale facilitates the accurate transfer of separation conditions. MS-triggered fraction collection can be employed to selectively collect the target ion even in cases of co-elution, drastically improving purity and efficiency [68].
Detailed Experimental Protocols
Protocol 1: LC-HRMS Analysis and Dereplication of Orchidaceae Extracts
This protocol is adapted from methodologies used in the analysis of Vanda and Cattleya genera [4].
I. Sample Preparation
- Extraction: Homogenize 1 g of lyophilized plant material (e.g., leaves). Perform extraction with 10 mL of ethanol or methanol using an ultrasonic bath for 30 minutes. Centrifuge at 4,000 g for 10 min and collect the supernatant. Repeat twice and combine supernatants.
- Concentration: Evaporate the combined extracts to dryness under reduced pressure using a rotary evaporator at 40°C.
- Reconstitution: Reconstitute the dry extract in LC-MS grade methanol to a final concentration of 1 mg/mL. Filter through a 0.22 μm syringe filter before injection.
II. LC-HRMS Data Acquisition
- LC System: UHPLC system.
- Column: C18 reversed-phase column (e.g., 2.1 x 100 mm, 1.7-1.8 μm).
- Mobile Phase: (A) Water with 0.1% formic acid; (B) Acetonitrile with 0.1% formic acid.
- Gradient: 5% B to 100% B over 25-30 minutes.
- MS: Q-TOF or Orbitrap mass spectrometer equipped with an ESI source.
- Acquisition Mode: Data-Dependent Acquisition (DDA) in positive and/or negative ion mode to collect MS1 and MS/MS spectra.
III. Data Processing and Dereplication
- Convert raw data to open formats (e.g., .mzML).
- Upload files to the GNPS platform for Molecular Networking analysis (cosine score >0.7).
- Use Dereplicator+ and other in silico tools to annotate nodes in the network.
- Correlate annotated features with sample metadata (e.g., healthy vs. infected) to prioritize hits for isolation.
Protocol 2: Bioassay-Guided Isolation of Antifungal Compounds
This protocol follows the logic applied in the screening of actinomycetes for anti-MRSA compounds [67].
I. Preparative Scale Fermentation and Extraction
- Scale-up: For microbial cultures, inoculate 1 L of ISP4 broth with a 5% bacterial inoculum and incubate at 30°C for 7 days on a rotary shaker [67].
- Liquid-Liquid Partitioning: Terminate the culture with an equal volume of ethyl acetate (1:1 v/v) in a separating funnel. Partition thoroughly and collect the organic (ethyl acetate) layer. Repeat the process three times. Combine the ethyl acetate fractions and concentrate to dryness under vacuo to obtain the crude extract [67].
II. Bioassay-Guided Fractionation
- Primary Screening: Test the crude extract for antifungal activity (e.g., against Candida albicans) using a cup diffusion or microdilution assay.
- Fractionation: Subject the active crude extract to vacuum liquid chromatography (VLC) or flash column chromatography using a gradient of hexane/ethyl acetate/methanol.
- Tracking and Testing: Analyze all collected fractions by analytical LC-HRMS to track the annotated hits. Test all fractions in the antifungal bioassay. Proceed with fractions that show both the presence of the target ion and significant bioactivity.
III. Final Purification via Semi-Preparative HPLC
- System Setup: Semi-preparative HPLC system with a C18 column (e.g., 10 x 250 mm, 5 μm).
- Method Transfer: Scale up the analytical gradient, adjusting the flow rate (e.g., 3-5 mL/min) and injection volume accordingly.
- Fraction Collection: Inject the active sub-fraction and collect peaks based on UV signal (and MS trigger if available). The fraction corresponding to the retention time of the target LC-HRMS ion should be collected separately.
- Quality Control: Analyze each collected fraction by analytical LC-HRMS to confirm purity and identity. A pure compound should show a single peak with the correct mass.
Table 2: Key Reagents and Materials for Isolation and Purification
| Research Reagent/Material | Function/Application |
|---|---|
| Ethyl Acetate (Solvent) | Organic solvent for liquid-liquid partitioning of extracellular metabolites from fermentation broth or plant extracts [67]. |
| ISP4 Broth | A standardized culture medium used for the fermentation of actinomycetes to promote the production of secondary metabolites [67]. |
| C18 Reversed-Phase HPLC Columns (Analytical and Preparative) | The workhorse stationary phase for the separation of complex natural product mixtures like plant extracts, based on hydrophobicity [4] [70]. |
| Formic Acid | A volatile acid additive to the LC mobile phase, which improves chromatographic peak shape and promotes protonation in ESI+ mode for better MS sensitivity [4]. |
| DPPH Radical (2,2-diphenyl-1-picrylhydrazyl) | A stable free radical used for rapid in vitro spectrophotometric assessment of the antioxidant activity of extracts and fractions, a common secondary bioactivity [71]. |
| 15-Lipoxygenase (15-LOX) Enzyme | Used in in vitro enzymatic assays to evaluate the anti-inflammatory activity of isolated compounds or fractions [71]. |
Confirmation and Bioassay
The final, critical step is to confirm the structure and activity of the isolated compound.
- Structure Elucidation: Nuclear Magnetic Resonance (NMR) spectroscopy (1D and 2D experiments such as 1H, 13C, COSY, HSQC, HMBC) is the definitive method for de novo structure elucidation. The LC-HRMS data (accurate mass, molecular formula, and fragmentation pattern) serves as a complementary dataset [4] [68].
- Validation Bioassay: The pure, isolated compound must be re-tested in the target antifungal bioassay to confirm that the observed activity is indeed intrinsic to the compound and not the result of synergism within the mixture. Determine minimum inhibitory concentrations (MICs) for quantitative assessment [67].
The integration of LC-HRMS-based metabolomics, strategic dereplication, and targeted purification creates a powerful pipeline for accelerating the discovery of bioactive natural products. By applying these detailed protocols and strategies within the context of Orchidaceae research, scientists can efficiently bridge the gap between the annotation of promising antifungal hits and the isolation of the pure compounds responsible for the activity, thereby streamlining the path to new drug leads.
Assessing Efficacy and Specificity of Orchid-Derived Antifungals
Correlating LC-HRMS Abundance with In Vitro Antifungal Activity
Within the context of Orchidaceae metabolomics research, a primary objective is to identify novel antifungal compounds from natural sources to combat the growing threat of fungal resistance [1] [72]. Liquid Chromatography-High Resolution Mass Spectrometry (LC-HRMS) is a powerful technology for discovering novel biologically active molecules by providing high selectivity, sensitivity, and the ability to detect a wide range of analytes in complex samples [1]. The correlation between metabolite abundance, as determined by LC-HRMS, and experimentally measured antifungal activity forms a critical bridge in the prioritization of lead compounds. This application note details a validated protocol for establishing this correlation, using research on Orchidaceae species as a foundational example [1].
Experimental Design and Workflow
The overall strategy for linking LC-HRMS abundance data with antifungal activity involves a parallel processing of biological samples, followed by integrated data analysis. The workflow ensures that metabolic profiling and bioactivity screening are performed under comparable conditions.
Figure 1: Integrated workflow for correlating LC-HRMS abundance with antifungal activity.
Materials and Methods
Research Reagent Solutions and Essential Materials
The following table details key reagents and materials required for the successful execution of this protocol.
Table 1: Essential Research Reagents and Materials
| Item | Function/Application | Specifications/Alternatives |
|---|---|---|
| Orchidaceae Plant Material | Source of antifungal metabolites. | Healthy vs. fungal-infected plants for metabolic dynamic assessment [1]. |
| LC-MS Grade Solvents | Mobile phase preparation and sample extraction. | Acetonitrile, methanol, water with 0.1% formic acid [1]. |
| UHPLC System | High-resolution chromatographic separation of complex extracts. | Enables separation of isobaric and isomeric metabolites [1]. |
| Orbitrap Mass Spectrometer | Accurate mass measurement and MS/MS fragmentation. | Sub-ppm mass accuracy for precise molecular formula assignment [1]. |
| C18 Chromatography Column | Reverse-phase separation of metabolites. | Standard for natural products metabolomics (e.g., 2.1 x 100 mm, 1.7-1.9 µm) [1]. |
| 96-well Microtiter Plates | High-throughput antifungal susceptibility testing. | Compatible with serial broth microdilution methods [73]. |
| Candida spp. Strains | Model organisms for antifungal bioassays. | Includes standard and multi-drug resistant strains [72]. |
| GNPS Platform | Molecular networking and spectral library matching. | For metabolite annotation and dereplication [1]. |
Sample Preparation and LC-HRMS Analysis Protocol
1. Extraction:
- Homogenize plant material (e.g., Orchidaceae leaves/stems) under liquid nitrogen.
- Weigh 100 mg of lyophilized powder and perform extraction with 1 mL of ethanol (or other suitable solvent) in an ultrasonic bath for 30 minutes [1] [73].
- Centrifuge at 12,000–14,000 g for 10 minutes and collect the supernatant.
- Filter through a 0.22 µm membrane prior to LC-MS analysis.
2. LC-HRMS Data Acquisition:
- Chromatography: Utilize a UHPLC system with a C18 column. Employ a binary gradient with a water-acetonitrile mobile phase, both modified with 0.1% formic acid. A typical gradient runs from 5% to 100% acetonitrile over 15-20 minutes [1].
- Mass Spectrometry: Acquire data in data-dependent acquisition (DDA) mode on a high-resolution mass spectrometer (e.g., Orbitrap).
- Full scan resolution: ≥ 60,000 FWHM.
- Scan range: m/z 100–1500.
- Top N (e.g., 10) most intense ions selected for fragmentation in each cycle.
- Collision energies: Stepped (e.g., 20, 40 eV) for richer fragmentation patterns [1].
3. Metabolite Annotation:
- Process raw data using software like MZmine or XCMS for feature detection, alignment, and integration to create a peak table with m/z, retention time, and abundance.
- Annotate metabolites using the following tools in an integrated manner:
- GNPS Molecular Networking: Create networks based on MS/MS spectral similarity to cluster related compounds and propagate annotations [1].
- SIRIUS 5: Calculate molecular formula and predict structures via in-silico fragmentation [72].
- Spectral Libraries: Match MS/MS spectra against public databases (e.g., GNPS libraries) [1].
In Vitro Antifungal Activity Assessment Protocol
1. Broth Microdilution Assay:
- Prepare a standardized inoculum of the target fungal pathogen (e.g., Candida albicans) in an appropriate broth medium like RPMI-1640, adjusted to a final density of 1–5 x 10³ CFU/mL [73].
- Serially dilute the plant extracts or fractions two-fold in a 96-well plate across a concentration range.
- Add the fungal inoculum to each well. Include growth control (inoculum without extract) and sterility control (medium only) wells.
- Incubate the plates at 35°C for 24-48 hours [73].
2. Determination of MIC and MFC:
- Minimum Inhibitory Concentration (MIC): After incubation, determine the MIC as the lowest extract concentration that produces ~100% visual inhibition of fungal growth compared to the growth control. For increased objectivity, use a resazurin dye assay or measure optical density at 600 nm [73].
- Minimum Fungicidal Concentration (MFC): Aliquot from wells showing no growth onto fresh solid agar medium. The MFC is the lowest concentration that results in no fungal colony growth after incubation, indicating fungicidal (≥ 99.9% killing) rather than fungistatic activity [73].
Data Integration and Correlation Analysis
The core of this application note lies in the statistical and chemometric integration of the generated datasets. The goal is to identify specific ions (metabolites) whose abundance correlates strongly with the level of antifungal activity.
Chemometric Workflow for Marker Discovery
Advanced data analysis is required to pinpoint the metabolites responsible for the observed bioactivity.
Figure 2: Data analysis workflow for identifying antifungal metabolite markers.
1. Data Pre-processing: Normalize the LC-HRMS peak area data to correct for variations in sample loading (e.g., using total area or internal standard normalization). Scale the data (e.g., Pareto or Unit Variance scaling) to ensure all variables contribute equally to the model.
2. Multivariate Statistical Analysis:
- Principal Component Analysis (PCA): An unsupervised method used to overview the data, detect trends, clusters, and outliers among the samples (e.g., healthy vs. infected plants) [73].
- Orthogonal Projections to Latent Structures-Discriminant Analysis (OPLS-DA): A supervised method that maximizes the separation between predefined sample classes (e.g., high-activity vs. low-activity extracts). The S-plot from OPLS-DA is particularly useful for identifying potential biomarker ions that are both statistically significant and biologically relevant [73].
3. Correlation Analysis: Perform univariate statistical analysis, such as Spearman's rank correlation, between the abundance of each annotated metabolite and the corresponding -log₁₀(MIC) value across all samples. Metabolites with a strong positive correlation (e.g., correlation coefficient > 0.7 and p-value < 0.05) are candidates for activity markers.
Key Findings from Orchidaceae and Propolis Research
Application of this integrated approach in real-world studies has yielded actionable insights. The table below summarizes quantitative findings from relevant studies, illustrating the correlation between specific metabolite classes and antifungal activity.
Table 2: Correlations between Metabolite Abundance and Antifungal Activity from Literature
| Metabolite / Compound Class | Reported Activity (MIC) | Correlation with Activity | Biological Model | Key Finding |
|---|---|---|---|---|
| Tricin derivative flavonoid [1] | Not specified | Found exclusively in healthy plants; proposed as a promising antifungal metabolite [1]. | Orchidaceae (Vanda, Cattleya) | Molecular networking and chemometrics discriminated ions specific to healthy vs. infected samples [1]. |
| Loliolide terpenoid [1] | Not specified | Found exclusively in healthy plants; proposed as a promising antifungal metabolite [1]. | Orchidaceae (Vanda, Cattleya) | Metabolic dynamic assessment revealed its presence as a marker for healthy state [1]. |
| Stilbenoids (e.g., Orchinol) [1] | Antifungal activity reported [1] | Higher abundance in fungal-infected plants; induced as a biochemical defense [1]. | Orchidaceae | Metabolic profiling showed variation in stilbenoid abundance as a response to microbial attack [1]. |
| Flavonoid Mixture (Chrysin, Galangin, etc.) [73] | MIC = 64 µg/mL (mixture) | Synergistic effect; individual compounds showed MIC >256 µg/mL [73]. | Propolis vs. Candida spp. | Demonstrated that activity is often determined by synergy between components, not single compounds [73]. |
Discussion and Concluding Remarks
The integrated protocol described herein provides a robust framework for correlating LC-HRMS-derived metabolite abundance with in vitro antifungal activity. The strength of this approach lies in its ability to move beyond simple fingerprinting to identify specific, bioactive constituents within complex plant matrices like Orchidaceae.
A critical insight from propolis research, which is highly applicable to Orchidaceae studies, is that antifungal activity often results from synergistic interactions between multiple compounds rather than the action of a single metabolite [73]. This underscores the importance of considering metabolite combinations when interpreting correlation data. Future directions should include the application of more advanced statistical models for predicting synergy and the use of bioassay-guided fractionation to experimentally validate the contributions of correlated metabolites.
In conclusion, the correlation of LC-HRMS abundance data with antifungal bioactivity is a powerful strategy for accelerating the discovery of novel antifungal agents from natural sources. The detailed protocols, reagent information, and data analysis workflows provided in this application note offer researchers a comprehensive guide for implementing this strategy in their own laboratories.
Application Note
This application note details a comprehensive comparative metabolomics framework for identifying species-specific and organ-specific antifungal defense molecules within the Orchidaceae family. Leveraging Liquid Chromatography-High Resolution Tandem Mass Spectrometry (LC-HRMS/MS), this protocol facilitates the untargeted screening of plant extracts to pinpoint key metabolites involved in biochemical responses to fungal pathogens [1]. The approach reliably discriminates metabolic profiles between healthy and fungal-infected plant samples [1], and can be adapted to study variations between wild and cultivated specimens [31] [74] or different plant organs [75]. The integration of molecular networking and chemometric analyses provides a powerful strategy for discovering novel antifungal hits and leads in natural product research [1] [44].
Key Quantitative Profiles of Antifungal Metabolites in Orchidaceae
Table 1: Key Antifungal Metabolite Classes Identified via LC-HRMS/MS in Orchidaceae
| Metabolite Class | Specific Examples | Relative Abundance (Fungal-Infected vs. Healthy) | Proposed Antifungal Role |
|---|---|---|---|
| Stilbenoids [1] | Orchinol, Hircinol [1] | Increased [1] | Phytoalexins with reported antifungal activity; induced as a defense mechanism [1]. |
| Flavonoids [1] [31] | Tricin derivatives [1] | Decreased (some, e.g., Tricin) [1] | Promising antifungal metabolites; some specific flavonoids are depleted upon infection [1]. |
| Phenolic Acids [1] | Cinnamic acid derivatives [1] | Variable | Associated with biochemical responses to microbial attack [1]. |
| Terpenoids [1] | Loliolide [1] | Decreased [1] | Promising antifungal metabolite found only in healthy plants [1]. |
| Alkaloids [51] | Calystegine B₂ [51] | Increased (in fungal interaction) [51] | Accumulates in tubers during fungal interaction, contributing to antimicrobial effects [51]. |
| Dihydrophenanthrenes [51] | Not specified | Increased (in fungal interaction) [51] | Defense compounds with validated antimicrobial activity [51]. |
Experimental Workflow for Comparative Antifungal Metabolomics
The following diagram illustrates the integrated experimental and computational workflow for LC-HRMS/MS-based antifungal metabolite screening in Orchidaceae.
Figure 1: Experimental workflow for antifungal metabolomics.
Protocols
Protocol 1: LC-HRMS/MS-Based Metabolite Profiling of Orchidaceae Extracts
This protocol is designed for the untargeted metabolomic profiling of orchid tissues to discriminate antifungal metabolites [1].
Materials and Reagents
- Plant Material: Fresh or lyophilized tissues (e.g., stems, tubers, leaves) from orchid species of interest (e.g., Vanda, Cattleya, Dendrobium) [1] [31].
- Extraction Solvent: Ethanol (e.g., for preparing ethanolic plant extracts) or suitable LC-MS grade solvent [1].
- LC-HRMS/MS System: Ultra-high-performance liquid chromatography system coupled to a high-resolution mass spectrometer (e.g., Orbitrap) [1] [31].
- Chromatography Column: Appropriate UPLC reversed-phase column (e.g., C18) [31].
- Data Analysis Software: Software for molecular networking (e.g., GNPS) and chemometrics [1].
Procedure
Sample Preparation:
- Homogenize 100 mg of lyophilized plant tissue.
- Perform metabolite extraction with 1 mL of 80% ethanol (v/v) using ultrasonication for 20 minutes.
- Centrifuge at 14,000 × g for 15 minutes at 4°C. Collect the supernatant, filter through a 0.22 µm membrane, and transfer to an LC-MS vial [1].
LC-HRMS/MS Analysis:
- Chromatography: Use a gradient elution with mobile phase A (0.1% formic acid in water) and B (0.1% formic acid in acetonitrile). The typical run time is 20-30 minutes [1] [31].
- Mass Spectrometry: Acquire data in data-dependent acquisition (DDA) mode in both positive and negative electrospray ionization (ESI) modes. Set the mass resolution to >60,000 for full MS and perform MS/MS on the top N most intense ions [1].
Data Pre-processing:
Protocol 2: Molecular Networking and Chemometric Analysis for Antifungal Metabolite Discovery
This protocol details the bioinformatic analysis of LC-HRMS/MS data to annotate metabolites and identify species-specific antifungal compounds.
Materials and Software
- Feature Table: Output from Protocol 1, Section 2.1.2, Step 3.
- MS/MS Spectral Files: .mgf format files from data acquisition.
- GNPS Platform: Access the Global Natural Products Social Molecular Networking website (https://gnps.ucsd.edu) [1].
- Statistical Software: R or Python with packages for multivariate statistics.
Procedure
Molecular Networking (MN):
- Upload your MS/MS spectral file (.mgf) to the GNPS platform.
- Create a molecular network using the
FEATURE-BASED_MOLECULAR_NETWORKINGworkflow. Set the precursor ion mass tolerance to 0.02 Da and MS/MS fragment ion tolerance to 0.02 Da. Use a minimum cosine score of 0.7 for network edges [1]. - Inspect the resulting network for clusters of metabolites, which often correspond to molecular families.
Dereplication and Annotation:
- Use integrated GNPS tools like
DEREPLICATOR+andNetwork Annotation Propagation (NAP)to annotate nodes by comparing experimental MS/MS spectra against curated spectral libraries [1]. - Annotations can be confirmed by analyzing MS/MS fragmentation patterns and calculating empirical formulas from high-resolution mass data [1].
- Use integrated GNPS tools like
Chemometric Analysis for Differential Metabolites:
- Import the feature intensity table into your statistical software.
- Perform Principal Component Analysis (PCA) to observe natural clustering of samples (e.g., healthy vs. infected) [31].
- Perform Partial Least Squares-Discriminant Analysis (PLS-DA) to identify features (ions) that most contribute to the separation between sample groups. Use Variable Importance in Projection (VIP) scores > 1.0 and fold-change (FC) thresholds (e.g., |log2FC| ≥ 1) to select significant differential metabolites [31].
Metabolic Pathways in Plant-Fungal Interactions
The following diagram summarizes the key metabolic pathways and defense molecules induced in orchids during fungal interaction, as identified through multi-omics approaches.
Figure 2: Defense pathways in plant-fungal interactions.
The Scientist's Toolkit
Table 2: Essential Reagents and Solutions for LC-HRMS/MS-Based Antifungal Metabolomics
| Item | Function/Application | Specific Example/Note |
|---|---|---|
| LC-HRMS/MS System | High-resolution separation and detection of metabolites; provides accurate mass and MS/MS fragmentation data. | Orbitrap-based mass spectrometers are widely used for their high mass accuracy and resolution [1]. |
| C18 UPLC Column | Chromatographic separation of complex plant extracts. | A standard 1.7-2.0 µm particle size column provides excellent resolution of metabolites [31]. |
| GNPS Platform | Web-based platform for molecular networking, dereplication, and metabolite annotation via spectral matching. | Critical for rapid annotation of known compounds and visualization of molecular families [1]. |
| Quoirin and Lepoivre (QL) Medium | For asymbiotic in vitro culture of orchid plants and protocorms, ensuring sterile plant material. | Used for establishing controlled plant-fungal interaction studies [51]. |
| Murashige and Skoog (MS) Medium | For culturing mycorrhizal fungi and as a basal medium for co-cultivation with plants. | Can be used at half-strength for fungal cultivation [51]. |
| Dereplicator+ & NAP | Computational tools on GNPS for automated annotation of natural products. | Significantly speeds up the identification of known metabolites from MS/MS data [1]. |
| Solvents for Extraction | To extract a broad range of secondary metabolites from plant tissues. | Ethanol is effective for extracting polyphenols, including flavonoids and stilbenoids [1]. |
Within the context of Orchidaceae metabolomics research, benchmarking natural product activity against established synthetic azoles provides a critical framework for evaluating therapeutic potential and identifying synergistic partnerships. Synthetic azoles, such as fluconazole and voriconazole, represent the most successful class of antifungals, targeting the synthesis of ergosterol, an essential component of the fungal cell membrane [76] [77]. Their primary mechanism involves the inhibition of lanosterol 14α-demethylase, a fungal cytochrome P450 enzyme (encoded by ERG11), thereby disrupting membrane integrity and function [78] [79]. However, the utility of this drug class is increasingly compromised by the emergence of resistance, driven by the widespread prophylactic and agricultural use of azoles [76]. Key resistance mechanisms include upregulation of efflux pumps (e.g., CDR1 and CDR2), mutations in the ERG11 target gene, and overexpression of major facilitator transporters [77] [80].
Consequently, research has pivoted towards augmenting azoles through synergistic interactions with secondary compounds to expand the antifungal arsenal, resensitize resistant strains, and reduce effective dosages [76] [81]. LC-HRMS-based metabolomics of plant families like Orchidaceae offers a powerful discovery platform for such synergistic natural products [1] [4]. This Application Note details protocols for profiling Orchidaceae extracts, benchmarking their activity and synergy with azoles against fungal pathogens, and elucidating their mechanisms of action within this strategic framework.
Azole Antifungals: A Benchmark for Comparison
Classification and Clinical Applications
Synthetic azoles are categorized into imidazoles (two nitrogen atoms in the azole ring) and triazoles (three nitrogen atoms), with the latter demonstrating improved safety profiles and a broader spectrum of activity [79] [80]. Table 1 summarizes the common synthetic azoles, their primary applications, and key pharmacokinetic properties essential for experimental design.
Table 1: Key Synthetic Azole Antifungals: Applications and Pharmacokinetic Properties
| Azole (Class) | Common Clinical Indications | Key Pharmacokinetic Properties & Administration Notes |
|---|---|---|
| Fluconazole (Triazole) | Candidiasis, cryptococcosis, prophylaxis [78] [79] | >90% oral bioavailability; CSF penetration ~50-90%; primarily renal excretion; minimal protein binding [78] [80]. |
| Itraconazole (Triazole) | Aspergillosis, blastomycosis, histoplasmosis, onychomycosis [78] [79] | Absorption enhanced by food and low gastric pH; highly protein-bound (>95%); extensive hepatic metabolism to active metabolite [78] [79]. |
| Voriconazole (Triazole) | Invasive aspergillosis, serious Candida infections, seedsosporiosis [78] [79] | Nonlinear pharmacokinetics; therapeutic drug monitoring recommended; high CSF penetration [78] [80]. |
| Posaconazole (Triazole) | Prophylaxis in immunocompromised, oropharyngeal candidiasis refractory to other azoles [78] [79] | Absorption significantly improved with high-fat meal; highly protein-bound [78] [80]. |
| Ketoconazole (Imidazole) | Topical for cutaneous candidiasis, dermatophytosis (systemic use limited) [78] [79] | Systemic use restricted due to hepatotoxicity; requires gastric acidity for absorption [79]. |
| Miconazole/Clotrimazole (Imidazole) | Topical and mucosal candidiasis, dermatophytosis [76] [79] | Primarily for topical application; minimal systemic absorption [79]. |
Mechanisms of Action and Resistance
The fungistatic action of azoles stems from the inhibition of lanosterol 14α-demethylase, leading to a depletion of ergosterol and accumulation of toxic methylated sterol precursors in the fungal cell membrane [77] [80]. This compromises membrane fluidity and the function of membrane-associated enzymes, ultimately inhibiting cell growth [78]. Resistance to azoles is a multifactorial problem, with major mechanisms outlined in Table 2.
Table 2: Primary Mechanisms of Azole Resistance in Fungal Pathogens
| Resistance Mechanism | Description | Key Examples |
|---|---|---|
| Target Site Alteration | Mutations in the ERG11/CYP51 gene prevent effective azole binding without critically impairing enzyme function [76] [77]. | Common in Candida albicans and Aspergillus fumigatus [77]. |
| Efflux Pump Overexpression | Increased expression of membrane transporters reduces intracellular drug accumulation. ABC transporters (e.g., CDR1, CDR2) and major facilitator superfamily (MFS) pumps are implicated [76] [80]. | Prevalent in Candida glabrata and emerging in C. auris [76] [82]. |
| Biofilm Formation | Production of an extracellular matrix provides a physical barrier and creates a tolerant metabolic state, significantly reducing azole susceptibility [82] [77]. | Major factor in Candida spp. associated with medical devices and recurrent infections [82]. |
| Genomic Plasticity | Aneuploidy and rapid karyotype changes enable quick adaptation and resistance development, particularly in emerging pathogens [76]. | Observed in multi-drug resistant Candida auris outbreaks [76] [82]. |
Experimental Protocols for Synergy Screening
Protocol 1: LC-HRMS Metabolomic Profiling of Orchidaceae Extracts
Objective: To comprehensively characterize the secondary metabolome of Orchidaceae extracts for the identification of potential antifungal and azole-synergizing compounds.
Materials and Reagents:
- Plant Material: Healthy and fungal-infected specimens of Vanda and Cattleya genera [1] [4].
- Extraction Solvent: Ethanol (HPLC grade) [1] [4].
- LC-HRMS/MS System: Ultra-high-performance liquid chromatography system coupled to a high-resolution tandem mass spectrometer (e.g., Orbitrap) [1] [4].
- Chromatography Column: Reversed-phase C18 column (e.g., 2.1 x 100 mm, 1.8 µm) [4].
- Data Analysis Software: MS data processing software (e.g., MZmine), molecular networking platforms (GNPS), and in silico fragmentation tools (Dereplicator+, SIRIUS) [1] [4].
Procedure:
- Extraction: Homogenize 100 mg of lyophilized plant tissue with 1 mL of ethanol. Sonicate for 30 minutes and centrifuge at 14,000 × g for 10 minutes. Collect the supernatant and lyophilize. Reconstitute the dried extract in methanol to a final concentration of 1 mg/mL for LC-HRMS analysis [1] [4].
- LC-HRMS/MS Analysis:
- Chromatography: Inject 5 µL of sample. Use a binary mobile phase: (A) 0.1% formic acid in water and (B) 0.1% formic acid in acetonitrile. Apply a linear gradient from 5% B to 100% B over 30 minutes at a flow rate of 0.3 mL/min [4].
- Mass Spectrometry: Acquire data in positive and negative electrospray ionization (ESI) modes. Full MS scans should be acquired at a resolution of ≥120,000. Data-dependent MS/MS (dd-MS2) should be triggered for the top 10 most intense ions per cycle, with a normalized collision energy of 30 eV [1] [4].
- Data Processing and Metabolite Annotation:
- Convert raw data to an open format (e.g., .mzML). Perform peak picking, alignment, and gap filling to create a feature table (mass, retention time, intensity).
- Submit the MS/MS data to the Global Natural Products Social Molecular Networking (GNPS) platform for classical molecular networking. Use a cosine score threshold of 0.7 and minimum matched peaks of 6 [1] [4].
- Annotate metabolites by searching MS/MS spectra against reference libraries (e.g., GNPS, EMBL-MCF) and using in silico fragmentation tools. Prioritize annotations with high spectral similarity (cosine score > 0.9) and mass error < 5 ppm [1] [4].
- Focus on chemical classes known from Orchidaceae and relevant to antifungal defense, such as stilbenoids (e.g., orchinol, hircinol), flavonoids, and phenolic acids [1] [4].
Protocol 2: Checkerboard Assay for Azole Synergy
Objective: To quantitatively evaluate the synergistic interaction between Orchidaceae metabolites and synthetic azoles against target fungal pathogens.
Materials and Reagents:
- Test Compounds: Purified Orchidaceae metabolites or fractionated extracts; synthetic azole drugs (e.g., fluconazole, voriconazole).
- Fungal Strains: Clinically relevant strains, including azole-susceptible and azole-resistant isolates of Candida albicans, C. glabrata, and C. auris.
- Media: RPMI-1640 broth, buffered to pH 7.0 with 0.165 M MOPS.
- Equipment: 96-well microtiter plates, multichannel pipettes, automated plate reader.
Procedure:
- Preparation of Drug Solutions: Prepare stock solutions of the azole and the plant metabolite in the appropriate solvent (e.g., DMSO, ethanol), ensuring the final solvent concentration in the assay is ≤1%.
- Checkerboard Setup: In a 96-well plate, serially dilute the azole along the rows and the plant metabolite along the columns, creating a matrix where each well contains a unique combination of both compounds. Include wells for each compound alone and growth controls.
- Inoculation and Incubation: Dilute a fresh fungal suspension (0.5 McFarland standard) to a final concentration of 1-5 x 10³ CFU/mL in RPMI-1640. Add 100 µL of this suspension to each well. Seal the plate and incubate at 35°C for 24-48 hours without shaking.
- Assessment of Growth: Measure the optical density (OD) at 600 nm or use a resazurin-based viability stain to quantify fungal growth.
- Data Analysis: Calculate the Fractional Inhibitory Concentration (FIC) for each well.
- FIC of Azole (FICA) = (MIC of azole in combination) / (MIC of azole alone)
- FIC of Metabolite (FICB) = (MIC of metabolite in combination) / (MIC of metabolite alone)
- ΣFIC = FICA + FICB
- Interpret the ΣFIC as follows: ΣFIC ≤ 0.5 indicates synergy; >0.5 to ≤4 indicates no interaction (additivity/indifference); and >4 indicates antagonism.
Protocol 3: Investigating Mechanisms of Synergy
Objective: To delineate the molecular mechanism by which an Orchidaceae metabolite synergizes with an azole antifungal.
Procedure:
- Efflux Pump Inhibition Assay: Use fluorescent substrates like rhodamine 6G. Incubate yeast cells (including strains overexpressing efflux pumps like CDR1) with sub-inhibitory concentrations of the plant metabolite. Measure intracellular fluorescence accumulation with and without the metabolite using flow cytometry or a fluorometric plate reader. Increased fluorescence in the presence of the metabolite indicates inhibition of efflux activity [76] [82].
- Gene Expression Analysis via qRT-PCR: Treat fungal cells with the plant metabolite alone, azole alone, and their combination at sub-inhibitory concentrations. After a defined period (e.g., 2-4 hours), extract total RNA. Synthesize cDNA and perform qRT-PCR to measure the expression levels of key resistance genes (e.g., ERG11, CDR1, CDR2, MDR1). A significant downregulation of these genes by the metabolite would suggest a mechanism for reversing azole resistance [76].
- Biofilm Disruption Assay: Grow fungal biofilms in 96-well plates for 24-48 hours. Treat mature biofilms with the azole, plant metabolite, or combination. Quantify biofilm biomass using crystal violet staining or assess metabolic activity with the XTT reduction assay. Synergy is demonstrated when the combination reduces biofilm viability significantly more than either agent alone [82].
The Scientist's Toolkit: Research Reagent Solutions
Table 3: Essential Reagents and Tools for Antifungal Synergy Research
| Reagent / Tool | Function / Application |
|---|---|
| LC-HRMS/MS System (Orbitrap) | High-resolution metabolomic profiling for accurate mass measurement and structural annotation of novel metabolites [1] [4]. |
| GNPS (Global Natural Products Social) Platform | Cloud-based platform for mass spectrometry data sharing, molecular networking, and dereplication to rapidly annotate known compounds [1] [4]. |
| RPMI-1640 Medium (with MOPS) | Standardized, buffered culture medium for reliable and reproducible antifungal susceptibility testing [78]. |
| Resazurin Sodium Salt | Cell-permeant dye used as an indicator of metabolic activity in viability and cytotoxicity assays, including checkerboard and biofilm assays. |
| Rhodamine 6G | Fluorescent dye used as a substrate for efflux pumps (e.g., CDR1); essential for assessing efflux pump inhibition activity [82]. |
| SYBR Green qPCR Master Mix | For quantitative real-time PCR (qRT-PCR) to analyze transcriptional changes in fungal resistance genes upon treatment with synergistic partners [76]. |
Visualizing Workflows and Mechanisms
Experimental and Analytical Workflow
The following diagram outlines the integrated workflow from plant extract preparation to the identification of synergistic compounds.
Figure 1: Integrated workflow for the discovery and validation of azole synergists from Orchidaceae.
Mechanisms of Azole Resistance and Synergy
This diagram illustrates the primary resistance mechanisms fungi employ against azoles and the corresponding points where synergistic compounds from Orchidaceae can intervene.
Figure 2: Fungal azole resistance mechanisms and corresponding synergistic counter-strategies.
Within the context of Orchidaceae metabolomics for antifungal screening, the structural elucidation of bioactive compounds transitions from untargeted discovery to confident confirmation. Liquid Chromatography coupled to High-Resolution Tandem Mass Spectrometry (LC-HRMS/MS) serves as the cornerstone of this pipeline, enabling the rapid annotation of novel antifungal leads from complex plant extracts [1]. This application note details the integrated workflows and protocols for advancing compound identifications from putative annotations to confirmed structures, specifically focusing on the metabolic defense responses of Orchidaceae species against fungal pathogens. The precise elucidation of compounds like stilbenoids, flavonoids, and terpenoids—key to the plant's antimicrobial defense—is paramount for downstream drug development efforts [1].
Analytical Workflow for Metabolite Elucidation
The journey from a raw LC-HRMS/MS data file to a confidently identified metabolite involves a structured, multi-stage workflow. The following diagram outlines the critical steps and decision points in this process, from initial data acquisition to the final level of identification confidence.
Experimental Protocols
Sample Preparation and LC-HRMS/MS Analysis
This protocol is adapted from methodologies applied in the metabolomic assessment of Vanda and Cattleya genera [1].
- Reagents & Materials: Plant material (e.g., leaves, roots), liquid nitrogen, lyophilizer, analytical-grade ethanol (≥95%), ultrasonic bath, centrifuge, vacuum concentrator, UHPLC system, C18 reversed-phase column (e.g., 2.1 x 100 mm, 1.7 µm), Orbitrap-based mass spectrometer.
- Procedure:
- Homogenization: Flash-freeze plant tissue (e.g., 100 mg) in liquid nitrogen and homogenize to a fine powder using a mortar and pestle.
- Extraction: Add 1 mL of ethanol (70% v/v) to the powder. Sonicate the mixture for 20 minutes in an ultrasonic bath at room temperature.
- Clarification: Centrifuge the extract at 14,000 × g for 15 minutes at 4°C.
- Concentration: Transfer the supernatant to a new vial and concentrate to dryness using a vacuum concentrator.
- Reconstitution: Reconstitute the dried extract in 100 µL of methanol, vortex for 30 seconds, and centrifuge briefly before LC-MS analysis.
- LC Conditions: Inject 2 µL of the sample. Use a binary solvent system: (A) Water with 0.1% formic acid and (B) Acetonitrile with 0.1% formic acid. Apply a linear gradient from 5% to 95% B over 25 minutes at a flow rate of 0.3 mL/min. Maintain the column temperature at 40°C.
- MS Conditions: Acquire data in data-dependent acquisition (DDA) mode using an ESI source in positive ionization mode. Set the mass range to m/z 100–1500. Acquire full MS scans at a resolution of 120,000 (at m/z 200). Fragment the top 10 most intense ions per cycle using Higher-Energy Collisional Dissociation (HCD) at a normalized collision energy of 30 eV. Acquire MS/MS spectra at a resolution of 30,000.
Data Processing and Multi-Tool Annotation Strategy
Post-acquisition, raw data is processed through a suite of bioinformatic tools to enable comprehensive structural annotation [1].
- Software/Tools: MZmine 3, Global Natural Products Social Molecular Networking (GNPS), SIRIUS, CSI:FingerID.
- Procedure:
- Feature Detection: Process raw data files with MZmine 3 for peak picking, chromatographic deconvolution, alignment, and gap filling. Export a feature quantification table (.CSV) and an MS/MS spectral file (.MGF).
- Molecular Networking: Upload the .MGF file to the GNPS platform (https://gnps.ucsd.edu). Create a molecular network using the Feature-Based Molecular Networking (FBMN) workflow. Set the minimum cosine score for spectral similarity to 0.7 and the minimum matched fragment ions to 6.
- In-Silico Annotation: Use the DEREPLICATOR+ tool within GNPS to annotate peptides and other natural products. Further, process the data with SIRIUS to compute molecular formulas and use CSI:FingerID to predict compound classes and structures from MS/MS spectra.
- Annotation Propagation: Run the Network Annotation Propagation (NAP) and MolNetEnhancer workflows on GNPS to expand annotations across the molecular network and consolidate results from various in-silico tools.
Data Presentation and Interpretation
Key Metabolite Classes Identified in Orchidaceae
The application of the above workflow to Orchidaceae species reveals a diverse array of secondary metabolites. The following table summarizes the major classes of compounds putatively annotated and their significance in antifungal defense [1].
Table 1: Key Metabolite Classes Detected in Orchidaceae Extracts via LC-HRMS/MS
| Metabolite Class | Number of Annotated Compounds | Examples | Proposed Role in Antifungal Defense |
|---|---|---|---|
| Flavonoids | 35 | Flavones, Flavonols, Flavanones, Isoflavones | Direct antimicrobial activity; strengthening of plant cell walls [1]. |
| Stilbenoids | 10 | Orchinol, Hircinol | Phytoalexins with documented antifungal activity; induced in response to fungal infection [1]. |
| Phenolic Acids | 10 | Cinnamic acid derivatives | Precursors to lignin and other defensive compounds; antioxidant activity [1]. |
| Terpenoids | 20 | Diterpenoids, Sesquiterpenoids | Broad-spectrum antimicrobial and antifungal properties [1]. |
| Alkaloids | 8 | Tryptophan, Anthranilic acid derivatives | Bioactive compounds often involved in plant defense mechanisms [1]. |
The Scientist's Toolkit: Essential Research Reagents and Platforms
Successful implementation of the elucidation pipeline relies on a specific set of analytical tools and computational platforms.
Table 2: Research Reagent Solutions for LC-HRMS/MS Metabolomics
| Item | Function in the Workflow | Example / Specification |
|---|---|---|
| Orbitrap Mass Spectrometer | Provides high-resolution and high-mass-accuracy data for both precursor and fragment ions, enabling confident formula assignment. | Q-Exactive HF, Fusion Lumos [1]. |
| C18 UHPLC Column | Separates complex metabolite mixtures prior to MS analysis to reduce ionization suppression and isolate isobaric compounds. | 2.1 x 100 mm, 1.7 µm particle size [1]. |
| GNPS Platform | Open-access cloud platform for performing molecular networking, spectral library matching, and community-wide resource sharing. | https://gnps.ucsd.edu [1]. |
| SIRIUS Software | Computational tool for precisely determining molecular formulas and annotating compounds based on MS/MS fragmentation trees. | SIRIUS 5 [1]. |
| Natural Product Libraries | Curated spectral databases used for dereplication to quickly identify known compounds and avoid re-isolation. | GNPS spectral libraries, COSMOS, LOTUS [1]. |
Case Study: Metabolic Dynamic Assessment in Orchidaceae
The power of this workflow is demonstrated in a study comparing healthy and fungal-infected Orchidaceae plants. Molecular networking and chemometric analysis were used to discriminate ions that differentiated the sample groups [1]. The following diagram synthesizes the logical flow of this case study, from experimental design to lead identification.
The case study findings, derived from the referenced research, can be summarized as follows [1]:
- Induced Metabolites: Stilbenoids such as orchinol and hircinol were found to be synthesized dynamically in higher abundance in fungal-infected plants, confirming their role as inducible phytoalexins.
- Constitutive Defense Metabolites: A tricin derivative flavonoid and the terpenoid loliolide were exclusively detected in healthy plant samples, suggesting their potential role as pre-formed antifungal agents.
- Conclusion: LC-HRMS/MS, combined with state-of-the-art computational tools, proved to be a rapid and reliable technique for fingerprinting medicinal plants and discovering new hits and leads for antifungal compounds, directly enabling their structural elucidation from annotation to confirmation.
Evaluating the Potential for Drug Resistance Development to Novel Botanical Antifungals
The rising threat of invasive fungal infections, coupled with increasing resistance to conventional antifungal drugs, has necessitated the exploration of novel therapeutic agents [83] [84]. Fungal pathogens cause more than 1.5 million deaths globally each year, with mortality rates for invasive infections often exceeding 40% despite available treatment [84] [85]. The clinical antifungal arsenal is limited to three major drug classes—azoles, polyenes, and echinocandins—all of which face challenges including host toxicity, unfavorable pharmacokinetics, and the emergence of resistance [83] [86] [85].
Medicinal plants, particularly members of the Orchidaceae family, represent a promising source of novel antifungal compounds due to their diverse and specialized metabolomes [44] [1] [87]. These plants produce a wide array of bioactive phytochemicals, including stilbenoids, flavonoids, phenolic acids, and terpenoids, which exhibit potent antimicrobial activity through multiple mechanisms of action [44] [1] [87]. However, the potential for fungi to develop resistance to these botanical antifungals remains a critical concern that must be systematically evaluated during drug development.
This Application Note provides detailed protocols for assessing resistance development to novel botanical antifungals discovered through Orchidaceae metabolomics research. By implementing these methodologies, researchers can identify compounds with lower resistance potential and elucidate resistance mechanisms early in the drug discovery pipeline.
Key Resistance Mechanisms in Fungal Pathogens
Understanding established resistance mechanisms to conventional antifungals provides a critical framework for evaluating potential resistance to novel botanical compounds. Fungal pathogens employ diverse strategies to evolve resistance, which can be broadly categorized as follows:
Molecular Resistance Mechanisms
Table 1: Major Antifungal Resistance Mechanisms in Pathogenic Fungi
| Resistance Mechanism | Antifungal Class Affected | Key Genetic Alterations | Clinical Impact |
|---|---|---|---|
| Drug target alteration | Azoles, Echinocandins | ERG11/cyp51A mutations (azoles); FKS1/FKS2 mutations (echinocandins) | Reduced drug binding affinity; cross-resistance within drug classes [84] [85] |
| Drug target overexpression | Azoles | UPC2 gain-of-function mutations; cyp51A promoter tandem repeats | Increased target abundance requiring higher drug concentrations [84] [85] |
| Enhanced drug efflux | Azoles | Gain-of-function mutations in TAC1, MRR1 regulating CDR1, CDR2, MDR1 | Reduced intracellular drug accumulation [84] [85] |
| Cellular stress response activation | Azoles, Echinocandins | Calcineurin, Hsp90, PKC pathway alterations; compensatory chitin synthesis | Enhanced survival despite drug-induced stress [84] [85] |
| Biofilm formation | Multiple classes | Upregulation of matrix components, efflux pumps | Physical barrier and enhanced tolerance [83] [87] |
| Genomic plasticity | Multiple classes | Aneuploidies (e.g., chromosome 5L in C. albicans); hypermutator phenotypes | Rapid adaptation through increased mutation rates [84] [85] |
Visualizing Antifungal Resistance Pathways
The following diagram illustrates the primary molecular mechanisms that pathogenic fungi employ to develop resistance to antifungal agents, providing a conceptual framework for evaluating resistance to novel compounds.
Experimental Protocols for Resistance Assessment
Orchidaceae Metabolome Extraction and LC-HRMS Analysis
Principle: Comprehensive metabolomic profiling of Orchidaceae species using Liquid Chromatography-High Resolution Mass Spectrometry (LC-HRMS) enables the detection and annotation of bioactive compounds with antifungal properties [44] [1]. This protocol facilitates the discovery of novel antifungal candidates from plant extracts.
Materials:
- Plant material: Healthy and fungal-infected specimens of Vanda and Cattleya genera
- Extraction solvent: Ethanol (analytical grade)
- Equipment: Ultrasonicator, centrifuge, lyophilizer
- LC-HRMS system: Orbitrap mass spectrometer coupled to UHPLC system
- Chromatography: C18 column (2.1 × 100 mm, 1.8 μm)
- Mobile phases: (A) 0.1% formic acid in water; (B) 0.1% formic acid in acetonitrile
Procedure:
- Sample Preparation:
- Lyophilize plant tissues (leaves, roots) and pulverize to fine powder.
- Weigh 100 mg of powder and extract with 10 mL of ethanol using ultrasonication (40 kHz, 30°C) for 30 minutes.
- Centrifuge at 10,000 × g for 10 minutes and collect supernatant.
- Evaporate under nitrogen stream and reconstitute in 1 mL methanol for LC-HRMS analysis.
LC-HRMS Analysis:
- Column temperature: 40°C
- Injection volume: 5 μL
- Flow rate: 0.3 mL/min
- Gradient program: 5% B (0-2 min), 5-100% B (2-30 min), 100% B (30-35 min), 100-5% B (35-36 min), 5% B (36-40 min)
- MS parameters: ESI positive and negative mode; resolution: 70,000; scan range: m/z 100-1500
Data Processing:
Quality Control:
- Include pooled quality control (QC) samples from all extracts.
- Monitor retention time shift and mass accuracy drift throughout sequence.
- Annotate compounds following Metabolomics Standards Initiative (MSI) level 2 confidence [1].
Serial Passage Resistance Induction Protocol
Principle: Sequential exposure of fungal pathogens to sub-inhibitory concentrations of botanical antifungals selects for resistant populations, allowing assessment of resistance development potential [84] [85].
Materials:
- Fungal strains: Candida albicans (ATCC 90028), Aspergillus fumigatus (ATCC 204305)
- Culture media: RPMI-1640 with MOPS, Sabouraud Dextrose Broth
- Antifungal agents: Crude Orchidaceae extracts, purified bioactive compounds
- Reference drugs: Fluconazole, amphotericin B, caspofungin
- Equipment: Microdilution trays, automated plate reader, colony counter
Procedure:
- Initial MIC Determination:
- Prepare fungal inocula adjusted to 1-5 × 10³ CFU/mL (yeasts) or 0.4-5 × 10⁴ CFU/mL (molds) following CLSI M38 and M27 guidelines.
- Perform broth microdilution assays with twofold serial dilutions of test compounds.
- Incubate at 35°C for 24-48 hours (yeasts) or 48 hours (molds).
- Determine Minimum Inhibitory Concentration (MIC) as the lowest concentration showing ≥50% growth inhibition.
Serial Passage:
- Start with cultures at 0.5× MIC of botanical antifungal.
- Passage fungi every 48-72 hours into fresh medium containing the same concentration.
- Once growth equivalent to drug-free control is observed, increase concentration in twofold increments.
- Continue process for 30 passages, storing aliquots at -80°C at each passage.
Monitoring Resistance Development:
- Every 5 passages, determine MIC against the selective agent and reference antifungals.
- Calculate fold change in MIC relative to baseline.
- Isolate single colonies for further characterization from passages showing ≥4-fold MIC increase.
Fitness Cost Assessment:
- Compare growth rates of resistant isolates and parental strains in drug-free medium.
- Perform competition assays by co-culturing resistant and susceptible strains.
- Evaluate virulence attributes (hyphal formation, biofilm production, enzyme secretion).
Mechanism-Specific Resistance Assays
Principle: Elucidate the molecular mechanisms underlying resistance to botanical antifungals through targeted assays evaluating efflux, target site, and compensatory pathways [84] [85].
Efflux Pump Activation Assay:
- Intracellular Drug Accumulation:
- Incubate mid-log phase fungal cells with botanical antifungal at 0.5× MIC.
- Harvest cells at timed intervals (15, 30, 60, 120 minutes).
- Quantify intracellular drug concentration using LC-MS/MS.
- Compare accumulation between resistant mutants and parental strains.
- Efflux Pump Inhibition:
- Repeat MIC determinations in presence of efflux pump inhibitors (20 μg/mL verapamil for MDR pumps; 10 μM FK520 for ABC transporters).
- ≥4-fold reduction in MIC in presence of inhibitor indicates efflux-mediated resistance.
Genomic Analysis of Resistant Mutants:
- Whole Genome Sequencing:
- Extract genomic DNA from parental and resistant strains using standardized protocols.
- Prepare sequencing libraries (Illumina NovaSeq, 150 bp paired-end).
- Map reads to reference genomes using BWA-MEM.
- Identify single nucleotide polymorphisms, insertions/deletions, and copy number variations.
- Transcriptomic Profiling:
- Isolate total RNA from fungi grown with and without sub-MIC botanical antifungal.
- Prepare RNA-seq libraries and sequence on Illumina platform.
- Perform differential gene expression analysis using DESeq2.
- Focus on genes involved in: ergosterol biosynthesis, cell wall organization, drug transport, stress response.
Table 2: Analytical Methods for Resistance Mechanism Elucidation
| Method | Application | Key Parameters | Data Interpretation |
|---|---|---|---|
| LC-HRMS metabolomics | Compound identification and quantification | Retention time, accurate mass, MS/MS fragmentation | Structural annotation through spectral matching [44] [1] |
| Broth microdilution | MIC determination | Growth inhibition endpoints | Fold-change relative to baseline and control strains [83] [85] |
| Whole genome sequencing | Mutation identification | Coverage depth, variant calling | Nonsynonymous mutations in candidate resistance genes [84] |
| RNA sequencing | Expression profiling | Differential gene expression | Pathway enrichment in resistant mutants [84] [85] |
| Efflux inhibition assays | Efflux pump activity | MIC shift with inhibitors | Classification of resistance mechanisms [85] |
Data Analysis and Interpretation
Resistance Risk Assessment Framework
Quantitative Resistance Potential Scoring: Develop a standardized scoring system to evaluate the resistance potential of novel botanical antifungals:
- Resistance Frequency: <10⁻⁹ (low risk); 10⁻⁹-10⁻⁷ (moderate risk); >10⁻⁷ (high risk)
- Rate of MIC Increase: <2-fold after 20 passages (low risk); 2-8 fold (moderate risk); >8-fold (high risk)
- Cross-Resistance Profile: No cross-resistance (low risk); cross-resistance to one drug class (moderate risk); cross-resistance to multiple classes (high risk)
- Fitness Cost of Resistance: Severe fitness defect (low risk); moderate fitness cost (moderate risk); minimal fitness cost (high risk)
Table 3: Comparative Resistance Profiles of Antifungal Classes
| Antifungal Category | Resistance Frequency | Primary Resistance Mechanisms | Typical Time to Resistance Emergence |
|---|---|---|---|
| Azoles (Fluconazole) | 10⁻⁶-10⁻⁸ | ERG11 mutations, efflux upregulation, biofilm formation | Months to years [83] [84] |
| Echinocandins (Caspofungin) | 10⁻⁷-10⁻⁹ | FKS1/FKS2 mutations, compensatory chitin synthesis | Months [84] [85] |
| Polyenes (Amphotericin B) | <10⁻¹⁰ | Altered membrane sterol composition | Rare in clinical settings [85] |
| Botanical Antifungals (Orchidaceae) | To be determined | Multiple targets predicted (membrane, cell wall, mitochondria) | Data limited; requires systematic study [44] [87] |
Visualization of Resistance Assessment Workflow
The following diagram outlines the integrated experimental workflow for evaluating resistance development to botanical antifungals, from initial discovery to mechanism elucidation.
The Scientist's Toolkit: Research Reagent Solutions
Table 4: Essential Materials for Antifungal Resistance Research
| Category | Specific Items | Application Purpose | Key Considerations |
|---|---|---|---|
| Chromatography & MS | UHPLC system with C18 column; Orbitrap mass spectrometer | Metabolite separation and identification | High resolution (>70,000) for accurate mass determination [44] [1] |
| Bioinformatics Tools | GNPS, Dereplicator+, SIRIUS, MZmine | Metabolite annotation and data processing | Spectral library matching and in silico fragmentation prediction [44] [1] |
| Reference Antifungals | Fluconazole, amphotericin B, caspofungin | Control compounds for resistance comparison | CLSI-recommended quality control strains and ranges [83] [85] |
| Fungal Strains | C. albicans SC5314, A. fumigatus AF293 | Standardized susceptibility testing | Well-characterized genomes and drug susceptibility profiles [84] [85] |
| Efflux Inhibitors | Verapamil, FK520, reserpine | Mechanism of resistance studies | Solubility limitations; potential intrinsic antifungal activity [85] |
| Molecular Biology | RNA extraction kits, sequencing library prep | Genomic and transcriptomic analysis | Quality control for fungal cell wall disruption [84] |
Concluding Remarks
The systematic evaluation of resistance potential is a critical component in the development of novel botanical antifungals from Orchidaceae species. The integrated protocols presented in this Application Note enable comprehensive assessment of resistance development, elucidation of underlying mechanisms, and strategic prioritization of candidate compounds with favorable resistance profiles.
Implementation of this framework early in the drug discovery pipeline will facilitate the identification of promising antifungal agents with lower propensity for resistance development, ultimately contributing to more sustainable antifungal therapies. Future directions should include the exploration of combination therapies leveraging synergistic interactions between botanical compounds and conventional antifungals to suppress resistance emergence [88] [87].
The application of advanced LC-HRMS-based metabolomics, combined with systematic resistance evaluation, positions Orchidaceae-derived compounds as valuable candidates for addressing the critical public health threat of antifungal resistance.
Conclusion
LC-HRMS-based metabolomics has proven to be an indispensable and powerful strategy for unlocking the antifungal potential of the Orchidaceae family. By integrating foundational knowledge, robust methodological workflows, optimized troubleshooting approaches, and rigorous validation, this field efficiently bridges the gap from plant chemical ecology to drug discovery. The synthesis of research confirms that orchids produce a diverse array of defensive secondary metabolites, such as stilbenoids and specialized flavonoids, whose production is dynamically regulated in response to fungal challenge. Future directions should focus on the scaling-up and clinical translation of these LC-HRMS-annotated hits, the further integration of multi-omics data to engineer biosynthetic pathways, and the exploration of synergistic effects within complex metabolite mixtures. This approach holds significant promise for addressing the growing global challenge of antifungal resistance.
References
- 1. LC-HRMS/MS-Based Metabolomics Approaches Applied ... [https://www.mdpi.com/1420-3049/27/22/7937]
- 2. Centenary Progress on Orchidaceae Research: A Bibliometric ... [https://pmc.ncbi.nlm.nih.gov/articles/PMC11942143/]
- 3. Identification, Biological Function Profiling and Biosynthesis of ... [https://pmc.ncbi.nlm.nih.gov/articles/PMC10385179/]
- 4. LC-HRMS/MS-Based Metabolomics Approaches Applied to ... [https://pmc.ncbi.nlm.nih.gov/articles/PMC9692279/]
- 5. Integrated transcriptomic and metabolomic analyses reveal ... [https://bmcplantbiol.biomedcentral.com/articles/10.1186/s12870-025-06176-8]
- 6. Integrative Analysis of Nontargeted LC-HRMS and High ... [https://pmc.ncbi.nlm.nih.gov/articles/PMC12163877/]
- 7. A comprehensive review on fungal endophytes and its ... [https://pmc.ncbi.nlm.nih.gov/articles/PMC6682353/]
- 8. Cultivable fungal community associated with the tropical ... [https://www.sciencedirect.com/science/article/pii/S1754504822000198]
- 9. Stilbenes: Emerging Applications in Health, Agriculture, ... [https://www.intechopen.com/chapters/1219078]
- 10. In Memoriam: Professor Philippe Jeandet - PubMed Central [https://pmc.ncbi.nlm.nih.gov/articles/PMC12550670/]
- 11. A Comprehensive Review of Biological Properties ... [https://www.mdpi.com/2076-3417/15/19/10840]
- 12. Biotechnological production of terpenoids using cell factories [https://www.frontiersin.org/journals/pharmacology/articles/10.3389/fphar.2025.1621406/full]
- 13. Advances in the microbial biosynthesis of therapeutic ... [https://www.sciencedirect.com/science/article/abs/pii/S0958166925001181]
- 14. Structural diversity and biological activities of terpenoids ... [https://pubs.rsc.org/en/content/articlehtml/2025/ra/d4ra09048a]
- 15. LC-MS/MS Tandem Mass Spectrometry for Analysis ... [https://pmc.ncbi.nlm.nih.gov/articles/PMC5745480/]
- 16. Therapeutic orchids: traditional uses and recent advances [https://www.sciencedirect.com/science/article/abs/pii/S0367326X1000242X]
- 17. Traditional, Therapeutic Uses and Phytochemistry of ... [https://pmc.ncbi.nlm.nih.gov/articles/PMC9863304/]
- 18. The Use of Orchids in Medicine [https://www.justaddiceorchids.com/Just-Add-Ice-Orchid-Blog/bid/95356/The-Use-of-Orchids-in-Medicine]
- 19. Antinociceptive effects of Laelia anceps Lindl. and ... [https://www.sciencedirect.com/science/article/abs/pii/S0378874122002100]
- 20. Integration of fungal transcriptomics and metabolomics ... [https://pubmed.ncbi.nlm.nih.gov/39456087/]
- 21. Integrated analysis of transcriptomics and metabolomics of ... [https://www.nature.com/articles/s41598-025-93889-3]
- 22. MEANtools integrates multi-omics data to identify metabolites ... [https://journals.plos.org/plosbiology/article?id=10.1371/journal.pbio.3003307]
- 23. Multi-omics analyses reveal regulatory networks ... [https://www.nature.com/articles/s41467-025-65299-6]
- 24. Transcriptomic and metabolomic study of the biosynthetic ... [https://bmcplantbiol.biomedcentral.com/articles/10.1186/s12870-025-06239-w]
- 25. Untargeted Metabolomics Analysis of the Orchid Species ... [https://www.mdpi.com/2223-7747/12/3/655]
- 26. Mass Spectrometry-Based Untargeted Metabolomics ... [https://pmc.ncbi.nlm.nih.gov/articles/PMC9951240/]
- 27. Optimization of Sample Preparation for Metabolomics ... [https://pmc.ncbi.nlm.nih.gov/articles/PMC8305469/]
- 28. Optimization of metabolomic data processing using NOREVA [https://www.nature.com/articles/s41596-021-00636-9]
- 29. LC-HRMS/MS-Based Metabolomics Approaches Applied ... [https://www.semanticscholar.org/paper/LC-HRMS-MS-Based-Metabolomics-Approaches-Applied-to-Lima-Lima/4c183f1228349bd9fc2cbf26cec5fe387d869966]
- 30. Metabolomic analysis of Cyrtopodium glutiniferum extract ... [https://www.sciencedirect.com/science/article/pii/S0378874119347312]
- 31. Comparative metabolomic analysis provides insights into the ... [https://bmcplantbiol.biomedcentral.com/articles/10.1186/s12870-025-06054-3]
- 32. Comparison of the Metabolomics of Different Dendrobium ... [https://www.mdpi.com/1422-0067/24/24/17148]
- 33. Guide to Metabolomics Analysis: A Bioinformatics Workflow [https://pmc.ncbi.nlm.nih.gov/articles/PMC9032224/]
- 34. Visualizing Metabolomics Data: Graphical Insights [https://metabolomics.creative-proteomics.com/resource/visualizing-metabolomics-data-graphical-insights.htm]
- 35. Propagating annotations of molecular networks using in ... [https://pmc.ncbi.nlm.nih.gov/articles/PMC5927460/]
- 36. Molecular Networking: A Useful Tool for the Identification of ... [https://www.frontiersin.org/journals/chemistry/articles/10.3389/fchem.2020.572952/full]
- 37. Molecular Networking - GNPS Documentation - GitHub Pages [https://ccms-ucsd.github.io/GNPSDocumentation/networking/]
- 38. Dereplication of microbial metabolites through database search of mass spectra | Nature Communications [https://www.nature.com/articles/s41467-018-06082-8]
- 39. Dereplication of peptidic natural products through database search of mass spectra - PMC [https://pmc.ncbi.nlm.nih.gov/articles/PMC5409158/]
- 40. Critical review on in silico methods for structural annotation of ... [https://pmc.ncbi.nlm.nih.gov/articles/PMC11700063/]
- 41. Comprehensive comparison of in silico MS/MS fragmentation ... [https://jcheminf.biomedcentral.com/articles/10.1186/s13321-017-0219-x]
- 42. Dereplication of secondary metabolites from Sophora flavescens using an LC–MS/MS-based molecular networking strategy | Scientific Reports [https://www.nature.com/articles/s41598-025-94958-3]
- 43. Reproducible MS/MS library cleaning pipeline in matchms [https://jcheminf.biomedcentral.com/articles/10.1186/s13321-024-00878-1]
- 44. LC-HRMS/MS-Based Metabolomics Approaches Applied ... [https://pubmed.ncbi.nlm.nih.gov/36432039/]
- 45. Practical Guide to Metabolomics [https://www.thermofisher.com/us/en/home/industrial/mass-spectrometry/mass-spectrometry-learning-center/mass-spectrometry-applications-area/metabolomics-mass-spectrometry/practical-guide-metabolomics.html]
- 46. Protocol for analysis of liquid chromatography-mass ... [https://www.sciencedirect.com/science/article/pii/S2666166723000953]
- 47. Ion suppression correction and normalization for non- ... [https://www.nature.com/articles/s41467-025-56646-8]
- 48. LC-HRMS method for study of pharmaceutical uptake in ... [https://pmc.ncbi.nlm.nih.gov/articles/PMC10482775/]
- 49. Ion chromatography coupled to high-resolution mass ... [https://www.sciencedirect.com/science/article/pii/S0048969723027912]
- 50. LC-HRMS-based metabolomics to evaluate the ... [https://www.sciencedirect.com/science/article/pii/S1878535223005270]
- 51. Interaction With Fungi Promotes the Accumulation of ... [https://www.frontiersin.org/journals/plant-science/articles/10.3389/fpls.2022.757852/full]
- 52. Complementary methods for structural assignment of isomeric ... [https://link.springer.com/article/10.1007/s00216-023-04852-y]
- 53. Development and validation of a simple, sensitive ... [https://www.sciencedirect.com/science/article/pii/S1878535222003549]
- 54. An optimized - LC untargeted metabolomics... | PLOS One HRMS [https://journals.plos.org/plosone/article?id=10.1371/journal.pone.0260354]
- 55. Analysis with Supercritical Fluid... Optimizing Polyphenol [https://www.chromatographyonline.com/view/optimizing-polyphenol-analysis-with-supercritical-fluid-chromatography]
- 56. Untargeted Metabolite Profiling of Wild and In Vitro ... [https://pmc.ncbi.nlm.nih.gov/articles/PMC11507973/]
- 57. The metabolomics standards initiative (MSI) [https://link.springer.com/article/10.1007/s11306-007-0070-6]
- 58. GitHub - MSI-Metabolomics-Standards-Initiative/CIMR [https://github.com/MSI-Metabolomics-Standards-Initiative/CIMR]
- 59. Proposed minimum reporting standards for chemical ... [https://pmc.ncbi.nlm.nih.gov/articles/PMC3772505/]
- 60. A decade after the metabolomics standards initiative it's ... [https://www.nature.com/articles/sdata2017138]
- 61. Compliance with minimum information guidelines in public ... [https://www.nature.com/articles/sdata2017137]
- 62. Integrating non-target analysis and machine learning [https://www.nature.com/articles/s41545-025-00504-z]
- 63. HPLC 2025 Preview: Prioritization Strategies in Non-Target ... [https://www.chromatographyonline.com/view/hplc-2025-preview-prioritization-strategies-in-non-target-screening-of-environmental-samples-by-chromatography-with-high-resolution-mass-spectrometry]
- 64. How Metabolomics Data Correction Reduces Experimental ... [https://www.iroatech.com/uncategorized/how-metabolomics-data-correction-minimizes-experimental-bias/]
- 65. MassCube improves accuracy for metabolomics data ... [https://www.nature.com/articles/s41467-025-60640-5]
- 66. Improving newborn screening accuracy through genome ... [https://pmc.ncbi.nlm.nih.gov/articles/PMC12628566/]
- 67. Bioassay- and metabolomics-guided screening of bioactive ... [https://pmc.ncbi.nlm.nih.gov/articles/PMC6936774/]
- 68. Recent developments in the rapid analysis of plants and tracking their bioactive constituents | Phytochemistry Reviews [https://link.springer.com/article/10.1007/s11101-009-9125-9]
- 69. Critical review on in silico methods for structural annotation of chemicals detected with LC/HRMS non-targeted screening | Analytical and Bioanalytical Chemistry [https://link.springer.com/article/10.1007/s00216-024-05471-x]
- 70. The Application of UHPLC-HRMS for Quality Control ... [https://pmc.ncbi.nlm.nih.gov/articles/PMC9201421/]
- 71. HR-LC-MS based profiling of phytochemicals from methanol extracts of leaves and bark of Myristica dactyloides Gaertn. from Western Ghats of Karnataka, India [https://jabonline.in/abstract.php?article_id=611&sts=2]
- 72. Dereplication of Natural Product Antifungals via Liquid ... [https://www.mdpi.com/1420-3049/30/1/77]
- 73. Identification of potential markers of elevated anticandidal ... [https://www.sciencedirect.com/science/article/pii/S0378874125004830]
- 74. Comparative metabolomic analysis provides insights into ... [https://pubmed.ncbi.nlm.nih.gov/39966726/]
- 75. Comparative proteomics and metabolomics unveil regional ... [https://www.sciencedirect.com/science/article/abs/pii/S0731708525004285]
- 76. Augmenting Azoles with Drug Synergy to Expand the ... [https://pmc.ncbi.nlm.nih.gov/articles/PMC9027798/]
- 77. Antifungal Agents: Mode of Action, Mechanisms ... [https://pmc.ncbi.nlm.nih.gov/articles/PMC88922/]
- 78. Antifungal Ergosterol Synthesis Inhibitors - StatPearls - NCBI [https://www.ncbi.nlm.nih.gov/books/NBK551581/]
- 79. Candidiasis Medication: Azole Antifungals, Glucan ... [https://emedicine.medscape.com/article/213853-medication]
- 80. Azoles for Use in Animals - Pharmacology [https://www.merckvetmanual.com/pharmacology/antifungal-agents/azoles-for-use-in-animals]
- 81. Augmenting Azoles with Drug Synergy to Expand the ... [https://pubmed.ncbi.nlm.nih.gov/35455479/]
- 82. Unveiling the mechanisms of synthetic compounds against ... [https://www.sciencedirect.com/science/article/pii/S2590257125000197]
- 83. Potential Strategies to Control the Risk of Antifungal ... [https://pmc.ncbi.nlm.nih.gov/articles/PMC10045400/]
- 84. Molecular mechanisms governing antifungal drug resistance [https://www.nature.com/articles/s44259-023-00007-2]
- 85. Antifungal Drug Resistance: Evolution, Mechanisms and Impact [https://pmc.ncbi.nlm.nih.gov/articles/PMC6135714/]
- 86. Next-generation antifungal drugs: Mechanisms, efficacy, ... [https://www.sciencedirect.com/science/article/pii/S2211383525004332]
- 87. The Potential of Medicinal Plants in Antifungal Drug ... [https://e-jmi.org/archive/detail/163?is_paper=y]
- 88. Efficacy of botanical antifungal and conventional ... [https://www.frontiersin.org/journals/pharmacology/articles/10.3389/fphar.2025.1635482/full]