High-Throughput Natural Products Analysis: Optimizing LC-MS Workflows for Drug Discovery
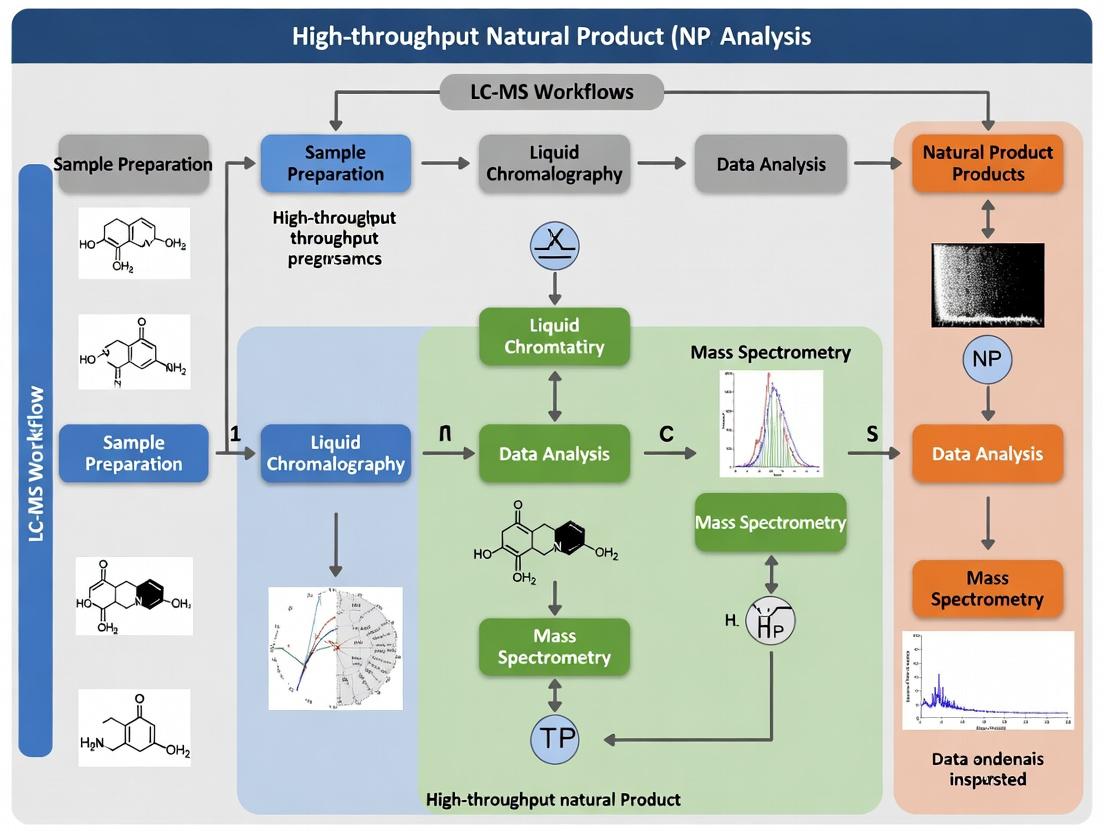
This article provides a comprehensive guide to Liquid Chromatography-Mass Spectrometry (LC-MS) workflows for high-throughput analysis of natural products (NPs).
High-Throughput Natural Products Analysis: Optimizing LC-MS Workflows for Drug Discovery
Abstract
This article provides a comprehensive guide to Liquid Chromatography-Mass Spectrometry (LC-MS) workflows for high-throughput analysis of natural products (NPs). Targeting researchers and drug development professionals, it covers the foundational principles of NP complexity, explores cutting-edge methodological approaches including UHPLC and high-resolution MS, details critical troubleshooting and optimization strategies for robust operation, and compares validation frameworks to ensure data reliability. The synthesis offers a practical roadmap for accelerating NP-based drug discovery.
The Challenge and Promise: Understanding NP Complexity for Effective LC-MS Analysis
Defining High-Throughput in the Context of Natural Product Screening
Within the broader thesis on LC-MS workflows for high-throughput Natural Product (NP) analysis, defining "high-throughput" is foundational. It is not merely about processing many samples, but about achieving a significant acceleration in the rate of discovery while maintaining data integrity and biological relevance. For NP screening, high-throughput is a multi-parameter concept encompassing speed, automation, miniaturization, data density, and informatics throughput.
Quantitative Benchmarks for High-Throughput NP Screening
Based on current literature and technological capabilities, the following quantitative benchmarks define the state of the art.
Table 1: Quantitative Benchmarks for High-Throughput NP Screening Workflows
| Parameter | Conventional Screening | High-Throughput Screening (HTS) | Ultra-High-Throughput Screening (uHTS) |
|---|---|---|---|
| Daily Sample Throughput | 10s - 100s | 10,000 - 100,000 | > 100,000 |
| Assay Volume | 100 - 1000 µL | 1 - 10 µL | < 1 µL (nano-scale) |
| LC-MS Cycle Time | 10 - 30 minutes | 1 - 5 minutes | < 1 minute (rapid-fire) |
| Data Points per Day | < 1,000 | > 100,000 | > 1,000,000 |
| Automation Level | Manual/Semi-automated | Fully automated (liquid handlers) | Integrated robotic platforms |
| Primary Readout | Single-target, low-content | Multi-parametric, medium-content | Complex, high-content (e.g., imaging) |
Application Notes & Protocols
Protocol: Automated 384-Well Sample Preparation for Crude Extracts
Objective: To standardize and accelerate the preparation of NP crude extracts for LC-MS analysis.
Materials: See "The Scientist's Toolkit" (Section 5).
Procedure:
- Plate Layout: Using laboratory information management system (LIMS) software, map sample IDs to positions in a 384-well polypropylene source plate.
- Automated Liquid Handling: a. Program a liquid handler to dispense 10 µL of each crude NP extract (in DMSO or methanol) from stock tubes into assigned wells. b. Add 190 µL of LC-MS starting mobile phase (e.g., 95:5 H₂O:ACN + 0.1% Formic Acid) to each well, achieving a 20-fold dilution. Mix via 5 aspiration/dispense cycles.
- Internal Standard Addition: Dispense 10 µL of a universal internal standard cocktail (e.g., stable isotope-labeled amino acids, lipids) to each well.
- Filtration/Centrifugation: Seal plate with a semi-permeable membrane mat. Centrifuge at 1000 x g for 2 minutes to remove particulates.
- Transfer: Using the liquid handler, transfer 150 µL from the source plate to a clean 384-well injection plate compatible with the LC-MS autosampler.
- Seal and Load: Seal the injection plate with a pierceable foil seal and load onto the LC-MS autosampler maintained at 10°C.
Protocol: Ultra-High-Throughput LC-MS Analysis with Short Gradients
Objective: To acquire high-quality MS1 and MS2 spectra for compound annotation at a cycle time of < 2 minutes.
LC Conditions:
- Column: 2.1 x 50 mm, 1.7 µm C18 (e.g., BEH or CSH).
- Mobile Phase: A: H₂O + 0.1% Formic Acid; B: Acetonitrile + 0.1% Formic Acid.
- Flow Rate: 0.6 mL/min.
- Gradient: 5% B to 95% B over 1.2 minutes, hold 0.3 minutes, re-equilibrate for 0.5 minutes (Total cycle: 2.0 min).
- Temperature: 45°C.
- Injection Volume: 1 µL (via partial loop with needle wash).
MS Conditions (Q-TOF or Orbitrap based):
- Ionization: ESI Positive/Negative switching (50 ms dwell per polarity).
- Mass Range: 100-1500 m/z.
- Resolution: ≥ 35,000 (at 200 m/z).
- Scan Rate: ~15 Hz.
- Data Acquisition: Data-Dependent Acquisition (DDA) with dynamic exclusion (exclude for 15 s after 2 spectra). Top 3 precursors per cycle.
- Collision Energies: Ramped (e.g., 20-40 eV).
Data Analysis Workflow:
- Feature Detection: Use software (e.g., MS-DIAL, MZmine 3) for peak picking, alignment, and deconvolution.
- Database Annotation: Query features (m/z, RT, MS2) against in-house and public NP databases (GNPS, COCONUT, NP Atlas).
- Activity Correlation: Integrate bioactivity data from parallel HTS assays to prioritize hits.
Workflow and Pathway Visualizations
Diagram Title: High-Throughput NP Screening LC-MS Workflow
Diagram Title: Informatics Pipeline for NP Screening Data
The Scientist's Toolkit: Research Reagent Solutions
Table 2: Essential Materials for High-Throughput NP Screening
| Item | Function & Rationale |
|---|---|
| 384-Well Polypropylene Plates | Chemically resistant plates for storing and processing organic solvent-based NP extracts. |
| Automated Liquid Handler (e.g., Hamilton STAR, Beckman Coulter Biomek) | For precise, high-speed transfer and dilution of samples, enabling reproducibility and miniaturization. |
| Pierceable Sealing Foils | Prevent sample evaporation and cross-contamination in autosampler trays. |
| LC-MS Grade Solvents (Acetonitrile, Methanol, Water) | Minimize background ions and system noise, ensuring high-quality MS data. |
| Universal MS Internal Standard Cocktail | A mix of stable isotope-labeled compounds across chemical classes to monitor system performance and normalize data. |
| Solid Phase Extraction (SPE) Microplates (e.g., 96-well format) | For rapid desalting or fractionation of complex crude extracts prior to LC-MS. |
| High-Speed UPLC Column (Sub-2µm particle, 2.1 x 50 mm) | Enables fast chromatographic separation (<2 min) without significant loss of resolution. |
| Tandem Mass Spectrometer (Q-TOF, Orbitrap) | Provides high-resolution, accurate mass data and fragmentation spectra essential for compound annotation. |
| Informatics Software Suite (e.g., MS-DIAL, Compound Discoverer, GNPS) | Critical for processing the massive datasets generated, from feature detection to annotation. |
Natural Product (NP) libraries represent a vast source of chemical diversity for drug discovery but pose significant analytical challenges that exceed the capabilities of standard LC-MS workflows. Within a high-throughput NP analysis research thesis, this necessitates the development of specialized methods. The inherent complexity of NP extracts—characterized by immense structural diversity, wide concentration ranges, and the presence of isomeric and polymeric compounds—demands optimized instrumentation, data acquisition strategies, and data processing pipelines to enable accurate annotation, dereplication, and biological activity correlation.
The table below quantifies the key challenges in NP analysis compared to synthetic compound libraries.
Table 1: Comparative Analysis of NP vs. Synthetic Library LC-MS Challenges
| Challenge Dimension | Typical Synthetic Library Range | Typical NP Library Range | Implication for LC-MS Method |
|---|---|---|---|
| Log P (Polarity) Diversity | Moderate (0 to 5) | Extremely Wide (-4 to >12) | Requires extended gradient and multiple column chemistries. |
| Molecular Weight Range | 200 - 600 Da | 100 - 3000+ Da | MS scan range and ion transmission must be broadly tuned. |
| Concentration Dynamic Range | ~3 orders of magnitude | Up to 6-8 orders of magnitude | Demands high dynamic range detectors and saturation avoidance. |
| Isomeric Complexity | Low to Moderate | Very High (e.g., glycosides, stereoisomers) | Needs high-resolution separation (UPLC, long gradients) & MS/MS specificity. |
| Ionization Efficiency Variance | Relatively Uniform | Highly Variable (non-polar terpenes vs. polar glycosides) | Mandates use of complementary ion sources (ESI, APCI) in parallel. |
| Sample Complexity (# of Features) | 10s - 100s per sample | 1000s - 10,000s per crude extract | Requires high peak capacity LC and fast MS scanning for sufficient data points. |
| Presence of Polymeric/Chlorophyll Interference | None | High (tannins, chlorophyll) | Needs specific clean-up protocols and MS conditions to avoid source contamination. |
Specialized Experimental Protocols
Protocol 2.1: Dual Ion Source LC-HRMS for Broad NP Coverage
This protocol is designed for the untargeted profiling of crude NP extracts.
I. Materials & Instrumentation
- LC System: Ultra-High-Performance Liquid Chromatograph (UHPLC) capable of 1000 bar.
- MS System: High-Resolution Mass Spectrometer (e.g., Q-TOF, Orbitrap) with switching capability between Electrospray Ionization (ESI) and Atmospheric Pressure Chemical Ionization (APCI) sources, or equipped with a dual source.
- Columns: (1) C18 reversed-phase (e.g., 2.1 x 100 mm, 1.7 µm), (2) HILIC (e.g., 2.1 x 150 mm, 1.7 µm).
- Solvents: LC-MS grade Water, Acetonitrile, Methanol; Formic Acid (0.1% v/v).
II. Methodology
- Sample Prep: Weigh 10 mg of dried plant extract. Dissolve in 1 mL of 80% methanol/water (v/v). Sonicate for 15 min, centrifuge at 14,000 rpm for 10 min. Filter supernatant through a 0.22 µm PTFE syringe filter.
- Reversed-Phase (RP) Analysis (ESI Positive/Negative Switching):
- Column: C18.
- Gradient: 5% to 100% Acetonitrile (0.1% FA) over 25 min, hold at 100% for 3 min, re-equilibrate. Flow: 0.4 mL/min.
- MS Parameters: Scan range m/z 100-1500. Capillary voltage: ±3.5 kV (positive/negative). Source temp: 150°C, desolvation temp: 500°C. Data-independent acquisition (DIA) mode: 4 alternating collision energies (e.g., 10 eV and 30-50 eV).
- HILIC Analysis (APCI Positive Mode for Non-Polar Compounds):
- Column: HILIC.
- Gradient: 95% to 50% Acetonitrile (0.1% FA) over 20 min. Flow: 0.35 mL/min.
- MS Parameters: APCI corona current: 4 µA. Vaporizer temp: 400°C. Scan range m/z 200-2000. DIA as above.
- Data Acquisition: Run each sample in RP-ESI(±) and HILIC-APCI(+) modes. Inject a quality control (QC) pooled sample every 10 injections.
Protocol 2.2: Micro-Scale Solid-Phase Extraction (SPE) for Targeted Fractionation Prior to LC-MS/MS
This protocol isolates compound classes to reduce complexity and enable targeted MS/MS.
I. Materials
- SPE Cartridges: Mixed-mode (e.g., C18/SCX, 10 mg cartridges).
- Solvents: Methanol, Water, Ammonium Hydroxide (2% v/v), Formic Acid (2% v/v).
- Vacuum Manifold.
II. Methodology
- Conditioning: Load cartridge with 1 mL methanol, then 1 mL water. Do not let dry.
- Loading: Apply 100 µL of crude NP extract (1 mg/mL in methanol). Allow to pass through slowly.
- Washing: Wash with 1 mL of water, then 1 mL of 20% methanol/water. Discard washes.
- Stepwise Elution: Elute into separate vials:
- Fraction A (Acidic/Neutral): 1 mL methanol with 2% formic acid.
- Fraction B (Basic): 1 mL methanol with 2% ammonium hydroxide.
- Fraction C (Very Non-polar): 1 mL dichloromethane/methanol (9:1).
- Analysis: Evaporate fractions under nitrogen, reconstitute in 50 µL methanol. Analyze via Protocol 2.1 with targeted MS/MS on precursor ions of interest.
Visualization of Workflows & Relationships
Diagram Title: Specialized LC-MS Workflow for NP Libraries
Diagram Title: NP Challenges Driving Specialized Method Needs
The Scientist's Toolkit: Key Research Reagent Solutions
Table 2: Essential Materials for Specialized NP LC-MS Analysis
| Item | Function & Rationale |
|---|---|
| Mixed-Mode SPE Micro-Cartridges (e.g., Oasis MCX/WAX) | Fractionates NPs by charge and hydrophobicity, drastically reducing sample complexity prior to LC-MS injection. |
| UHPLC Columns with Complementary Chemistries (C18, HILIC, PFP) | Provides orthogonal separation mechanisms to resolve isomers and compounds across the extreme polarity range of NPs. |
| LC-MS Grade Acid/Base Modifiers (Formic, Acetic, Ammonium Hydroxide) | Critical for controlling ionization in both ESI and APCI modes, influencing adduct formation and fragmentation patterns for annotation. |
| QC Reference Material (e.g., Defined Plant Extract) | A consistent, complex NP sample used to monitor system stability, reproducibility, and performance in untargeted profiling. |
| MS Calibration Solution (Wide m/z Range, e.g., up to 2000 Da) | Ensures mass accuracy across the broad molecular weight range typical of NPs (e.g., saponins, peptides). |
| In-Source Collision Energy (CE) Standard (e.g., Reserpine or Aglycone) | Used to optimize and standardize low/high CE switching in DIA methods for consistent fragmentation across runs. |
| Database Subscription (e.g., UNPD, COCONUT, GNPS) | Spectral libraries and NP-specific databases are essential for dereplication and putative annotation of complex MS/MS data. |
Core Components of an NP-Optimized LC-MS System
Within the context of a broader thesis on high-throughput natural product (NP) analysis, the Liquid Chromatography-Mass Spectrometry (LC-MS) system requires specialized optimization. NP libraries are characterized by immense chemical diversity, wide polarity ranges, and the presence of isomeric and low-abundance bioactive compounds. A standard LC-MS configuration is insufficient for comprehensive coverage. This application note details the core components of an NP-optimized LC-MS system, providing protocols for their evaluation and implementation to enhance throughput, sensitivity, and metabolite coverage in drug discovery pipelines.
Core Components and Performance Specifications
An NP-optimized LC-MS system integrates advanced separation and detection modules tailored to handle complex mixtures. The quantitative performance benchmarks for each core module are summarized below.
Table 1: Core Component Specifications for NP-Optimized LC-MS
| System Component | Recommended Specification | Key Performance Metric for NPs | Typical Target Value |
|---|---|---|---|
| Liquid Chromatography | UHPLC with 2D Capability | Peak Capacity (1D vs. 2D) | >400 (1D); >1500 (2D) |
| Analytical Column | C18, Polar-Embedded C18, HILIC | Peak Width (FWHM) | < 3 seconds |
| Mass Spectrometer | Q-TOF or Orbitrap | Mass Resolution @ m/z 200 | > 30,000 (TOF); > 60,000 (Orbitrap) |
| Mass Accuracy (RMS) | < 2 ppm | ||
| Dynamic Range | > 4 orders of magnitude | ||
| Ion Source | ESI and APCI Dual Source | Polarity Switching Speed | < 100 milliseconds |
| Data Acquisition | Data-Dependent (DDA) & Independent (DIA) | MS/MS Scan Rate | > 40 Hz (for DIA) |
| Software | NP-Specific Library & Workflow | Known NP Library Entries | > 50,000 compounds |
Detailed Experimental Protocols
Protocol 1: Assessing System Suitability for NP Extracts
This protocol validates the performance of the LC-MS system using a standard mixture of NPs spanning a wide logP range.
1. Materials:
- Standard Mixture: Prepare a 1 µg/mL solution in 50% methanol containing: digoxin (lipophilic), rutin (mid-polarity, glycosylated), citric acid (polar).
- Mobile Phase A: 0.1% Formic acid in water.
- Mobile Phase B: 0.1% Formic acid in acetonitrile.
- Column: Polar-embedded C18 (e.g., 150 x 2.1 mm, 1.7 µm).
- NP-Optimized LC-MS System.
2. Method:
- Chromatography: Flow rate: 0.4 mL/min. Gradient: 5% B to 95% B over 15 min. Column Temp: 40°C.
- Mass Spectrometry: ESI Positive/Negative switching. Full scan range: m/z 100-1500. Data-dependent MS/MS on top 5 ions per cycle.
- Injection Volume: 2 µL.
3. Data Analysis:
- Calculate peak asymmetry (should be 0.9-1.2 for all standards).
- Determine mass accuracy for the [M+H]+ or [M-H]- ions (< 3 ppm).
- Verify detection of all three disparate NPs in a single run.
Protocol 2: Implementing a Generic 2D-LC Method for Fraction Complexity Reduction
This protocol uses a heart-cutting 2D-LC approach to isolate a co-eluting region from a crude extract for cleaner MS/MS spectra.
1. Materials:
- Sample: Crude plant extract (e.g., Hypericum perforatum), 10 mg/mL in methanol.
- 1D Column: C18 (150 x 1.0 mm, 1.7 µm).
- 2D Column: Phenyl-Hexyl (50 x 2.1 mm, 1.8 µm).
- Mobile Phases: As in Protocol 1.
2. Method:
- 1D Separation: Run a shallow gradient (20% B to 50% B in 20 min) at 0.05 mL/min. Monitor by UV at 254 nm.
- Heart-Cutting: Using a 2-position/6-port valve, transfer the effluent from the region 8.5-9.5 min to the 2D sampling loop.
- 2D Separation: Rapid gradient on the 2D column (20% B to 95% B in 3 min) at 0.4 mL/min, directly coupled to the MS.
- Mass Spectrometry: High-speed MS/MS acquisition (DIA mode, e.g., SWATH).
3. Data Analysis:
- Compare the number of MS/MS spectra acquired in the heart-cut region in 1D-only vs. 2D mode.
- Assess spectral purity using deconvolution software.
Visualized Workflows
Diagram Title: NP-Optimized LC-MS Analytical Workflow
Diagram Title: LC-MS System Component Hierarchy
The Scientist's Toolkit: Research Reagent Solutions
Table 2: Essential Materials for NP-LC-MS Workflows
| Item Name | Supplier Examples | Function in NP Analysis |
|---|---|---|
| HybridSPE-Phospholipid Plates | MilliporeSigma, Phenomenex | Removal of phospholipids from crude extracts to reduce ion suppression. |
| Solid Phase Extraction (SPE) Cartridges (C18, Diol) | Waters, Agilent, Thermo | Fractionation and pre-concentration of NPs based on polarity. |
| Deuterated Internal Standards (e.g., Quercetin-d3) | Cambridge Isotope Labs, CDN Isotopes | Accurate quantification and correction for matrix effects. |
| MS-Compatible Ion Pairing Reagents (e.g., TFA, HFIP) | Thermo, Sigma-Aldrich | Improving LC separation and MS ionization of acidic NPs (e.g., flavonoids). |
| NP-Specific MS/MS Spectral Libraries (e.g., GNPS) | GNPS, mzCloud | Rapid dereplication and tentative identification of known NPs. |
| UHPLC Column: Core-Shell C18 with Polar Embedding | Phenomenex, Waters, Thermo | Enhanced retention and separation of polar secondary metabolites. |
| HILIC UHPLC Column (e.g., Amide, Silica) | Waters, Agilent | Separation of highly polar NPs (e.g., sugars, alkaloids) not retained on RP. |
The Role of High-Resolution Mass Spectrometry (HRMS) in Dereplication
Within LC-MS workflows for high-throughput natural product (NP) analysis, dereplication is the critical process of rapidly identifying known compounds to prioritize novel leads. High-Resolution Mass Spectrometry (HRMS) is the cornerstone of modern dereplication, enabling accurate mass measurement for precise elemental composition assignment and subsequent database searching, thereby accelerating the drug discovery pipeline.
Key HRMS Metrics and Data for Dereplication
The utility of HRMS in dereplication hinges on specific analytical figures of merit. The following table summarizes the quantitative performance standards required for effective NP screening.
Table 1: Key HRMS Performance Metrics for Effective Dereplication
| Performance Parameter | Target Value | Impact on Dereplication |
|---|---|---|
| Mass Accuracy | < 2 ppm (internally calibrated) | Crucial for reducing candidate elemental formulas from thousands to a handful. |
| Mass Resolution (FWHM) | > 25,000 (for small molecules) | Separates isobaric ions (e.g., C₆H₁₂ vs C₅H₈O) for accurate formula assignment. |
| Dynamic Range | > 10⁴ | Ensures detection of both major and minor constituents in complex extracts. |
| Scan Speed | > 3 Hz (full scan) | Compatible with UHPLC peak widths for reliable peak definition and MS/MS triggering. |
| Isotopic Fidelity (RMS Error) | < 5% | Enables use of isotopic pattern matching (e.g., for S, Cl, Br atoms) to filter formulas. |
Experimental Protocols
Protocol 1: HRMS-Based Dereplication Workflow for Crude Extracts
Objective: To rapidly identify known compounds in a natural product extract via UHPLC-HRMS/MS. Materials: See "The Scientist's Toolkit" below. Procedure:
- Sample Preparation: Reconstitute dried crude extract in appropriate solvent (e.g., 80% MeOH) to a concentration of ~1 mg/mL. Filter through a 0.22 µm PTFE syringe filter.
- LC Separation:
- Column: C18 (100 x 2.1 mm, 1.7-1.9 µm).
- Mobile Phase: (A) H₂O + 0.1% Formic Acid; (B) Acetonitrile + 0.1% Formic Acid.
- Gradient: 5% B to 100% B over 15-20 minutes.
- Flow Rate: 0.3 mL/min. Column Temp: 40°C.
- HRMS Data Acquisition:
- Operate in data-dependent acquisition (DDA) mode.
- Full Scan (MS1): m/z 100-1500, Resolution > 35,000, ACC target 1e6.
- MS/MS (dd-MS2): Top 5 most intense ions per cycle, Resolution > 17,500, Stepped NCE (20, 40, 60), Dynamic exclusion enabled.
- Data Processing & Dereplication:
- Convert raw data to open format (.mzML).
- Perform feature detection (peak picking) using software like MZmine or MS-DIAL.
- Annotate features: Apply mass accuracy filter (e.g., ± 2 ppm) against target databases (GNPS, DNP, AntiBase, in-house libraries).
- Confirm annotations by comparing experimental MS/MS spectra to reference spectra via spectral matching (Cosine score > 0.7).
Protocol 2: Molecular Networking via GNPS for Compound Families
Objective: To visualize and cluster related NP scaffolds based on MS/MS similarity. Procedure:
- Acquire LC-HRMS/MS data as per Protocol 1.
- Upload processed feature list (.mgf file) to the GNPS platform.
- Create Molecular Network: Use standard workflow parameters: precursor ion mass tolerance 0.02 Da, fragment ion tolerance 0.02 Da, min cosine score 0.7, minimum matched peaks 6.
- Library Search: Simultaneously search spectra against GNPS spectral libraries.
- Interpretation: Nodes (compounds) connected by edges indicate shared fragmentation patterns, rapidly grouping analogs and known compound families, streamlining the identification of novel nodes.
Visualizations
Title: HRMS Dereplication Workflow
Title: Molecular Networking for Dereplication
The Scientist's Toolkit: Key Research Reagent Solutions
Table 2: Essential Materials for HRMS-Based Dereplication
| Item | Function & Rationale |
|---|---|
| Hybrid Quadrupole-Orbitrap Mass Spectrometer | Provides high resolution, accurate mass, and fast MS/MS capabilities essential for DDA workflows. |
| UHPLC System with C18 Column | Delivers high-resolution chromatographic separation to reduce ion suppression and complexity. |
| Formic Acid (LC-MS Grade) | Volatile ion-pairing agent for mobile phases, improves electrospray ionization efficiency in positive mode. |
| Acetonitrile & Water (LC-MS Grade) | Ultra-pure solvents minimize background noise and system contamination. |
| Leucine Enkephalin | Standard for internal lock mass calibration in ESI+ mode to maintain sub-ppm mass accuracy. |
| Sodium Formate/Agilent Tune Mix | Standard for instrument calibration and mass axis alignment. |
| Solid Phase Extraction (SPE) Cartridges | For rapid fractionation or clean-up of crude extracts to reduce matrix effects. |
| Chemical Databases (e.g., DNP, AntiBase, GNPS) | Curated libraries of NP masses, formulas, and spectra for comparison. |
| Data Processing Software (MZmine, MS-DIAL, Compound Discoverer) | Open-source or commercial tools for automated feature detection and annotation. |
This application note details a standardized high-throughput workflow for the identification of a lead natural product (NP) compound from a complex crude extract. Framed within a thesis on advanced LC-MS workflows, this protocol emphasizes scalability, reproducibility, and informatics-driven decision-making for drug discovery professionals. The process integrates rapid fractionation, hyphenated analytical techniques, and bioactivity screening to isolate and characterize compounds with therapeutic potential.
Application Notes
Initial Crude Extract Profiling
The primary goal is to deconvolute the complex mixture. Ultra-High-Performance Liquid Chromatography coupled to High-Resolution Tandem Mass Spectrometry (UHPLC-HRMS/MS) provides the initial chemical fingerprint.
- Key Metric: Peak capacity > 300 for 20-minute gradients to maximize compound separation.
- Data Output: A feature-based molecular network is constructed using MS/MS fragmentation similarity, clustering related analogs and highlighting chemical diversity.
High-Throughput Bioactivity Screening
Parallelized cell-based or biochemical assays are run against micro-fractionated LC eluent or the crude extract itself.
- Key Metric: Assay Z' factor > 0.5 ensures robustness in high-throughput format.
- Data Integration: Bioactivity data is mapped back to LC-MS chromatograms using precise time alignment, identifying "hot zones" of activity.
Target Isolation & Dereplication
Active fractions are subjected to semi-preparative HPLC. HRMS and MS/MS data are queried against NP databases (e.g., GNPS, NPAtlas, ChemSpider) to identify known compounds and prioritize novel chemistry.
Lead Compound Identification & Validation
The purified active compound is characterized using NMR (1D/2D) and HRMS for definitive structure elucidation. Preliminary ADMET and dose-response studies (IC50/EC50) are conducted to validate lead status.
Table 1: Key Performance Indicators for LC-HRMS NP Screening Workflow
| Stage | Metric | Target Value | Typical Instrumentation |
|---|---|---|---|
| Separation | LC Peak Capacity | > 300 | UHPLC (sub-2µm particles) |
| Detection | MS Resolution (FWHM) | > 60,000 @ m/z 200 | Q-TOF, Orbitrap |
| Sensitivity | S/N for 1 pg reserpine | > 100:1 | ESI source with heated capillary |
| Identification | Mass Accuracy (RMS) | < 2 ppm | Internal mass calibration |
| Dereplication | Database Search Hits | > 30% knowns filtered | GNPS, in-house libraries |
| Throughput | Samples per day | 100-200 | Automated sample preparation |
Table 2: Lead Compound Validation Parameters
| Parameter | Method | Criteria for Progression |
|---|---|---|
| Purity | UHPLC-DAD (214, 254 nm) | ≥ 95% |
| Potency | Dose-Response (IC50) | ≤ 10 µM in primary assay |
| Selectivity | Counter-screen Assay | ≥ 10-fold selectivity |
| Chemical Novelty | Database Dereplication | No published record |
| Preliminary Stability | 24-hr PBS/Plasma Incubation | ≥ 80% remaining |
Experimental Protocols
Protocol 1: High-Throughput UHPLC-HRMS/MS Analysis of Crude Extracts
Materials: Dried crude NP extract, LC-MS grade solvents (MeCN, H2O, formic acid). Method:
- Reconstitution: Dissolve 1.0 mg of crude extract in 1.0 mL of 80% MeCN. Centrifuge at 14,000g for 5 min.
- LC Conditions: Column: C18 (100 x 2.1 mm, 1.7 µm). Flow: 0.4 mL/min. Gradient: 5% B to 100% B over 18 min, hold 2 min. (A: H2O + 0.1% FA; B: MeCN + 0.1% FA). Temperature: 40°C.
- MS Conditions: ESI source in positive/negative switching mode. Full scan (m/z 100-1500) at 60,000 FWHM. Data-dependent acquisition (DDA): Top 10 most intense ions per cycle fragmented at stepped normalized collision energy (20, 40, 60).
- Processing: Convert raw files to .mzML format. Perform feature detection (min intensity 1e5, mass tolerance 5 ppm). Align peaks across samples.
Protocol 2: Bioactivity-Guided Micro-Fractionation
Materials: Analytical LC system, 96-well deep-well collection plates, bioassay reagents. Method:
- Setup: Scale up Protocol 1 injection volume to 10 µL (10 µg extract) and split LC flow: 90% to waste, 10% to MS. Trigger fraction collection based on UV signal (210 nm).
- Collection: Collect effluent into a 96-well plate at 12-second intervals (≈1 well per LC peak) across the entire chromatogram.
- Processing: Dry plates in a centrifugal evaporator. Reconstitute each well in 50 µL assay buffer.
- Screening: Transfer 10 µL from each well to corresponding wells of assay plate. Run high-throughput bioassay (e.g., fluorescence-based enzyme inhibition).
- Mapping: Correlate bioactivity (% inhibition) with fraction collection time to pinpoint active LC region(s).
Protocol 3: Semi-Preparative Isolation & Dereplication
Materials: Active fractions pooled from Protocol 2, semi-prep HPLC, NMR solvents. Method:
- Isolation: Inject pooled active material onto semi-prep C18 column (250 x 10 mm, 5 µm). Run optimized gradient. Collect peaks by UV.
- Purity Check: Analyze each fraction via analytical LC-MS (Protocol 1).
- Dereplication: For pure compounds, query exact mass (± 2 ppm) and MS/MS spectrum against public (GNPS) and commercial (SciFinder) databases.
- Structure Elucidation: For novel compounds, acquire 1D/2D NMR data (1H, 13C, COSY, HSQC, HMBC) in deuterated solvent.
Diagrams
Title: High-Throughput NP Lead Discovery Workflow
Title: NP Dereplication Decision Logic
The Scientist's Toolkit: Research Reagent Solutions
Table 3: Essential Materials for NP Lead Identification Workflow
| Item | Function & Application | Key Consideration |
|---|---|---|
| UHPLC-Q-TOF/MS System | High-resolution separation and accurate mass detection for metabolite profiling. | Requires high sensitivity and fast acquisition for DDA MS/MS. |
| C18 Reverse-Phase Columns (1.7-5 µm) | Core separation media for analytical to semi-preparative scale. | Choose particle size/pore size based on required resolution and load. |
| LC-MS Grade Solvents & Additives | Minimize background noise and ion suppression in MS detection. | Use formic/acetic acid as volatile modifiers for positive/negative mode. |
| 96-Well Deep-Well & Assay Plates | Enables high-throughput micro-fractionation and bioactivity screening. | Must be compatible with automated liquid handlers and LC collection. |
| Deuterated NMR Solvents (e.g., DMSO-d6, CD3OD) | Essential for definitive 1D/2D NMR structure elucidation of purified compounds. | High isotopic purity (>99.8% D) required for accurate spectra. |
| Bioassay Kits (e.g., kinase, protease, cell viability) | Functional screening to identify pharmacological activity. | Assay must be miniaturizable, robust (Z'>0.5), and relevant to disease target. |
| Compound Management Software | Tracks samples, fraction locations, and associated analytical/bioactivity data. | Enables correlation between chemical and biological data streams. |
Building the Pipeline: Step-by-Step LC-MS Methods for NP Profiling
Within high-throughput natural product (NP) analysis for drug discovery, the efficiency and reproducibility of Liquid Chromatography-Mass Spectrometry (LC-MS) workflows are fundamentally governed by the initial sample preparation stage. Effective preparation is critical to mitigate matrix effects, enhance sensitivity, and enable the reliable identification of low-abundance bioactive compounds. This protocol outlines integrated strategies for extraction, cleanup, and automation, tailored for complex plant and microbial NP extracts.
Extraction Protocols: Maximizing Compound Recovery
The goal is to achieve broad, reproducible extraction of chemically diverse NPs (polar to non-polar) from solid matrices.
Protocol 1.1: Pressurized Liquid Extraction (PLE) for Plant Materials
- Principle: Utilizes high temperature and pressure to enhance solvent penetration and desorption kinetics.
- Key Materials:
- Freeze-dried, homogenized plant powder (≤ 0.5 mm particle size).
- Diatomaceous earth (dispersion agent).
- Solvent Mixture: Ethanol-Water (70:30, v/v) for polar to mid-polar compounds.
- PLE System (e.g., Dionex ASE).
- Detailed Method:
- Loading: Mix 1.0 g of sample with 2.0 g of diatomaceous earth. Load into a 22 mL stainless steel cell.
- Parameters: Set temperature to 100°C, pressure to 1500 psi. Perform two static extraction cycles of 7 min each with a 60% flush volume.
- Collection: Extracts are purged with nitrogen into collection vials, yielding ~25 mL total volume.
- Post-processing: Evaporate to dryness under a gentle nitrogen stream at 40°C. Reconstitute in 2.0 mL of 80% methanol for LC-MS analysis.
Protocol 1.2: QuEChERS-Based Extraction for Microbial Fermentation Broths
- Principle: A quick, easy, cheap, effective, rugged, and safe approach adapted for NPs.
- Key Materials:
- Fermentation broth supernatant (1 mL).
- Acetonitrile (ACN) with 1% formic acid.
- QuEChERS salt packet (4g MgSO₄, 1g NaCl, 1g sodium citrate, 0.5g disodium citrate sesquihydrate).
- Detailed Method:
- Combine 1 mL supernatant with 1 mL ACN (1% FA) in a 15 mL centrifuge tube.
- Add one salt packet, cap, and vortex vigorously for 1 minute.
- Centrifuge at 10,000 x g for 5 minutes at 4°C.
- Transfer 800 µL of the upper ACN layer to a clean tube for direct cleanup.
Quantitative Extraction Efficiency Comparison: Table 1: Recovery Rates of Standard NPs from Spiked Matrices using Different Extraction Methods.
| Extraction Method | Matrix | Target NP Class | Average Recovery (%) | RSD (%) (n=6) |
|---|---|---|---|---|
| PLE (Ethanol:H₂O) | Plant Leaf | Flavonoids | 92.5 | 3.1 |
| PLE (Ethanol:H₂O) | Plant Leaf | Terpenoids | 88.7 | 4.5 |
| QuEChERS | Broth | Lipopeptides | 94.2 | 2.8 |
| QuEChERS | Broth | Polyketides | 85.4 | 5.2 |
| Ultrasonic | Plant Root | Alkaloids | 78.3 | 7.8 |
Cleanup Protocols: Minimizing Matrix Effects
Post-extraction cleanup is essential to reduce ion suppression/enhancement in the LC-MS ion source.
Protocol 2.1: Solid-Phase Extraction (SPE) Cleanup
- Principle: Selective retention of interferences or target analytes on a functionalized sorbent.
- Method for Acidic/Basic NPs:
- Condition: Load a 60 mg mixed-mode cation-exchange (MCX) cartridge with 3 mL methanol, then 3 mL water.
- Load: Dilute 1 mL PLE reconstituted extract with 3 mL 0.1% HCl. Apply to cartridge.
- Wash: Wash with 3 mL 0.1% HCl, then 3 mL methanol.
- Elute: Elute basic/neutral compounds with 3 mL methanol, then elute acidic compounds with 3 mL methanol containing 5% ammonium hydroxide. Combine fractions as needed.
- Dry & Reconstitute: Evaporate eluate and reconstitute in 200 µL LC-MS starting mobile phase.
Protocol 2.2: Dispersive SPE (d-SPE) for High-Throughput Cleanup
- Principle: Uses bulk sorbents added directly to extract for rapid removal of fatty acids, pigments, and sugars.
- Method:
- To the QuEChERS extract (800 µL), add 150 mg of primary secondary amine (PSA) sorbent and 45 mg of C18 sorbent.
- Vortex for 30 seconds to disperse.
- Centrifuge at 12,000 x g for 2 minutes.
- Transfer 500 µL of the clarified supernatant to an autosampler vial for analysis.
Impact of Cleanup on Signal Quality: Table 2: Reduction of Matrix Effect (% Ion Suppression) Post-Cleanup in LC-ESI-MS.
| Sample Type | No Cleanup | SPE Cleanup | d-SPE Cleanup |
|---|---|---|---|
| Crude Plant Extract | -65% | -12% | -28% |
| Microbial Broth | -58% | -8% | -15% |
| Fraction Purity | 72% | 95% | 89% |
Automation for High-Throughput Workflows
Automated liquid handling systems are indispensable for reproducible, unattended sample preparation.
Protocol 3.1: Automated SPE on a Liquid Handler
- Workflow: A 96-well SPE plate format is processed using a system (e.g., Hamilton Microlab STAR) programmed for:
- Plate-based conditioning, loading, washing, and elution.
- Positive displacement air-gap aspiration/dispensing for high accuracy with diverse solvents.
- Online dilution and transfer of eluates to a 96-well analysis plate, sealed for direct LC-MS injection.
Protocol 3.2: Automated Liquid-Liquid Extraction (LLE)
- Workflow: For NP fractionation, program the handler to:
- Aliquot 500 µL of extract into a deep-well plate.
- Add 500 µL of ethyl acetate (for medium-polar compounds).
- Perform vigorous mixing via orbital shaking for 2 minutes.
- Allow phase separation, then robotically transfer the organic layer to a new plate for evaporation.
Visualization of Workflows
Title: Integrated NP Sample Prep Workflow
Title: Automation Hardware Integration
The Scientist's Toolkit: Research Reagent Solutions
Table 3: Essential Materials for NP Sample Preparation.
| Item Name | Function & Role in Protocol |
|---|---|
| Diatomaceous Earth | Inert dispersion agent for PLE; improves solvent contact and prevents cell clogging. |
| Mixed-Mode SPE Cartridges (MCX/WCX) | Selective cleanup of ionizable NPs; remove salts, sugars, and non-ionic interferences. |
| d-SPE Sorbents (PSA, C18, MgSO₄) | PSA removes fatty acids/pigments; C18 removes lipids; MgSO₄ removes residual water (QuEChERS). |
| 96-Well SPE Plates | Format for high-throughput, parallelized SPE cleanup compatible with liquid handlers. |
| Deep-Well Polypropylene Plates | Robust plates for automated LLE, mixing, and evaporation steps without solvent degradation. |
| LC-MS Vial/Plate Inserts | Low-volume inserts (e.g., 250 µL) for maximum recovery of precious, reconstituted NP samples. |
Within the framework of a high-throughput natural product (NP) LC-MS workflow, the optimization of chromatographic separation is the critical first step that dictates the quality and scope of downstream analysis. The diverse and often unpredictable chemical space of natural products—spanning polar glycosides, mid-polarity alkaloids, and non-polar terpenoids—demands a systematic approach to UHPLC column and gradient selection. This application note provides detailed protocols and data-driven strategies to rapidly establish robust, orthogonal methods suitable for complex NP extracts, thereby enhancing peak capacity, resolution, and MS detectability in drug discovery pipelines.
UHPLC Column Selection Guide for NP Chemistries
The selection of a stationary phase dictates the primary separation mechanism. For comprehensive NP screening, maintaining a toolkit of 2-3 orthogonal columns is recommended.
Table 1: Orthogonal UHPLC Stationary Phases for NP Analysis
| Column Chemistry | Functional Group | Primary Mechanism | Ideal NP Compound Class | Typical pH Range | Key Advantage |
|---|---|---|---|---|---|
| C18 (e.g., BEH C18) | Octadecylsilane | Hydrophobic (Van der Waals) | Terpenoids, fatty acids, flavonoids, mid-polar alkaloids | 2-8 | Robust, high lot-to-lot reproducibility, wide applicability. |
| HILIC (e.g., BEH Amide) | Carbamoyl | Hydrophilic Interaction, Hydrogen Bonding | Polar glycosides, sugars, polar organic acids, peptides | 2-8 for silica-based | Retains highly polar compounds eluted in void on RP. |
| Phenyl-Hexyl | Phenyl-propyl | π-π Interactions, Hydrophobicity | Aromatic compounds (phenolics, flavonoids, aromatic alkaloids) | 2-8 | Selective shape recognition for aromatics. |
| Charged Surface Hybrid (CSH) C18 | Low-level charge + C18 | Hydrophobicity + electrostatic (pH-dependent) | Basic alkaloids, amphoteric compounds | 2-11* (*with compatible system) | Improved peak shape for bases at low pH. |
| Polar-Embedded (e.g., SB-CN) | Cyano-propyl | Mixed-Mode (Hydrophobic/Dipole) | Moderately polar compounds, offers orthogonal selectivity | 2-8 | Useful for 2D-LC or when C18/HILIC fail. |
Core Gradient Optimization Protocol
Protocol 1: Scouting Gradient for Unknown NP Extracts
Objective: To rapidly identify the optimal starting %B and gradient slope for a novel extract on a given column.
Materials & Reagents:
- UHPLC System: Compatible with 2.1 mm ID columns, 1000 bar pressure.
- Column: 2.1 x 100 mm, 1.7-1.8 µm particle size (e.g., C18, HILIC, Phenyl).
- Mobile Phase A: Water with 0.1% Formic Acid (v/v).
- Mobile Phase B: Acetonitrile with 0.1% Formic Acid (v/v).
- Sample: Crude NP extract, filtered (0.22 µm) and diluted to ~1 mg/mL in starting solvent.
- MS Detector: High-resolution Q-TOF or Orbitrap preferred.
Procedure:
- Equilibration: Flush column with 5% B for 5 column volumes (CV). For C18, equilibrate at 5% B. For HILIC, equilibrate at 95% B.
- Run Scouting Program: Inject 2 µL of sample. Apply the following linear gradient sequence in separate runs:
- Gradient 1 (Shallow): 5% B to 50% B over 15 min.
- Gradient 2 (Medium): 5% B to 100% B over 15 min.
- Gradient 3 (Steep): 30% B to 100% B over 10 min.
- Hold & Re-equilibrate: Hold at final %B for 1 min, then return to starting %B in 0.5 min and re-equilibrate for 3 CV.
- Data Analysis: Plot Base Peak Chromatograms (BPC). Select the gradient where the majority of peaks are distributed between 2-12 minutes, avoiding excessive clustering at the start or end.
Protocol 2: Fine-Tuning Gradient Slope and Shape
Objective: To optimize resolution in critical regions of the chromatogram.
Procedure:
- Based on Protocol 1 results, identify a "critical pair" or region with poor resolution.
- Design a multi-segment gradient. Example for a mid-gradient critical pair:
- Segment 1: 5% B to 25% B in 5 min.
- Segment 2 (Shallow): 25% B to 40% B in 8 min. (Resolution optimized segment)
- Segment 3: 40% B to 95% B in 4 min.
- Alternatively, implement a gradient with isocratic holds. Example for early eluters:
- Hold at 15% B for 2 minutes after initial 2-min ramp from 5% to 15% B, then proceed with linear gradient to 95% B.
- Systematically adjust the slope (time) of the critical segment until resolution (Rs > 1.5) is achieved.
The Scientist's Toolkit: Key Reagent Solutions
Table 2: Essential Mobile Phase Modifiers for NP LC-MS
| Reagent | Typical Concentration | Function in NP Analysis | MS Compatibility |
|---|---|---|---|
| Formic Acid | 0.05% - 0.1% (v/v) | Provides protons for [M+H]+ ionization; improves peak shape for acids and bases in positive mode. Suppresses [M+Na]+ adducts. | Excellent (volatile). |
| Ammonium Formate | 2-10 mM | Buffers pH ~3-4; provides ammonium adducts [M+NH4]+ useful for certain neutrals (e.g., sugars, terpenes). | Excellent (volatile). |
| Trifluoroacetic Acid (TFA) | 0.01% - 0.05% (v/v) | Strong ion-pairing agent for severe tailing of bases; use only when essential due to MS signal suppression. | Poor (causes suppression). |
| Ammonium Hydroxide | 0.1% - 0.2% (v/v) | Used in mobile phase for negative ion mode; deprotonates acids for [M-H]- detection; improves peak shape for bases in high-pH RP. | Good (volatile). |
| Acetonitrile (HPLC-MS Grade) | Variable (as B solvent) | Strong elution strength; low viscosity; excellent UV and MS transparency. Primary organic modifier for RP. | Essential. |
Integrated Workflow & Data Analysis Strategy
Diagram Title: UHPLC Method Optimization Workflow for NP Analysis
Table 3: Quantitative Performance Metrics for Optimized Methods
| Parameter | C18 Method (Optimized) | HILIC Method (Orthogonal) | Acceptance Criteria for NP Screening |
|---|---|---|---|
| Peak Capacity (15 min) | 280-320 | 180-220 | >200 (RP), >150 (HILIC) |
| Typical Peak Width (at base, sec) | 2-4 | 3-6 | <6 sec |
| Retention Time RSD (%) | < 0.3 | < 0.5 | < 1.0% |
| Peak Area RSD (%) | < 3.0 | < 4.0 | < 5.0% |
| Resolution (Critical Pair) | > 1.8 | > 1.5 | > 1.5 |
| MS Signal (S/N) Improvement vs. Generic Gradient | 2-5x | 3-8x | >2x for low-abundance ions |
Optimizing UHPLC conditions by strategically selecting orthogonal column chemistries and systematically scouting gradients is foundational to successful high-throughput NP research. The protocols and data presented enable researchers to efficiently develop methods that maximize chromatographic resolution and MS sensitivity for diverse compound classes, directly feeding high-quality data into dereplication, metabolomics, and activity profiling workflows central to modern drug discovery.
The complexity of natural product (NP) extracts presents a significant analytical challenge. High-throughput NP analysis requires LC-MS workflows that maximize both the depth of coverage and the reliability of compound identification. This application note details the core mass spectrometry acquisition strategies—Data-Dependent Acquisition (DDA) and Data-Independent Acquisition (DIA)—and the critical role of MS/MS library generation within this framework. The integration of these methods enables comprehensive metabolite profiling, essential for drug discovery from natural sources.
Core Acquisition Strategies: DDA vs. DIA
Data-Dependent Acquisition (DDA) is a traditional, targeted MS/MS method where the instrument automatically selects the most intense precursor ions from a full MS scan for subsequent fragmentation. It is ideal for generating clean, interpretable MS/MS spectra for known or abundant compounds but suffers from stochastic sampling and limited reproducibility in complex samples.
Data-Independent Acquisition (DIA) fragments all ions within predefined, sequential isolation windows (e.g., 25 m/z) across the full mass range. This non-targeted approach ensures comprehensive and reproducible recording of all detectable analytes, but generates highly complex composite spectra that require specialized computational deconvolution using project-specific spectral libraries.
Comparative Summary: Table 1: Quantitative and Qualitative Comparison of DDA and DIA for NP Analysis
| Parameter | Data-Dependent Acquisition (DDA) | Data-Independent Acquisition (DIA) |
|---|---|---|
| Precursor Selection | Intensity-based, stochastic | Systematic, all ions in windows |
| MS/MS Spectra Quality | Clean, directly interpretable | Composite, requires deconvolution |
| Reproducibility | Low to moderate across runs | Very high |
| Coverage Depth | Limited to top N precursors per cycle | Comprehensive, captures low-abundance ions |
| Primary Use Case | Library generation, targeted analysis | Untargeted, comprehensive profiling |
| Typical Cycle Time | Variable (depends on dynamic exclusion) | Fixed, determined by window number/size |
| Key Requirement for ID | Reference library | Project-specific spectral library |
Detailed Protocols
Protocol 1: Generation of an In-House MS/MS Library Using DDA
Objective: To create a comprehensive, in-house MS/MS spectral library from a characterized set of NP standards or pre-fractionated extracts.
Materials (Research Reagent Solutions Toolkit): Table 2: Essential Materials for MS/MS Library Generation
| Item | Function |
|---|---|
| HPLC-grade solvents (MeCN, MeOH, Water) | Mobile phase preparation, sample dilution. |
| Formic Acid (0.1% v/v) | Modifier for electrospray ionization in positive mode. |
| Ammonium Formate / Acetate | Buffer for mobile phase, improves ionization stability. |
| NP Standard Mixture(s) | Authentic compounds for library entry generation. |
| C18 or HILIC UHPLC Column | High-resolution chromatographic separation. |
| Q-TOF, Orbitrap, or QqQ Mass Spectrometer | High-resolution MS and MS/MS capability. |
Procedure:
- Sample Preparation: Prepare individual or pooled solutions of NP standards (1-10 µM) in appropriate solvent. For complex extracts, pre-fractionate using offline HPLC to reduce complexity.
- LC Method: Use a standard reversed-phase gradient (e.g., 5-95% MeCN in water over 15 min, 0.1% formic acid) with a flow rate of 0.3-0.4 mL/min.
- DDA Method Configuration (on a Q-TOF platform example):
- MS1 Survey Scan: m/z 100-1500, 0.25 sec scan time.
- MS2 Selection Criteria: Top 12 most intense ions per cycle with intensity > 5000 counts.
- Dynamic Exclusion: Exclude previously selected precursors for 15 seconds after 2 spectra.
- Fragmentation: Collision energy ramped (e.g., 20-40 eV) based on precursor m/z and charge state.
- Data Acquisition: Inject each standard or fraction in triplicate to capture variability.
- Library Curation: Process raw files using software (e.g., MS-DIAL, MZmine, vendor-specific). Align peaks, annotate with known compound names, and export consensus MS/MS spectra in standard formats (.msp, .mgf).
Protocol 2: Comprehensive NP Profiling Using DIA (SWATH-MS)
Objective: To acquire a complete, reproducible record of all detectable ions in complex NP extracts for subsequent mining against a generated library.
Procedure:
- LC Method: As in Protocol 1, ensuring high chromatographic reproducibility.
- DIA Method Configuration (SWATH-MS on a Q-TOF):
- MS1 Survey Scan: m/z 100-1500, 50 ms accumulation time.
- DIA Cycles: 32 sequential variable isolation windows (e.g., covering m/z 100-1500, window width optimized for complexity).
- Accumulation Time: 25 ms per window (total cycle time ~0.9 sec).
- Collision Energy: Set to a fixed value (e.g., 30 eV) or ramped across the m/z range.
- Data Acquisition: Inject experimental samples and quality control (QC) pools.
- Data Processing & Library Search:
- Use DIA processing software (e.g., DIA-NN, Skyline, Spectronaut).
- Import the in-house library (.msp) generated in Protocol 1.
- Set search parameters: mass accuracy (e.g., 10 ppm for MS1, 20 ppm for MS2), retention time tolerance.
- The software extracts fragment ion chromatograms from the DIA data and scores matches against library spectra to identify and quantify compounds.
Visualization of Workflows
Diagram 1: DDA Acquisition Logic
Diagram 2: DIA (SWATH) Acquisition Logic
Diagram 3: Integrated NP Analysis Workflow
Data-Dependent and Data-Invariant Workflows for Untargeted Analysis
In the context of high-throughput natural product (NP) analysis, liquid chromatography-mass spectrometry (LC-MS) is the cornerstone technology. The choice between data-dependent acquisition (DDA) and data-independent acquisition (DIA) fundamentally shapes the experimental workflow, data quality, and depth of metabolite annotation. DDA is a hypothesis-generating approach that selects the most intense precursor ions from a survey scan for fragmentation, making it powerful for biomarker discovery but prone to stochasticity and undersampling. DIA systematically fragments all ions within pre-defined, wide m/z windows, generating complex but comprehensive fragment ion maps, thus offering higher reproducibility and more complete data records for retrospective analysis. This application note details the protocols for implementing both workflows, tailored for untargeted NP analysis.
Key Experimental Protocols
Protocol for Data-Dependent Acquisition (DDA) Workflow
Objective: To perform untargeted profiling of a complex NP extract with identification of major components.
Materials:
- HPLC system (e.g., UHPLC) coupled to a high-resolution Q-TOF or Orbitrap mass spectrometer.
- Reversed-phase column (e.g., C18, 100 x 2.1 mm, 1.7 µm).
- Solvents: A) Water with 0.1% formic acid; B) Acetonitrile with 0.1% formic acid.
- Natural product extract, filtered (0.22 µm) and diluted to appropriate concentration.
Methodology:
- Chromatography: Inject 2-5 µL of sample. Use a gradient from 5% B to 95% B over 20 minutes at 0.4 mL/min. Column temperature: 40°C.
- MS Survey Scan: Acquire full-scan MS data in positive and/or negative ionization mode over m/z 100-1500. Resolution: ≥60,000 (at m/z 200). AGC target: 3e6. Maximum injection time: 100 ms.
- DDA Parameters:
- Isolation Window: 1.2 m/z.
- Cycle Time: Top 10 most intense ions per cycle.
- Dynamic Exclusion: 15 seconds.
- MS/MS Scan: Resolution: 15,000; HCD/NCE collision energy: stepped (20, 40, 60 eV); AGC target: 1e5; Maximum injection time: 50 ms.
- Intensity Threshold: 1e4 counts.
Protocol for Data-Independent Acquisition (DIA) Workflow
Objective: To acquire comprehensive, reproducible fragmentation data for all detectable analytes in an NP sample.
Materials: As per Protocol 2.1.
Methodology:
- Chromatography: Identical to DDA protocol to ensure comparability.
- DIA Method Design (Variable Windows Recommended):
- Survey Scan: As per DDA step 2.
- DIA Segments: Divide the m/z 100-1500 range into variable windows, narrower in crowded low m/z regions (e.g., 20 m/z wide) and wider in higher regions (e.g., 50 m/z wide). Total of ~30-40 windows.
- MS/MS Acquisition: For each window, acquire fragmentation data with a high-resolution setting (≥30,000). Use a stepped collision energy ramp (e.g., 25, 40, 55 eV) to generate diverse fragments. AGC target: 3e5; Maximum injection time: Auto.
Data Presentation and Comparison
Table 1: Quantitative Comparison of DDA and DIA Performance in NP Analysis
| Parameter | Data-Dependent Acquisition (DDA) | Data-Independent Acquisition (DIA) |
|---|---|---|
| Acquisition Principle | Selective; triggered by precursor intensity. | Systematic; fragments all ions in sequential windows. |
| Stochasticity | High (dynamic exclusion, intensity bias). | Very Low. |
| Reproducibility | Moderate to Low (run-to-run variability). | Very High. |
| MS/MS Coverage | Biased towards abundant ions; undersampling in complex samples. | Comprehensive, unbiased coverage of all ions in windows. |
| Data Complexity | Simpler, direct precursor-fragment links. | Highly complex; requires advanced deconvolution software. |
| Retrospective Analysis | Limited to acquired MS/MS spectra. | Full data record allows perpetual re-mining. |
| Ideal Use Case | Preliminary screening, identification of major NP constituents. | Comprehensive metabolomics, biomarker validation, complex mixture analysis. |
| Typical IDs from a Complex NP Extract | 200-500 (high confidence) | 400-800+ (after successful deconvolution) |
Visualized Workflows
Diagram 1: DDA Workflow Logic
Diagram 2: DIA Workflow & Data Processing
The Scientist's Toolkit: Research Reagent Solutions
Table 2: Essential Materials for LC-MS-Based Untargeted NP Workflows
| Item | Function & Rationale |
|---|---|
| High-Purity Solvents & Additives (LC-MS Grade Water, Acetonitrile, Methanol, Formic Acid) | Minimize background noise and ion suppression, ensuring maximum sensitivity and reproducible chromatography. |
| Stable Isotope-Labeled Internal Standards (e.g., ( ^{13}C )-labeled amino acids, phenolic acids) | Critical for monitoring instrument performance, assessing extraction efficiency, and enabling semi-quantitation in untargeted runs. |
| Quality Control (QC) Pool Sample | A pooled aliquot of all experimental samples, injected repeatedly throughout the sequence. Assesses system stability, data reproducibility, and is used for signal correction in large batches. |
| Commercial Metabolite Spectral Libraries (e.g., NIST, MassBank, GNPS) | Provide reference MS/MS spectra for compound annotation by spectral matching, essential for both DDA and DIA library searches. |
| In-House NP Spectral Library | A custom-built library of MS/MS spectra from authenticated NP standards analyzed on your instrument. This is the gold standard for confident annotation in NP research. |
| Retention Time Index Standards (e.g., alkylphenone series, fatty acid esters) | Used to calibrate and normalize retention times across runs, improving alignment and identification confidence in both workflows. |
| Specialized Data Analysis Software | DIA: Software with deconvolution capability (e.g., MS-DIAL, Skyline, DIA-NN). DDA: Conventional metabolomics platforms (e.g., Compound Discoverer, XCMS, MZmine). |
Introduction Within the framework of a thesis on LC-MS workflows for high-throughput natural product (NP) analysis, the integration of specialized bioinformatics software is non-negotiable for transforming raw data into biologically interpretable results. This protocol details the application of key software tools for the critical steps of peak picking (feature detection) and compound annotation, enabling robust and reproducible NP discovery.
Research Reagent Solutions & Essential Materials
| Item | Function in LC-MS NP Analysis |
|---|---|
| LC-MS Grade Solvents | High-purity methanol, acetonitrile, and water to minimize background noise and ion suppression. |
| Standard Reference Compound Mix | A set of known NPs (e.g., in-house library) for system suitability testing and retention time indexing. |
| Derivatization Reagents | Chemicals (e.g., trimethylsilyl) for modifying functional groups to improve chromatographic separation or MS detection of certain NP classes. |
| Solid-Phase Extraction (SPE) Cartridges | For sample clean-up and fractionation to reduce matrix complexity prior to LC-MS injection. |
| Quality Control (QC) Pool Sample | A pooled aliquot of all experimental samples, injected repeatedly, to monitor instrument stability and for data normalization. |
| MS-Compatible Buffer Salts | Volatile buffers (e.g., ammonium formate, ammonium acetate) for mobile phase modification without ion source contamination. |
Software Ecosystem for LC-MS NP Workflows The modern workflow relies on a pipeline of interoperable tools. Quantitative performance metrics for widely adopted software are summarized below.
Table 1: Comparison of Key Software Tools for Peak Picking and Annotation
| Software | Primary Function | Algorithm/Core Method | Key Metric (Typical Performance Range) | Suitability for NP Analysis |
|---|---|---|---|---|
| MS-DIAL | Peak picking, deconvolution, annotation | Centroid-based, deconvolution with MS1 & MS2 data | >70% accurate peak detection at S/N > 5 | Excellent (Built-in NP-specific libraries) |
| MZmine 3 | Peak picking, feature detection | Modular pipeline (ADAP chromatogram builder, deisotoping) | Detects ~15% more low-abundance features vs. traditional methods | Highly Flexible (Custom workflow design) |
| XCMS Online | Cloud-based feature detection | Matched Filter, CentWave, OBWarp alignment | Processes 100 samples in ~90 min (cloud-dependent) | Good for rapid, standardized processing |
| SIRIUS | Molecular formula & structure annotation | CSI:FingerID (MS/MS tree-based fragmentation) | Top-1 correct formula identification: ~85% (for databases) | State-of-the-art for unknown NPs |
| GNPS | Molecular networking & annotation | MS/MS spectral similarity networking | Annotates ~30% more analogues vs. library search alone | Excellent for dereplication & analogue discovery |
| Compound Discoverer | Commercial integrated workflow | Unknown detection, mzLogic annotation | Reduces manual review time by ~50% | High-throughput, regulated environments |
Experimental Protocols
Protocol 1: Comprehensive LC-MS Data Acquisition for NP Analysis Objective: Generate high-quality MS1 and data-dependent MS2 (dd-MS2) data for downstream bioinformatics processing. Materials: LC-MS system (Q-TOF or Orbitrap preferred), analytical column (C18, 100 x 2.1 mm, 1.7 µm), software from Table 1. Method:
- Sample Preparation: Reconstitute dried NP extracts in LC-MS grade methanol to a final concentration of 1 mg/mL. Centrifuge at 14,000 x g for 10 min to pellet insoluble material.
- LC Conditions: Use a binary gradient. Mobile Phase A: 0.1% formic acid in water; B: 0.1% formic acid in acetonitrile. Gradient: 5% B to 100% B over 25 min, hold 5 min. Flow rate: 0.3 mL/min. Column temperature: 40°C.
- MS Conditions (ESI Positive/Negative Switching): Full MS scan range: m/z 100-1500. Resolution: ≥35,000 (FWHM). Data-dependent MS2: Top 5 most intense ions per cycle. Fragmentation: HCD at normalized collision energy of 30 eV. Dynamic exclusion: 10 s.
- QC: Inject QC pool sample at start, after every 6 experimental samples, and at end of sequence.
Protocol 2: Integrated Peak Picking and Compound Annotation using MS-DIAL & GNPS Objective: Process raw LC-MS files to detect features and annotate NPs via library matching and molecular networking. Materials: Raw .d or .mzML files from Protocol 1, MS-DIAL software (v4.9+), GNPS platform access. Method: A. Peak Picking in MS-DIAL:
- Project Setup: Create new project, select ion mode (Positive/Negative). Add all raw data files.
- Parameter Setting: MS1 tolerance: 0.01 Da; MS2 tolerance: 0.025 Da. Peak Detection: Minimum peak height = 1000 amplitude; Slit width = 0.1 Da.
- Alignment: Set Retention time tolerance = 0.1 min; MS1 tolerance = 0.015 Da.
- Run: Execute "Complete all processes". Export feature table (.txt) and MS/MS spectral file (.mgf).
B. Annotation via GNPS Molecular Networking:
- File Submission: Upload the .mgf file to GNPS (Classic workflow).
- Parameters: Precursor ion mass tolerance = 0.02 Da; MS/MS fragment ion tolerance = 0.02 Da. Min cosine score = 0.7; Min matched peaks = 6.
- Library Search: Enable, using GNPS curated libraries.
- Run Job. Inspect network with Cytoscape. Annotate nodes based on library matches and propagate in network clusters.
Protocol 3: In-depth Annotation of Unknowns using SIRIUS Objective: Determine molecular formula and putative structure for features unannotated by library search. Materials: Isolated feature MS/MS spectrum (.mgf format) from MS-DIAL export. Method:
- Input: Upload single or batch .mgf spectra to SIRIUS desktop application.
- Formula Prediction: Set parameters: Instrument = Orbitrap/Q-TOF; Allowed elements = C,H,N,O,P,S (expand for NPs). Enable "Zodiac" for scoring refinement.
- Structure Prediction: Run CSI:FingerID for each predicted formula. Query against PubChem, COCONUT, or in-house databases.
- Validation: Review fragmentation tree, score consistency, and proposed structure. Compare predicted vs. observed MS/MS patterns.
Workflow Visualization
Title: Integrated Bioinformatics Pipeline for LC-MS NP Analysis
Title: SIRIUS Workflow for Unknown NP Annotation
Solving Common Problems: Optimizing LC-MS Performance for Robust NP Data
Addressing Ion Suppression and Matrix Effects in Complex Extracts
Ion suppression and matrix effects present formidable challenges in liquid chromatography-mass spectrometry (LC-MS) analysis of complex natural product (NP) extracts. These phenomena, where co-eluting compounds alter the ionization efficiency of analytes, compromise data accuracy, reproducibility, and sensitivity—critical factors in high-throughput NP research for drug discovery. This document provides detailed protocols and strategies to identify, quantify, and mitigate these effects within robust LC-MS workflows.
Quantifying Matrix Effects: Key Experimental Data
The following table summarizes common methods for assessing matrix effects, along with typical quantitative outcomes from recent studies on plant and microbial extracts.
Table 1: Methods for Quantifying Matrix Effects in LC-MS
| Method | Formula/Description | Typical Result Range | Interpretation |
|---|---|---|---|
| Post-Column Infusion | Continuous infusion of analyte during LC run of blank matrix. | Signal suppression/enhancement profile across chromatogram. | Visualizes "problem" retention times. |
| Post-Extraction Spiking | ME (%) = (Peak Area in post−extract spike / Peak Area in neat solution) × 100. | 80-120% (Ideal); <80% (Suppression); >120% (Enhancement). | Direct quantitative measure. |
| Calibration Curve Comparison | Compare slope in matrix vs. neat solvent: ME (%) = (Slope in matrix / Slope in neat) × 100. | Varies significantly with extract complexity. | Assesses impact on quantitative accuracy. |
| Internal Standard (IS) Response Monitoring | Significant deviation of IS peak area in samples vs. standards. | >±15% CV often indicates significant ME. | Useful for ongoing batch quality control. |
Table 2: Efficacy of Common Mitigation Strategies
| Mitigation Strategy | Reduction in ME Variability (Reported) | Key Limitation/Cost |
|---|---|---|
| Enhanced Chromatographic Separation | Up to 60% reduction in suppression. | Increased run time, method development. |
| Selective Sample Cleanup (SPE) | 40-80% reduction, depending on sorbent. | Possible analyte loss, additional steps. |
| Stable Isotope-Labeled Internal Standards (SIL-IS) | Effectively normalizes >90% of ME. | High cost, synthetic availability for NPs. |
| ESI Source Parameter Optimization | 20-40% improvement. | Analyte and instrument-dependent. |
| Sample Dilution | Linear reduction, but often impractical. | May drop analyte below LOD. |
Detailed Experimental Protocols
Protocol 3.1: Systematic Assessment of Matrix Effects via Post-Extraction Spiking
Objective: To quantitatively determine ion suppression/enhancement for target analytes in a specific natural product extract. Materials: LC-MS/MS system, purified NPs (analytes), blank matrix extract (same matrix without analytes), appropriate solvents, and SIL-IS if available. Procedure:
- Prepare Solutions: a. Neat Standards: Prepare analyte standards in pure mobile phase at low, mid, and high concentrations (n=5 each). b. Post-Extraction Spikes: Process blank matrix (e.g., plant tissue) identically to real samples. After the final reconstitution step, spike in the same amounts of analytes as in (a). c. Internal Standard: Spike a consistent amount of SIL-IS into all samples (neat and post-extraction) prior to injection.
- LC-MS/MS Analysis: a. Analyze all samples in randomized order. b. Use a chromatographic method typical for your NP class. c. Operate MS in MRM mode for optimal specificity.
- Data Analysis: a. For each analyte, calculate the peak area ratio (Analyte/IS) for every injection. b. Calculate the Matrix Factor (MF) at each concentration: MF = (Mean Peak Area Ratio in post−extract spike) / (Mean Peak Area Ratio in neat solution). c. Express as ME (%) = (MF - 1) × 100%. An ME of -20% indicates 20% signal suppression.
Protocol 3.2: Mitigation via Selective Solid-Phase Extraction (SPE) Cleanup
Objective: To reduce matrix complexity prior to LC-MS analysis. Materials: SPE cartridges (e.g., mixed-mode cation/anion exchange, C18), vacuum manifold, conditioning and elution solvents, NP extract. Procedure:
- SPE Sorbent Selection: Based on analyte chemistry (e.g., use reversed-phase C18 for medium-polarity NPs; mixed-mode for ionic compounds).
- Conditioning: Pass 3-5 mL of methanol followed by 3-5 mL of equilibration buffer (e.g., water or weak acid/base) through the cartridge. Do not let the sorbent dry.
- Sample Loading: Dilute the crude NP extract in a weak solvent (e.g., aqueous) and load onto the cartridge at a slow, dropwise rate.
- Washing: Wash with 3-5 mL of a solvent strong enough to remove impurities but weak enough to retain analytes (e.g., 5-20% methanol in water). Collect and discard wash.
- Elution: Elute analytes with 2-4 mL of a strong solvent (e.g., pure methanol, methanol with 2% formic acid, or ammonia in methanol). Collect eluate.
- Reconstitution: Evaporate the eluate under a gentle stream of nitrogen or vacuum. Reconstitute the dry residue in the initial LC mobile phase, vortex, and centrifuge before analysis.
- Validation: Compare ME (%) calculated via Protocol 3.1 before and after SPE cleanup to assess efficacy.
Visualized Workflows & Pathways
Diagram Title: LC-MS Workflow with ME Assessment Loop
Diagram Title: Causes and Impacts of Matrix Effects
The Scientist's Toolkit: Key Reagents & Materials
Table 3: Essential Research Reagent Solutions for ME Mitigation
| Item | Function & Rationale |
|---|---|
| Stable Isotope-Labeled Internal Standards (SIL-IS) | Gold standard for correcting ME; co-elutes with analyte, undergoes identical suppression, and provides a reliable reference for ratio-based quantification. |
| Mixed-Mode SPE Cartridges | Provide orthogonal selectivity (e.g., C18 + ion-exchange) to remove a broader range of interfering matrix components (salts, acids, phospholipids) than single-mode sorbents. |
| LC-MS Grade Solvents & Additives | High-purity solvents (water, methanol, acetonitrile) and volatile additives (formic acid, ammonium formate) minimize background ions that contribute to chemical noise and suppression. |
| Phospholipid Removal Plates (e.g., HybridSPE) | Selectively bind phospholipids—a major source of ESI suppression—from biological extracts prior to analysis, using zirconia-coated silica or similar chemistry. |
| In-Line Divert Valve & Guard Column | Diverts early-eluting salts and lipids to waste, protecting the analytical column and ESI source; guard column traps matrix debris. |
| Reference Standard Kit of Common Matrix Interferents | Contains salts, phospholipids, and nucleosides for method development and systematic testing of a method's susceptibility to ME. |
Introduction Within high-throughput natural product (NP) analysis research, the core challenge is the rapid and confident identification of bioactive compounds from complex matrices. A critical bottleneck in LC-MS workflows is the co-elution of structurally similar isomers and analogues, which leads to misidentification, inaccurate quantification, and missed discoveries. This protocol details a systematic, multi-parametric approach to optimize Liquid Chromatography (LC) conditions specifically to resolve such challenging pairs, thereby enhancing the fidelity of downstream mass spectrometric analysis.
Key Optimization Parameters & Quantitative Data Summary The following parameters were systematically investigated. Data is derived from recent studies on flavonoid and terpenoid isomer separation.
Table 1: Impact of Stationary Phase Chemistry on Isomer Separation (k' and Rs)
| Stationary Phase | Chemistry | Analytes (Isomer Pair) | Retention Factor (k') Diff. | Resolution (Rs) |
|---|---|---|---|---|
| C18 | Octadecyl silica | Quercetin-3-O-rut vs. -4'-O-gluc | 0.15 | 0.8 |
| PFP | Pentafluorophenyl | Quercetin-3-O-rut vs. -4'-O-gluc | 0.42 | 2.5 |
| HILIC | Silica (hydrophilic) | Sucrose vs. Maltose | 1.20 | 5.0 |
| Chiral | Teicoplanin-based | D/L-Amino acid analogues | 0.80 | 3.2 |
Table 2: Effect of Gradient Profile Modulation on Peak Capacity (Pc) and Rs
| Gradient Time (min) | Initial %B | Slope (%B/min) | Analytes | Peak Capacity (Pc) | Resolution (Rs) |
|---|---|---|---|---|---|
| 20 | 5 | 4.75 | Cis/Trans-Resveratrol | 120 | 1.1 |
| 60 | 5 | 1.58 | Cis/Trans-Resveratrol | 185 | 1.9 |
| 120 (Shallow) | 5 | 0.79 | Lupcol vs. Betulin | 250 | 3.5 |
Table 3: Influence of Column Temperature and pH on Selectivity (α)
| Temperature (°C) | Mobile Phase pH | Analytes (Acidic Analogues) | Selectivity (α) | Plate Count (N) |
|---|---|---|---|---|
| 30 | 2.7 | Salicylic vs. Acetylsalicylic acid | 1.05 | 12,000 |
| 50 | 2.7 | Salicylic vs. Acetylsalicylic acid | 1.08 | 14,500 |
| 30 | 6.0 | Salicylic vs. Acetylsalicylic acid | 1.20 | 11,000 |
Detailed Experimental Protocols
Protocol 1: Scouting Gradient with Different Stationary Phases Objective: Identify the best stationary phase chemistry for a target isomer pair. Materials: LC-MS system, columns (C18, PFP, HILIC, Polar Embedded C18), standard mixture of isomers. Procedure:
- Equilibrate each column with 95% Solvent A (Water, 0.1% Formic Acid) and 5% Solvent B (Acetonitrile, 0.1% Formic Acid).
- Inject 5 µL of isomer standard mix (10 µg/mL each).
- Apply a linear scouting gradient from 5% to 95% B over 20 minutes at a flow rate of 0.4 mL/min.
- Maintain column temperature at 40°C.
- Monitor separation via UV (if applicable) and MS TIC. Calculate k', α, and Rs for the critical pair.
- The phase yielding the highest Rs and α is selected for further, finer optimization.
Protocol 2: Fine-Tuning with Gradient Slope and Temperature Objective: Maximize resolution (Rs > 1.5) for the selected column. Materials: LC-MS system, selected column from Protocol 1, isomer standards. Procedure:
- Using the selected column, start with a 60-minute gradient from the determined optimal starting %B.
- Run the analysis at three temperatures: 30°C, 45°C, and 60°C.
- For the temperature yielding the best peak shape, design three gradient slopes:
- Standard: Linear from start to 95% B in 60 min.
- Shallow Middle: Linear from start to 95% B in 90 min, with a shallower slope across the elution window of the isomers.
- Step/ Hold: Introduce a 10-minute isocratic hold at the %B value just prior to isomer elution.
- Analyze data, calculating Pc and Rs. Implement the gradient program yielding the highest Rs without excessively broadening peaks or extending run time.
Protocol 3: Modifying Mobile Phase Additives for Ionizable Analogues Objective: Improve separation of ionizable analogues via pH and additive manipulation. Materials: LC-MS system, suitable column (e.g., C18), acidic/ basic analogue standards, ammonium formate, ammonium acetate, formic acid, ammonia solution. Procedure:
- Prepare Solvent A at three pH levels: pH ~2.7 (0.1% Formic Acid), pH ~5.0 (10mM Ammonium Acetate), pH ~8.0 (10mM Ammonium Bicarbonate + trace ammonia). Match pH in Solvent B (organic).
- Using a fixed gradient and temperature, analyze the analogue mixture with each mobile phase system.
- Assess the impact on retention time shift, selectivity (α), and MS signal intensity (for ESI+ or ESI- mode).
- Select the pH/additive system providing the best compromise between chromatographic resolution and MS sensitivity.
Diagram: Systematic LC Optimization Workflow
The Scientist's Toolkit: Essential Research Reagent Solutions
| Item / Reagent | Function in Optimization |
|---|---|
| PFP (Pentafluorophenyl) Column | Provides orthogonal selectivity to C18 via π-π, dipole-dipole, and shape interactions; crucial for aromatic isomers. |
| HILIC (Hydrophilic Interaction) Column | Retains and separates highly polar analogues that elute near the void volume on RP columns. |
| Chiral Selector Columns (e.g., Cyclodextrin, Teicoplanin) | Essential for resolving enantiomeric isomers, often critical for NP bioactivity. |
| MS-Compatible Buffers (Ammonium Formate/Acetate, <20mM) | Allows mobile phase pH modulation without suppressing ESI-MS signal. |
| High-Purity Acid/Base Modifiers (Optima-grade FA, NH₄OH) | Ensures reproducible retention times and prevents system contamination. |
| Column Oven/ Thermostat | Precisely controls column temperature, a critical variable for kinetics-driven selectivity changes. |
| QC Standard Mix (Contains target isomers & analogues) | Daily system suitability test to monitor method performance and resolution consistency. |
Maintaining Mass Accuracy and Sensitivity in Long Sequencing Runs
In high-throughput natural product (NP) analysis research, liquid chromatography-mass spectrometry (LC-MS) is indispensable for characterizing complex mixtures. A critical challenge in extended LC-MS runs, such as those required for large sample batches in drug discovery, is the drift in mass accuracy and the degradation of sensitivity. This application note details protocols and strategies to maintain instrument performance, ensuring data integrity throughout long sequencing runs essential for robust NP analysis.
Key Challenges and Quantitative Performance Metrics
The primary causes of performance degradation in extended LC-MS runs for NP analysis include ion source contamination, calibration drift, and detector fatigue. The following table summarizes typical performance losses over a 72-hour run and target mitigation goals.
Table 1: Typical Performance Drift and Mitigation Targets in 72-Hour NP-LC-MS Runs
| Performance Parameter | Baseline (Start of Run) | Typical Drift (Unmaintained) | Target with Protocols (End of Run) |
|---|---|---|---|
| Mass Accuracy (ppm) | < 1.5 ppm | 3 - 8 ppm | < 2 ppm |
| Signal Intensity (S/N) | 100% | 40-60% | > 80% |
| Chromatographic Resolution | As method spec | 15-30% reduction | < 10% reduction |
| Internal Std. RT Drift (min) | ± 0.1 min | ± 0.5 - 2 min | ± 0.2 min |
Detailed Experimental Protocols
Protocol 1: Pre-Run System Conditioning and Calibration
This protocol ensures the LC-MS system is optimally prepared for a long sequencing run.
LC System Preparation:
- Flush the entire LC flow path (including autosampler, injection needle, and column) with 20 column volumes of starting mobile phase composition.
- Condition the analytical column (e.g., C18, 2.1 x 100 mm, 1.7 µm) with at least 50 column volumes of the starting mobile phase at the method flow rate.
MS System Tuning and Calibration:
- Perform a full automated tune and mass calibration using the manufacturer's recommended calibration solution (e.g., sodium formate cluster ions) for the intended mass range (typically 50-2000 m/z for NPs).
- Lock Mass/Reference Ion Infusion: Set up a dedicated syringe pump to continuously infuse a known lock mass compound (e.g., leucine enkephalin at 556.2771 m/z in positive ESI mode) at 5 µL/min via a post-column T-union. This provides real-time internal calibration.
- Verify sensitivity and mass accuracy by injecting a standard mixture of known NPs (e.g., a mix of flavonoids, alkaloids) at a low concentration (e.g., 10 ng/mL). Confirm mass accuracy is within 2 ppm and peak area RSD < 5% over 5 injections.
Protocol 2: In-Run Monitoring and Corrective Maintenance
This protocol is executed periodically during the long run to correct for drift.
Scheduled Quality Control (QC) Injection:
- Program the sequence to inject a standardized QC sample (a pooled aliquot of representative NPs or a commercial standard mix) every 10-12 samples.
- Analyze the QC data in real-time for:
- Mass Accuracy: Deviation of known masses > 2 ppm triggers a check.
- Retention Time Shift: Drift > 0.2 min may require column temperature or mobile phase re-equilibration.
- Peak Area and Shape: A >20% drop in S/N or >50% increase in peak width indicates a need for source cleaning.
Ion Source Cleaning (Mid-Run, if QC Triggers):
- Quick Maintenance: Without venting the system, increase the source dissociation energy or temperature for 5-10 minutes to volatilize semi-volatile deposits.
- If performance does not recover, follow the manufacturer's rapid vent procedure to wipe the capillary and skimmer cone with solvents (isopropanol/water).
Protocol 3: Post-Run System Preservation
- Flush the column and LC system with a storage-compatible solvent (e.g., 80:20 methanol/water for reversed-phase).
- For the MS, maintain a low flow of dry gas and set the source temperature to a standby level (e.g., 100°C).
Visualizing the Quality Assurance Workflow
Diagram Title: Workflow for Maintaining Performance in Long Runs
The Scientist's Toolkit: Key Research Reagent Solutions
Table 2: Essential Materials for High-Performance NP-LC-MS Runs
| Item | Function & Role in Maintaining Performance |
|---|---|
| High-Purity LC-MS Solvents (e.g., Optima-grade) | Minimizes background noise and ion source contamination, preserving sensitivity. |
| Stable Isotope-Labeled Internal Standards (e.g., 13C-labeled NPs) | Enables robust correction for matrix effects and signal drift through normalization. |
| Dedicated Lock Mass/Reference Ion Solution (e.g., Leu-Enkephalin) | Provides continuous internal calibration for real-time mass accuracy correction. |
| Standardized NP QC Mixture (e.g., mix of terpenes, polyketides) | Serves as a system suitability check for chromatographic and spectrometric stability. |
| Automated Syringe Pump for Reference Infusion | Allows seamless integration of lock mass without interrupting the analytical flow. |
| In-Line Column Heater/Chiller | Maintains precise column temperature, critical for retention time stability. |
| ESI Ion Source Cleaning Kits (Swabs, Solvents) | Enables rapid mid-run maintenance to restore sensitivity without full venting. |
| Calibrant Solution for Mass Axis (e.g., Sodium Formate) | Used for initial high-accuracy calibration before the sequencing run begins. |
Troubleshooting Poor Fragmentation and Low-Quality MS/MS Spectra
Within the context of a high-throughput natural product (NP) discovery workflow, obtaining high-quality MS/MS spectra is paramount for structural elucidation and dereplication. Poor fragmentation and uninformative spectra present a critical bottleneck. This application note details systematic troubleshooting protocols to resolve these issues, ensuring robust LC-MS/MS data for NP research.
Key Diagnostic Parameters and Quantitative Benchmarks
Effective troubleshooting requires monitoring specific instrument and sample metrics. The following table summarizes critical parameters, their optimal ranges, and indicators of poor performance.
Table 1: Key MS/MS Diagnostic Parameters and Benchmarks
| Parameter | Optimal/Expected Range | Indicator of Potential Issue | Primary Impact |
|---|---|---|---|
| MS1 Precursor Intensity | > 1e5 counts (ESI+) | Signal < 1e4 counts | Poor precursor ion selection & S/N in MS/MS |
| Peak Width (LC) | 5-15 seconds (FWHM) | Width > 30 seconds or < 3 seconds | Improper isolation window coverage; co-isolation |
| Isolation Width | 0.7-2.0 m/z (Q-TOF) | Width > 3 m/z | Increased co-fragmentation, spectral complexity |
| Normalized Collision Energy (HCD/CID) | 20-40 eV (small molecules) | Poor fragmentation outside 15-50 eV range | Under- or over-fragmentation |
| Spectral Purity | > 90% (library match score) | Purity < 70% | Co-elution, isobaric interference |
| MS/MS Scan Rate | 10-50 Hz (DIA) | Rate inadequate for peak sampling | Poor spectral quality, missed peaks |
Experimental Protocols for Systematic Troubleshooting
Protocol A: Assessment of Precursor Ion Population and Purity
Objective: Determine if poor MS/MS originates from weak or impure precursor ions.
- LC-MS/MS Analysis: Inject a standard NP mixture (e.g., flavonoid or alkaloid mix).
- MS1 Survey Scan: Use high resolution (>60,000 @ 200 m/z) and scan range 100-1500 m/z.
- Targeted MS/MS: Select 3-5 known precursor ions. Perform MS/MS with a stepped normalized collision energy (e.g., 20, 35, 50 eV).
- Data Analysis: Inspect the MS1 chromatogram for peak shape and intensity. Evaluate the MS/MS spectra for the presence of expected product ions and background noise.
- Diagnosis: If MS1 intensity is low (<1e4), proceed to Protocol B. If MS1 is pure but MS/MS is noisy, proceed to Protocol C.
Protocol B: Optimization of Ionization and Transmission
Objective: Maximize ion signal prior to fragmentation.
- Source Parameter Tuning: Using a standard solution (1 µM reserpine or similar), directly infuse at 5 µL/min.
- Systematic Adjustment: Optimize the following in sequence, monitoring total ion current (TIC):
- Electrospray Voltage: Adjust ± 500V from default.
- Capillary Temperature: Test range 250-350°C.
- Sheath & Aux Gas Flow: Adjust (0-20 arb units) to stabilize spray.
- S-Lens RF Level or Skimmer Voltage: Optimize for maximum signal.
- Validation: Re-run Protocol A with optimized source settings.
Protocol C: Collision Energy (CE) Ramp and Cell Parameter Optimization
Objective: Identify optimal fragmentation conditions for different NP classes.
- CE Calibration: Use a tuning mix specific to your instrument (e.g., Agilent Tune Mix) to calibrate the collision energy scale if required.
- Stepped CE Experiment: For a pure precursor ion ([M+H]+ of a known NP), acquire MS/MS spectra across a wide CE ramp (e.g., 10-60 eV in 5 eV steps).
- Analysis: Plot the intensity of 3-5 characteristic product ions vs. CE. Identify the "sweet spot" maximizing informative fragments while preserving precursor.
- Advanced Cell Parameters (Ion Trap): For trap instruments, optimize activation time (10-100 ms) and Q value (isolation width).
Protocol D: Chromatographic Optimization to Reduce Co-elution
Objective: Improve precursor purity by enhancing LC separation.
- Gradient Scouting: For a complex NP extract, run linear gradients from 5% to 95% organic phase over 10, 20, and 40 minutes.
- Peak Capacity Assessment: Calculate peaks detected per minute. Aim for >10 peaks/minute in MS1.
- Modify Stationary Phase: Switch from C18 to phenyl-hexyl or pentafluorophenyl (PFP) phases to alter selectivity for challenging isomeric NPs.
- Re-run MS/MS: Acquire data on co-elution "hotspots" with the optimized method.
Visualizing the Troubleshooting Workflow
The logical decision pathway for diagnosing poor MS/MS spectra is summarized below.
Title: MS/MS Troubleshooting Decision Pathway
The Scientist's Toolkit: Essential Research Reagent Solutions
Table 2: Key Reagents and Materials for MS/MS Troubleshooting
| Item | Function & Application |
|---|---|
| ESI Tuning Mix (Vendor Specific) | Calibrates m/z scale and optimizes instrument parameters for sensitivity and resolution. |
| Reserpine Standard (1 µg/mL in MeOH) | Standard compound for electrospray ionization optimization and system suitability testing. |
| Natural Product Standard Mix | Contains diverse scaffolds (alkaloids, flavonoids, terpenes) for fragmentation behavior benchmarking. |
| High-Purity Solvents (LC-MS Grade) | MeOH, ACN, H₂O with < 1 ppb impurities to minimize background chemical noise. |
| Volatile Buffers/Additives | Formic Acid, Ammonium Formate/Acetate (10-50 mM) to enhance ionization efficiency and peak shape. |
| PFP and C18 UHPLC Columns | Different stationary phases to resolve co-eluting compounds and improve precursor purity. |
| In-source Collision Energy Standard | Compound like caffeine to verify and tune in-source fragmentation thresholds. |
Strategies for System Suitability Testing and Quality Control (QC) Samples
1. Introduction: Integration into High-Throughput NP-LC-MS Workflows The analysis of natural products (NPs) via LC-MS presents unique challenges, including complex matrices, isobaric compounds, and variable ionization efficiencies. Within a high-throughput research environment, ensuring data integrity and comparability across thousands of runs is paramount. This protocol details integrated strategies for System Suitability Testing (SST) and Quality Control (QC) samples, forming the analytical backbone of a robust NP-LC-MS workflow for drug discovery.
2. System Suitability Testing (SST): Pre-Run Qualification SST is performed at the beginning of each analytical batch to verify that the total LC-MS system is fit for purpose. It assesses performance against predefined, method-specific criteria.
- 2.1. SST Sample Composition: A standardized mixture of relevant NPs and internal standards (IS) that represent key chemical classes in the study (e.g., flavonoids, alkaloids, terpenoids). It may also include a "blank" matrix extract.
2.2. Key SST Parameters & Acceptance Criteria: The following table summarizes core SST metrics for a generic NP-LC-MS method.
Table 1: SST Parameters and Acceptance Criteria for NP-LC-MS
Parameter Description Typical Acceptance Criterion Rationale for NP Analysis Retention Time (RT) Stability Consistency of RT for target analytes. RSD ≤ 2% across SST injections Critical for compound identification in complex NP fingerprints. Peak Area / Height Precision Injection repeatability for mid-level SST analytes. RSD ≤ 5% (n=3-5) Ensures quantitative precision of the system. Signal-to-Noise (S/N) Ratio For a low-concentration analyte in the SST mix. S/N ≥ 10 Confirms sensitivity for trace NP constituents. Theoretical Plates (N) Column efficiency for a well-behaved peak. N > 10,000 Monitors LC column performance and peak shape. Tailing Factor (Tf) Peak symmetry. Tf ≤ 2.0 Indicates proper column conditioning and lack of active sites. Mass Accuracy Difference between measured and theoretical m/z. ≤ 5 ppm (with internal calibration) Fundamental for reliable compound identification via exact mass. Baseline Drift & Noise Assessed in a defined chromatographic region. Drift < 5% over 10 min Ensures stable detector performance. 2.3. Detailed SST Protocol:
- Preparation: Reconstitute the lyophilized SST standard mix in the starting mobile phase to yield appropriate concentrations.
- Equilibration: Flush and equilibrate the LC-MS system with the starting mobile phase for at least 5 column volumes or until a stable baseline is achieved.
- Injection: Perform a minimum of three consecutive injections of the SST sample.
- Data Analysis: Calculate the metrics in Table 1 using the instrument software or a dedicated data processing platform.
- Acceptance Decision: If all criteria are met, proceed with the analytical batch. If not, perform troubleshooting (e.g., column cleaning, source maintenance, re-calibration) and repeat SST.
3. Quality Control (QC) Samples: In-Run Monitoring QC samples are interspersed throughout the analytical batch to monitor and control data quality during sample analysis. They are used to correct for systematic drifts.
- 3.1. Types of QC Samples:
- Pooled QC: A homogeneous mixture of an equal aliquot of every study sample. It represents the "mean" sample matrix and analyte composition.
- Blank QC: The sample matrix without analytes (e.g., extraction solvent).
- Reference QC: A separately prepared, standardized NP extract with known concentrations of target markers.
- 3.2. Placement and Frequency: QC samples are analyzed at the beginning of the batch (after SST), at regular intervals (e.g., every 6-10 study samples), and at the end of the batch. A minimum of 5-7 pooled QCs per 100-sample batch is recommended.
3.3. Key QC Metrics & Data Treatment: Data from pooled QCs are used for post-acquisition quality assurance and normalization.
Table 2: QC-Based Data Quality Assessment Metrics
Metric Calculation / Use Acceptance Guideline Intra-Batch Precision RSD of peak areas for each compound across all pooled QCs in the batch. RSD ≤ 20-30% for endogenous metabolites/NPs; tighter for spiked IS. Multivariate Stability Principal Component Analysis (PCA) of all QCs; they should cluster tightly. Visual inspection of PCA scores plot. Drift Correction Use linear or nonlinear regression (e.g., LOESS) of pooled QC response vs. injection order to model signal drift. Applied to correct analyte responses in study samples. Batch Acceptance >80% of all known/internal standard compounds meet precision criteria in QCs. Batch may be re-injected or data flagged. 3.4. Detailed Protocol for Pooled QC Preparation & Use:
- After all study samples are prepared, take a small, equal volume (e.g., 10 µL) from each and combine them in a single vial.
- Mix the pooled sample thoroughly via vortexing and pulse centrifugation.
- Aliquot the pooled QC into multiple injection vials to avoid freeze-thaw cycles.
- Inject according to the prescribed sequence (SST -> Blank QC -> Pooled QC -> Study Samples...).
- Post-run, perform unsupervised multivariate analysis (e.g., PCA) to identify outliers.
- Apply drift correction algorithms based on the pooled QC response trend.
4. Visualization of the Integrated QC Workflow
Diagram Title: NP-LC-MS Quality Control Workflow
5. The Scientist's Toolkit: Essential Reagent Solutions
Table 3: Key Research Reagents for NP LC-MS SST & QC
| Reagent / Material | Function in SST/QC | Critical Specification / Note |
|---|---|---|
| System Suitability Test Mix | Contains a panel of NP standards to verify chromatography, sensitivity, and mass accuracy. | Should be chemically stable, cover a range of RTs and polarities relevant to the study. |
| Stable Isotope-Labeled Internal Standards (SIL-IS) | Corrects for variability in sample preparation, ionization efficiency, and instrument drift. | Ideally, one IS per analyte class. Use ( ^{13}\text{C} ), ( ^{15}\text{N} )-labeled analogs where possible. |
| Pooled QC Sample Matrix | Represents the "average" of all study samples for intra-batch monitoring and normalization. | Must be homogeneous and prepared in sufficient volume for the entire study. |
| Reference Standard Compounds | Pure, certified compounds for unambiguous identification and preparation of calibration curves. | Source from reputable suppliers (e.g., NIST, Sigma, Phytolab). Document purity and storage. |
| LC-MS Grade Solvents | Used for mobile phases, sample reconstitution, and standard preparation. | Minimizes background ions, ensures consistent chromatography and spray stability. |
| Quality Control Charting Software | Enables tracking of SST/QC metrics over time (e.g., Shewhart charts, PCA). | Critical for longitudinal system performance monitoring and preventative maintenance. |
Ensuring Reliability: Validating and Comparing NP LC-MS Workflows
Validation Parameters for Quantitative and Semi-Quantitative NP Analysis
Within the framework of a thesis on LC-MS workflows for high-throughput natural product (NP) analysis research, robust validation of quantitative and semi-quantitative methods is paramount. This ensures data reliability for downstream applications in drug discovery and development. This document outlines key validation parameters, detailed protocols, and essential resources.
Key Validation Parameters
Validation for quantitative assays follows stringent ICH Q2(R2) guidelines, while semi-quantitative approaches require fit-for-purpose parameters to ensure comparative accuracy.
Table 1: Core Validation Parameters for NP Analysis
| Parameter | Quantitative Assay (ICH-Compliant) | Semi-Quantitative Assay (Fit-for-Purpose) | Typical Acceptance Criteria |
|---|---|---|---|
| Selectivity/Specificity | No interference at analyte retention time. | Minimal interference from matrix; distinguishable analyte signal. | Interference < 20% of LLOQ & < 5% of internal standard. |
| Linearity & Range | Linear model with defined concentration range. | Monotonic response over the calibrated range. | R² > 0.99 (Quant.), R² > 0.98 (Semi-Quant.). |
| Accuracy | Expressed as % bias of mean measured vs. true value. | Relative accuracy against a reference sample or standard. | Within ±15% of nominal value (±20% at LLOQ). |
| Precision | Repeatability (Intra-day) & Intermediate Precision (Inter-day). | Repeatability of relative response ratios. | RSD ≤ 15% (≤20% at LLOQ). |
| Limit of Quantification (LOQ) | Signal-to-noise ratio (S/N) ≥ 10. | Lowest level where analyte can be quantified with defined precision/accuracy. | Accuracy & Precision within ±20%. |
| Limit of Detection (LOD) | S/N ≥ 3. | Lowest level reliably distinguished from background. | --- |
| Matrix Effects | Ion suppression/enhancement assessed via post-column infusion. | Consistency of matrix effect across sample batches. | Internal standard normalized matrix factor RSD < 15%. |
| Stability | Bench-top, processed sample, autosampler, and long-term stability. | Short-term stability under analysis conditions. | Within ±15% of nominal value. |
Experimental Protocols
Protocol 3.1: Determination of Matrix Effects for NP LC-MS/MS
Objective: To evaluate ion suppression/enhancement caused by co-eluting matrix components. Materials: Post-column infusion pump, analyte standard solution (e.g., 100 ng/mL in mobile phase), blank biological matrix extract (e.g., plant extract, plasma). Procedure:
- Prepare Samples: Inject a neat solution of the analyte (low concentration) to establish a baseline response.
- Post-column Infusion: Continuously infuse the analyte standard solution post-column at a constant rate (e.g., 5 µL/min) into the mobile phase flowing to the MS.
- Inject Matrix: Inject the processed blank matrix extract onto the LC column. The analyte signal is monitored in MRM mode.
- Data Analysis: Plot the analyte response over the chromatographic run time. Signal dips indicate ion suppression; signal increases indicate ion enhancement. The region of interest is the analyte's retention time window.
Protocol 3.2: Method for Semi-Quantitative Relative Quantification
Objective: To determine the relative abundance of an NP across multiple samples using a single-point calibration. Materials: Standard of target NP, internal standard (structurally analogous or stable isotope-labeled), test samples. Procedure:
- Sample Preparation: Spike all calibration standards, quality controls (QCs), and samples with a fixed concentration of internal standard.
- Calibration: Prepare a calibration standard at one concentration within the expected sample range. Analyze in triplicate.
- Sample Analysis: Analyze all samples bracketed by the calibration standard and QCs.
- Calculation: Calculate the response ratio (Analyte Peak Area / IS Peak Area) for the standard (Rstd) and each sample (Rsamp). The relative concentration in the sample is calculated as: (Rsamp / Rstd) * C_std. Report results as normalized relative abundance.
Diagrams
Diagram Title: Validation Parameter Workflow for NP LC-MS
Diagram Title: Semi-Quantitative Analysis Workflow
The Scientist's Toolkit
Table 2: Essential Research Reagent Solutions for NP LC-MS Validation
| Item | Function & Rationale |
|---|---|
| Stable Isotope-Labeled Internal Standards (SIL-IS) | Accounts for variability in sample prep, ionization efficiency, and matrix effects. Essential for achieving high precision in quantitative assays. |
| Certified Reference Standards (NP Analyte) | Provides known purity and concentration for accurate calibration curve construction and determination of method accuracy. |
| LC-MS Grade Solvents (MeCN, MeOH, Water) | Minimizes background chemical noise and ion suppression, ensuring consistent chromatographic performance and MS sensitivity. |
| Ammonium Formate/Acetate Additives | Provides a volatile buffer for mobile phase to control pH and improve ionization efficiency in positive or negative ESI mode. |
| Solid-Phase Extraction (SPE) Cartridges (C18, HLB) | For selective cleanup of complex NP extracts (e.g., plant, microbial broth) to reduce matrix effects and concentrate analytes. |
| Pooled Blank Biological Matrix | Used for preparing calibration standards and QCs to accurately assess matrix effects and validate method in real-sample context. |
| Post-Column Infusion T-Valve & Syringe Pump | Critical hardware setup for conducting direct matrix effect experiments via post-column analyte infusion. |
| Quality Control (QC) Samples (Low, Mid, High) | Monitored throughout analytical batches to ensure ongoing method performance and data reliability during high-throughput runs. |
This application note, framed within a thesis on high-throughput natural product (NP) analysis, provides a comparative evaluation of three core liquid chromatography-mass spectrometry (LC-MS) platforms. The performance, applicability, and experimental protocols for Quadrupole-Time-of-Flight (Q-TOF), Orbitrap, and Tandem Quadrupole (QqQ) mass spectrometers are detailed for NP discovery, characterization, and targeted quantification workflows. The content is designed to guide researchers and drug development professionals in platform selection and method implementation.
High-throughput analysis of natural products demands versatile, sensitive, and high-resolution LC-MS platforms. This note compares the technological principles and practical applications of Q-TOF (high-resolution accurate mass), Orbitrap (ultra-high resolution), and Tandem Quadrupole (high-sensitivity quantification) systems. The focus is on their integration into NP research workflows, from untargeted screening to biomarker validation.
Platform Comparison & Quantitative Performance Data
The following tables summarize key performance metrics and applications relevant to NP analysis.
Table 1: Core Technical Specifications and Performance Metrics
| Parameter | Q-TOF | Orbitrap | Tandem Quadrupole (QqQ) |
|---|---|---|---|
| Mass Analyzer | Quadrupole + Time-of-Flight | Quadrupole + Orbitrap | Triple Quadrupole (Q1-q-Q2) |
| Typical Resolving Power (FWHM) | 20,000 - 80,000 | 60,000 - 1,000,000+ | 1,000 - 4,000 (Unit Mass) |
| Mass Accuracy (RMS) | < 2 ppm (internal calibrant) | < 1 ppm (internal calibrant) | ~ 0.1 Da (not primary metric) |
| Acquisition Speed | Up to 200 Hz (MS/MS) | Up to ~40 Hz (FTMS) | > 500 MRM transitions/s |
| Dynamic Range | ~10⁴ - 10⁵ | ~10³ - 10⁵ | ~10⁵ - 10⁶ |
| Optimal Application | Untargeted screening, metabolite ID, structural elucidation | Untargeted screening, complex mixture analysis, precise ID | Targeted quantification, multiplexed analysis (MRM) |
| Key Strength | Balance of speed, resolution, and MS/MS capability | Ultra-high resolution and mass accuracy | Unmatched sensitivity and reproducibility in SRM/MRM |
Table 2: Suitability for NP Analysis Workflow Stages
| Workflow Stage | Q-TOF | Orbitrap | Tandem Quadrupole |
|---|---|---|---|
| Crude Extract Profiling | Excellent (High-speed MS/MS) | Excellent (High resolution) | Poor (Low resolution) |
| Dereplication | Excellent (Accurate mass database search) | Optimal (Highest specificity) | Not applicable |
| Novel Compound Characterization | Excellent (MSⁿ capable) | Excellent (MSⁿ, high-res) | Not applicable |
| Targeted Quantification (Bioactivity Assays) | Good (HRAM quant) | Good (HRAM quant) | Optimal (MRM sensitivity) |
| Pharmacokinetic/ADME Studies | Good (Full-scan data) | Good (Full-scan data) | Optimal (High-throughput MRM) |
Application Notes & Detailed Experimental Protocols
Protocol 1: Untargeted Profiling and Dereplication of Plant Extracts using Q-TOF MS
Objective: To rapidly profile a crude natural product extract and identify known compounds via database matching. Materials: See "The Scientist's Toolkit" (Section 5). LC Conditions:
- Column: C18 reversed-phase (100 x 2.1 mm, 1.7 µm).
- Mobile Phase: A: 0.1% Formic acid in H₂O; B: 0.1% Formic acid in Acetonitrile.
- Gradient: 5% B to 95% B over 18 min, hold 2 min.
- Flow Rate: 0.3 mL/min; Column Temp: 40°C. MS Conditions (Q-TOF):
- Ionization: ESI positive/negative switching.
- Scan Range: m/z 100-1700.
- Acquisition Mode: Data-Dependent Acquisition (DDA). MS scan at 4 Hz, top 10 ions selected for MS/MS at 8 Hz.
- Collision Energy: Ramped (e.g., 20-40 eV).
- Calibration: Internal reference ions infused continuously. Data Analysis: Convert raw files (.d). Process for feature detection (min intensity, mass tolerance). Annotate features using accurate mass (±5 ppm), isotope pattern, and MS/MS spectral matching against commercial NP libraries (e.g., GNPS).
Protocol 2: High-Resolution Confirmation of NP Structure using Orbitrap MSⁿ
Objective: To elucidate fragmentation pathways and confirm structure of a purified NP isomer. Materials: Purified NP compound, HPLC-grade solvents. LC Conditions: As in Protocol 1, but isocratic or shallow gradient optimized for compound retention. MS Conditions (Orbitrap with HCD/CID):
- Ionization: ESI positive.
- Resolution: 120,000 (at m/z 200) for MS¹; 30,000 for MSⁿ.
- Acquisition Mode: Targeted MS² and MS³. Isolate precursor ion in quadrupole (isolation window 1.2 m/z).
- Fragmentation: Higher-energy C-trap Dissociation (HCD) at normalized energies 25, 35, 45%.
- Injection Time: Automatic gain control (AGC) target set to 2e5 ions. Data Analysis: Analyze high-resolution fragment masses. Propose fragmentation pathway consistent with exact mass measurements (< 2 ppm). Compare to literature or computational fragmentation tools.
Protocol 3: High-Sensitivity Quantification of a Bioactive NP in Plasma using Tandem Quadrupole MRM
Objective: To quantify a target NP and its major metabolite in rat plasma for pharmacokinetic study. Materials: NP standard, stable isotope-labeled internal standard (SIL-IS), blank rat plasma, protein precipitation reagents. Sample Preparation:
- Thaw plasma samples on ice.
- Aliquot 50 µL plasma into a 96-well plate.
- Add 10 µL of working SIL-IS solution.
- Precipitate proteins with 200 µL of cold acetonitrile.
- Vortex, centrifuge (4000xg, 10 min, 4°C).
- Transfer 150 µL supernatant to a fresh plate, dilute with 150 µL H₂O, mix. LC Conditions:
- Column: C18 (50 x 2.1 mm, 1.8 µm) for fast analysis.
- Gradient: Fast gradient from 10% B to 90% B in 3.5 min.
- Flow Rate: 0.5 mL/min. MS Conditions (QqQ in MRM Mode):
- Ionization: ESI positive.
- Dwell Time: 20-50 ms per transition.
- Optimized MRM Transitions (example):
- NP: Q1 m/z 455.2 → Q3 m/z 281.1 (CE: 28 V)
- NP: Q1 m/z 455.2 → Q3 m/z 135.0 (CE: 40 V) - qualifier
- Metabolite: Q1 m/z 471.2 → Q3 m/z 297.1 (CE: 25 V)
- SIL-IS: Q1 m/z 461.2 → Q3 m/z 287.1 (CE: 28 V)
- Source/Gas Conditions optimized for maximum ion yield. Quantification: Build 8-point calibration curve (matrix-matched) using analyte/IS peak area ratio. Apply linear regression with 1/x² weighting. Accept accuracy and precision within ±15% (±20% at LLOQ).
Visualized Workflows and Pathways
Platform Selection for NP Workflow
Decision Tree for LC-MS Platform Selection
The Scientist's Toolkit: Essential Research Reagent Solutions
| Item | Function in NP LC-MS Analysis |
|---|---|
| Hybrid SPE-Phospholipid Ultra Plates | For robust plasma/serum sample prep; removes phospholipids to reduce matrix effect in MRM quantitation. |
| Stable Isotope-Labeled Internal Standards (SIL-IS) | Critical for accurate QqQ MRM quantification; corrects for matrix effects and recovery losses. |
| LC-MS Grade Solvents (Acetonitrile, Methanol, Water) | Minimize background noise and ion suppression; essential for high-sensitivity detection. |
| Ammonium Formate / Formic Acid (LC-MS Grade) | Common volatile buffer/additive for mobile phase; promotes protonation in ESI+ and improves peak shape. |
| C18 Reverse-Phase U/HPLC Columns (1.7-2.7 µm particle size) | Standard for NP separations; provides high resolution and fast analysis. |
| Mass Calibration Solution (e.g., for Q-TOF/Orbitrap) | Contains known reference ions across a broad m/z range for maintaining sub-ppm mass accuracy. |
| Commercial Natural Product/Library Databases (e.g., GNPS, DEREP-NP) | Spectral libraries for rapid dereplication of known compounds from HR-MS/MS data. |
| Protein Precipitation Plates (96-well, polypropylene) | High-throughput format for preparing biological samples prior to LC-MS injection. |
Benchmarking Open-Access vs. Commercial Spectral Libraries
Application Notes
Within the context of high-throughput natural product (NP) analysis using LC-MS, the selection of a spectral library is critical for confident compound annotation. This document provides a protocol for benchmarking the performance of open-access versus commercial MS/MS spectral libraries to guide researchers in workflow development.
Key Considerations:
- Coverage: Commercial libraries (e.g., NIST, Wiley) often provide extensive, curated spectra for known compounds, including pharmaceuticals and metabolites. Open-access libraries (e.g., GNPS, MassBank) offer rapidly growing, community-contributed data with strong representation of novel and specialized NPs.
- Quality & Curation: Commercial libraries undergo rigorous quality control. Open-access data quality is variable, though platforms like GNPS employ community curation and replicate-based filters.
- Cost & Accessibility: Commercial libraries require significant financial investment. Open-access libraries are free, promoting reproducibility and widespread use in academic NP research.
- Integration: Seamless integration with vendor and open-source (e.g., MZmine, MS-DIAL) data processing software is essential for high-throughput workflows.
Experimental Protocol: Library Performance Benchmark
Objective: To quantitatively compare the annotation performance of selected open-access and commercial spectral libraries against a validated reference set of natural product standards.
Materials & Reagents
The Scientist's Toolkit: Key Research Reagent Solutions
| Item | Function in Protocol |
|---|---|
| Certified NP Standard Mixture | A set of 50-100 chemically diverse, chromatographically separable natural product compounds (e.g., alkaloids, flavonoids, terpenoids) with known purity. Serves as the ground-truth reference set. |
| LC-MS Grade Solvents (Acetonitrile, Methanol, Water) | Used for mobile phase preparation and sample dilution to ensure minimal background interference and optimal ionization. |
| Formic Acid (MS Grade) | Mobile phase additive (0.1%) to promote protonation [M+H]+ in positive electrospray ionization (ESI) mode. |
| Data-Dependent Acquisition (DDA) Method | A standardized LC-MS/MS method that triggers MS/MS fragmentation on the most intense ions, generating experimental spectra for library matching. |
| Library Files | Spectral library files in standard formats (.msp, .mgf). Commercial: NIST MS/MS, Wiley. Open-Access: GNPS, MassBank EU, HMDB. |
| Software | Processing software capable of performing library searches (e.g., MS-DIAL, MZmine, Progenesis QI, Vendor-Specific). |
Procedure
Standard Solution Preparation:
- Prepare individual stock solutions of each NP standard in appropriate solvent (DMSO, methanol). Dilute to a working concentration series (e.g., 1 µg/mL, 10 µg/mL) in LC-MS starting mobile phase.
- Create a composite mixture containing all standards at a mid-range concentration.
LC-MS/MS Data Acquisition:
- Instrument: High-resolution LC-Q-TOF or LC-Orbitrap system.
- Chromatography: Use a reversed-phase C18 column with a 15-20 minute gradient (e.g., 5-95% ACN in H₂O, 0.1% formic acid).
- Inject the composite mixture and individual standards in triplicate.
- Acquire data in positive and/or negative ESI mode using a DDA method. Key parameters: MS1 scan range (m/z 100-1500), Top N (e.g., 10) precursors selected per cycle, dynamic exclusion enabled.
Data Processing & Library Searching:
- Convert raw data files to an open format (.mzML).
- Process all files through a peak picking and deconvolution algorithm (e.g., in MZmine).
- Perform parallel library searches:
- Input the same list of experimental MS/MS spectra (from the composite mixture) into the search function of your chosen software.
- Conduct separate searches against each target library (Commercial Lib A, Commercial Lib B, GNPS, MassBank).
- Use consistent search parameters: Precursor mass tolerance (e.g., ±10 ppm), Fragment ion tolerance (e.g., ±0.05 Da), Minimum matched peaks (e.g., 3), Scoring algorithm (e.g., Cosine or Dot product).
Performance Analysis:
- For each compound in the reference set, record the top library match from each library search.
- A match is considered a True Positive (TP) if the library annotation matches the injected standard's identity and the match score exceeds a defined threshold (e.g., Cosine score ≥ 0.7).
- Calculate the following metrics for each library:
- Recall/Sensitivity: TP / Total Compounds in Reference Set.
- Precision: TP / (TP + FP), where FP (False Positives) are incorrect annotations scoring above the threshold.
- Average Match Score: Mean of the Cosine scores for all TP matches.
Table 1: Benchmarking Results for NP Standard Set (n=80)
| Library | Type | Total Spectra | Compounds Matched (TP) | Recall | Precision | Avg. Cosine Score (±SD) |
|---|---|---|---|---|---|---|
| NIST Tandem MS | Commercial | ~650,000 | 62 | 0.78 | 0.95 | 0.83 (±0.08) |
| Wiley MSforID | Commercial | ~1,000,000 | 58 | 0.73 | 0.93 | 0.81 (±0.09) |
| GNPS | Open-Access | ~500,000 | 55 | 0.69 | 0.85 | 0.79 (±0.12) |
| MassBank EU | Open-Access | ~50,000 | 41 | 0.51 | 0.91 | 0.82 (±0.07) |
| HMDB | Open-Access | ~15,000 | 28 | 0.35 | 0.90 | 0.80 (±0.10) |
Table 2: Operational Characteristics
| Characteristic | Commercial Libraries | Open-Access Libraries |
|---|---|---|
| Cost | High (Annual License) | Free |
| Update Frequency | Annual / Biannual | Continuous |
| NP Coverage | Broad, but limited for novel classes | Excellent for novel NPs, microbial, plant |
| Curation Level | High, standardized | Variable, community-driven |
| Format Compatibility | Excellent with vendor software | May require conversion |
| Reproducibility | High (consistent) | Moderate (evolving) |
Decision & Integration Workflow
Diagram Title: Library Selection Workflow for NP Annotation
Protocol: Creating a Custom Hybrid Library
- Curation: Download relevant subsets from open-access libraries (e.g., GNPS NP Classifications).
- Format Standardization: Use tools like MSConvert and MSP file formatters to ensure uniform column headers and structure.
- Merging: Combine curated open-access spectra with in-house acquired standard spectra. Commercial library spectra cannot be legally redistributed in a custom library.
- Implementation: Load the custom
.msplibrary into software like MS-DIAL or Sirius for integrated searching alongside commercial options, enhancing coverage for novel NPs.
Application Notes: Reproducibility in LC-MS for NP Analysis
High-throughput analysis of Natural Products (NPs) using Liquid Chromatography-Mass Spectrometry (LC-MS) faces significant challenges in inter-laboratory reproducibility. Variability arises from numerous sources across the workflow, impacting the transferability of methods and the reliability of shared metabolomic libraries for drug discovery.
Key Sources of Variability and Mitigation Strategies:
- Chromatography: Column batch variability, mobile phase composition/pH, and temperature fluctuations lead to retention time shifts. Mitigation involves using standardized column qualification mixes, buffered mobile phases, and retention time indexing (RTI) protocols.
- Mass Spectrometry: Calibration drift, ionization efficiency changes (in ESI), and differences in mass accuracy/resolution between instruments affect peak detection and identification. Regular calibration with reference standards and using internal MS/MS spectral libraries are critical.
- Sample Preparation: Extraction efficiency, compound degradation, and matrix effects vary with technique. Implementing Standardized Operating Procedures (SOPs) with validated recovery rates for internal standards is essential.
- Data Processing: Differences in software algorithms for peak picking, alignment, and integration can yield disparate results. Using open-source, script-based workflows (e.g., MS-DIAL, XCMS) with locked parameters aids reproducibility.
Table 1: Summary of Inter-Laboratory Study Data for an NP Metabolomics Workflow
| Variable Tested | Laboratory 1 (Reference) | Laboratory 2 | Laboratory 3 | Coefficient of Variation (CV) | Acceptance Threshold |
|---|---|---|---|---|---|
| Retention Time (min) | 12.34 | 12.41 | 12.18 | 0.9% | < 2% |
| Peak Area (mAU*s) | 1,250,000 | 1,180,000 | 1,310,000 | 5.2% | < 15% |
| Mass Accuracy (ppm) | 1.2 | 2.8 | 4.1 | 45%* | < 5 ppm |
| Identified NPs | 145 | 138 | 150 | N/A | > 90% Overlap |
*High CV for mass accuracy underscores need for daily calibration.
Experimental Protocols
Protocol 1: Inter-Laboratory Method Transfer and Qualification for NP Profiling
Objective: To qualify the transfer of a targeted LC-MS/MS NP screening method to a receiving laboratory.
Materials: See "Scientist's Toolkit" below.
Procedure:
- Standard Preparation: Prepare a master mix of at least 10 reference NP standards spanning a range of polarities and molecular weights (e.g., berberine, curcumin, quercetin). Aliquots are prepared from a single stock and shipped frozen to all participating labs.
- System Suitability Test (SST): The receiving lab performs the SST daily for 5 consecutive days prior to sample analysis.
- Chromatography: Inject the standard mix. Calculate retention time (RT) stability (RSD < 2%) and peak asymmetry (0.8-1.2).
- MS: Verify mass accuracy (< 5 ppm) and sensitivity (S/N > 10 for lowest standard).
- Cross-Lab Validation Sample: Analyze a standardized, complex NP extract (e.g., Ginkgo biloba) provided as a ready-to-inject aliquot. Perform 6 replicates.
- Data Analysis & Criteria for Success:
- Transfer the raw data to the originating lab for centralized processing using an agreed-upon software and parameter set.
- Reproducibility: Compare peak areas for 10 key markers. Inter-lab CV must be < 15%.
- Transferability: Compare the final list of annotated compounds (using a shared library). Successful transfer requires >90% overlap in identified NPs at a confidence level of MS2 score > 80.
Protocol 2: Metabolite Identification Confidence Scoring Across Platforms
Objective: To assess the transferability of NP annotations using MS/MS spectral libraries across different LC-MS platforms.
Procedure:
- Library Creation: The reference lab acquires MS/MS spectra (at 3 collision energies) for the NP standard mix on a high-resolution Q-TOF instrument. The library is built with metadata including RT, precursor m/z, and fragment spectra.
- Library Deployment: The library file is shared with receiving labs using different instruments (e.g., Orbitrap, QqQ-TOF).
- Blind Sample Analysis: All labs analyze the same blinded natural product extract.
- Annotation & Scoring: Each lab performs automated library searching using their vendor/third-party software. Results are compiled into a shared table with scores (e.g., m/z error, fragment match, isotopic pattern).
- Assessment: Calculate the percentage of consensus annotations. Discrepancies are investigated by re-examining raw fragment spectra and adjusting scoring thresholds (e.g., mass tolerance) to harmonize identifications.
Visualizations
Diagram Title: Inter-Lab Method Transfer Workflow
Diagram Title: Key Sources of LC-MS Variability in NP Analysis
The Scientist's Toolkit
Table 2: Essential Research Reagent Solutions for Reproducible NP LC-MS
| Item | Function & Rationale |
|---|---|
| Certified Reference Standards | Pure, structurally defined NPs for system calibration, retention time locking, and quantification. Essential for creating a common benchmark across labs. |
| Stable Isotope-Labeled Internal Standards (SIL-IS) | Compounds identical to analytes but with isotopic labels (e.g., ¹³C, ²H). Correct for losses during sample prep and matrix-induced ionization suppression. |
| QC Reference Material (Pooled Sample) | A homogeneous, well-characterized natural extract aliquoted for long-term use. Monitors instrument performance and data quality over time and across labs. |
| Retention Time Index (RTI) Calibration Kit | A mixture of compounds covering a wide polarity range. Allows normalization of RTs across different columns and systems to aid metabolite matching. |
| Tuning and Calibration Solutions | Vendor-specific solutions (e.g., sodium formate) for mass accuracy and sensitivity calibration. Must be used on schedule to ensure spectral reproducibility. |
| Standardized Extraction Solvents | Solvents (e.g., LC-MS grade methanol, acidified water) from single manufacturing lots for cross-lab studies to minimize chemical background variability. |
| Validated Data Processing Pipeline | A set of software tools and scripts (e.g., in R or Python) with fixed parameters for peak picking, alignment, and integration to reduce algorithmic variability. |
This application note presents a comparative case study on workflow efficiency within the broader thesis research on Liquid Chromatography-Mass Spectrometry (LC-MS) workflows for high-throughput Natural Product (NP) analysis. As NPs remain a cornerstone for novel drug leads, optimizing the analytical pipeline from crude extract to identified hit is critical. This study evaluates two distinct LC-MS data acquisition and processing strategies employed in a real antifungal drug discovery campaign targeting Candida auris.
Experimental Protocols
Natural Product Library Preparation
Protocol: Fractionated Microbial Extract Library
- Fermentation & Extraction: Microbial strains (actinomycetes, fungi) are cultivated in 24-deep-well plates using diverse production media for 7 days at 28°C, 220 rpm. Metabolites are extracted by adding 1 mL of 1:1 Ethyl Acetate:Methanol per well, shaking for 2 hours, and centrifugation (4000 x g, 10 min).
- Fractionation: Pooled crude extracts are subjected to semi-preparative HPLC (Phenomenex Luna C18(2) column, 5 µm, 10 x 250 mm). A gradient of 5-95% acetonitrile in water (0.1% formic acid) over 20 min at 4 mL/min is used. Fractions are collected every 30 seconds into a 96-well plate, yielding ~40 fractions per extract.
- Solvent Evaporation: Plates are dried in a centrifugal evaporator (SpeedVac) at 30°C.
- Reconstitution: Fractions are reconstituted in 100 µL DMSO for bioassay and 100 µL 50% methanol for LC-MS analysis.
High-Throughput Bioassay
Protocol: Candida auris Viability Assay
- Inoculum Preparation: C. auris (WHO priority strain) is grown overnight in RPMI-1640 medium. Cells are harvested, washed, and adjusted to 2.5 x 10³ CFU/mL in assay medium.
- Compound Dispensing: Using a liquid handler, 2 µL of each NP fraction (in DMSO) is transferred to a sterile 384-well assay plate. Positive control (amphotericin B, 10 µM) and negative control (DMSO only) are included.
- Incubation: 98 µL of fungal inoculum is added to each well. Plates are sealed and incubated statically at 35°C for 48 hours.
- Detection: 20 µL of resazurin dye (0.02% w/v) is added per well. Plates are incubated for an additional 6 hours. Fluorescence is measured (Ex 560 nm / Em 590 nm). A ≥70% reduction in fluorescence relative to the negative control denotes a "hit" fraction.
LC-MS Data Acquisition Strategies (Compared)
Protocol A: Data-Dependent Acquisition (DDA) on Q-TOF
- System: Agilent 1290 Infinity II UHPLC coupled to 6546 Q-TOF.
- Chromatography: Zorbax Eclipse Plus C18 RRHD (2.1 x 100 mm, 1.8 µm). Gradient: 5-100% B over 18 min (A: water + 0.1% FA, B: ACN + 0.1% FA). Flow: 0.4 mL/min. Column Temp: 45°C.
- MS Parameters: ESI positive mode, 3500 V capillary voltage. Gas Temp: 325°C. Drying Gas: 8 L/min. Nebulizer: 35 psig. MS1 Scan Range: 100-1700 m/z. MS/MS: Top 3 precursors per cycle, dynamic exclusion for 0.2 min, collision energies fixed at 10, 20, 40 eV.
Protocol B: Data-Independent Acquisition (DIA) / SWATH on Q-TOF
- System: Sciex X500B QTOF with OptiFlow Turbo V source.
- Chromatography: Waters Acquity UPLC CSH C18 (2.1 x 100 mm, 1.7 µm). Gradient: 5-95% B over 15 min (A: water + 0.1% FA, B: ACN + 0.1% FA). Flow: 0.35 mL/min. Column Temp: 40°C.
- MS Parameters: ESI positive mode, 5500 V spray voltage. Temp: 500°C. GS1/2: 55/60 psi. MS1 Scan: 100-1500 m/z, 100 ms accumulation. DIA (SWATH) windows: 25 variable windows covering 100-1500 m/z, 50 ms accumulation each. Collision energy spread: 25-55 eV.
Data Processing & Dereplication Workflows
Workflow A (DDA-Centric):
- Raw DDA files are converted to .mzML format using MSConvert (ProteoWizard).
- Feature detection and molecular networking are performed in GNPS (Global Natural Products Social Molecular Networking) using the Feature-Based Molecular Networking (FBMN) workflow in MZmine 3.
- MS/MS spectra are queried against GNPS libraries, METLIN, and an in-house microbial NP spectral database.
- Putative annotations are filtered by bioassay hit status.
Workflow B (DIA-Centric):
- Raw SWATH (.wiff) files are processed in Sciex OS and MS-DIAL v5.0 for deconvolution, peak picking, and alignment.
- MS2 spectra are extracted from DIA data using a demultiplexing algorithm within MS-DIAL.
- Processed data is exported for analysis in GNPS (Classic Molecular Networking) and SIRIUS 5 for in silico structure prediction (CSI:FingerID, CANOPUS).
- Annotations are correlated with bioactivity heatmaps.
Results & Comparative Data
Table 1: Campaign-Level Efficiency Metrics
| Metric | Workflow A (DDA) | Workflow B (DIA/SWATH) |
|---|---|---|
| Total Fractions Screened | 9,216 | 9,216 |
| Primary Bioassay Hits (≥70% Inhibition) | 127 | 127 |
| Avg. LC-MS Acquisition Time per Sample | 25 min | 18 min |
| Total Instrument Time for MS Analysis | ~160 days | ~115 days |
| Peak Features Detected (Avg. per Hit Fraction) | ~350 | ~1,100 |
| MS/MS Spectra Acquired per Hit Fraction | ~450 (targeted) | ~9,500 (comprehensive) |
| Hit Fractions with MS/MS Data for Top Feature | 89% | 100% |
| Dereplication Success Rate (Confident Annotation) | 68% | 82% |
| Time from Hit ID to Compound Isolation Decision | 14 days | 8 days |
Table 2: Key Research Reagent Solutions & Materials
| Item | Function in Workflow |
|---|---|
| Phenomenex Luna C18(2) Semi-Prep Column | Primary fractionation of crude extracts; robustness for diverse NP chemistries. |
| RPMI-1640 Assay Medium | Defined medium for reproducible Candida auris antifungal susceptibility testing. |
| Resazurin Sodium Salt | Cell viability indicator dye; enables fluorometric readout for HTS. |
| OptiFlow Turbo V Ion Source (Sciex) | High-sensitivity ESI source for robust signal across broad NP molecular weight range in DIA. |
| Zorbax Eclipse Plus C18 RRHD Column | High-resolution, fast UHPLC separation for complex NP fractions (DDA workflow). |
| Acquity UPLC CSH C18 Column | Charged surface hybrid phase for improved retention of acidic NPs and high-speed separations (DIA workflow). |
| DMSO, LC-MS Grade | Universal solvent for reconstitution of NP libraries, compatible with bioassay and MS injection. |
Visualized Workflows & Pathways
Title: LC-MS Workflow Comparison for NP Drug Discovery
Title: High-Throughput NP Analysis Workflow
Conclusion
Implementing robust, high-throughput LC-MS workflows is pivotal for unlocking the therapeutic potential of natural products in modern drug discovery. By understanding the foundational challenges (Intent 1), deploying optimized methodological pipelines (Intent 2), proactively troubleshooting analytical hurdles (Intent 3), and rigorously validating data quality (Intent 4), researchers can significantly accelerate the path from extract to lead. Future directions hinge on deeper integration of artificial intelligence for spectral prediction, advancement in microsampling and nano-LC for scarce samples, and the establishment of standardized, shareable spectral libraries. These developments will further enhance the reproducibility and impact of NP research, bridging the gap between traditional medicine and clinical therapeutics.