Beyond Bioactivity: Navigating the Complex ADMET Landscape of Natural Product Drug Candidates
This article addresses the critical ADMET (Absorption, Distribution, Metabolism, Excretion, and Toxicity) challenges uniquely faced by natural product leads in drug discovery and development.
Beyond Bioactivity: Navigating the Complex ADMET Landscape of Natural Product Drug Candidates
Abstract
This article addresses the critical ADMET (Absorption, Distribution, Metabolism, Excretion, and Toxicity) challenges uniquely faced by natural product leads in drug discovery and development. Targeted at researchers and development professionals, we provide a comprehensive analysis spanning from foundational understanding of inherent physicochemical complexities to advanced methodological solutions. We explore the structural diversity of NPs that impedes solubility and permeability, delve into modern in vitro and in silico tools for prediction, offer strategies to overcome metabolic instability and toxicity, and validate approaches through case studies. The conclusion synthesizes key takeaways, emphasizing the integration of traditional knowledge with cutting-edge technology to unlock the full therapeutic potential of nature's chemical arsenal.
Why Nature's Complexity Creates ADMET Hurdles: The Inherent Challenges of NPs
The discovery of potent bioactive compounds from natural sources presents a central paradox in drug discovery. While natural products (NPs) are an unparalleled source of novel chemical scaffolds with high affinity for biological targets, they frequently exhibit poor pharmacokinetic (ADMET: Absorption, Distribution, Metabolism, Excretion, and Toxicity) properties. This whitepaper, framed within a broader thesis on ADMET challenges in NP research, explores the molecular origins of this disconnect and provides a technical guide for researchers to navigate these challenges.
The Core of the Paradox: Structural Drivers
Natural products evolve for ecological function, not human drug-likeness. Their structural features, while enabling high target affinity, often conflict with the requirements for systemic administration.
Table 1: Structural Features Driving the NP Bioactivity-ADMET Paradox
| Structural Feature | Contribution to High Bioactivity | ADMET Liability |
|---|---|---|
| High Molecular Weight (>500 Da) | Enables extensive target binding interfaces, high specificity. | Poor passive membrane permeability, low oral bioavailability. |
| Excessive H-Bond Donors/Acceptors | Key for forming strong, specific interactions with target proteins. | Poor passive diffusion across lipid membranes (violates Lipinski's Rule of 5). |
| High Rotatable Bond Count | Conformational flexibility for induced-fit target binding. | Increased metabolic instability, faster clearance. |
| High Topological Polar Surface Area (TPSA) | Correlates with specific polar interactions at target site. | Impaired intestinal absorption and blood-brain barrier penetration. |
| Lipophilic Moieties (e.g., polycyclic rings) | Engages in critical hydrophobic interactions in binding pockets. | Leads to poor aqueous solubility, formulation challenges, promiscuity/toxicity. |
| Reactive Functional Groups | Can form covalent bonds for potent, irreversible inhibition. | High risk of off-target reactivity, metabolic activation (idiosyncratic toxicity). |
Quantitative Analysis: NP Leads vs. Approved Drugs
A comparative analysis of key physicochemical properties highlights the ADMET challenge space for NP-derived leads.
Table 2: Property Distribution: NPs vs. Approved Oral Drugs Data sourced from recent ChEMBL and DrugBank analyses.
| Property | Typical NP Lead Range | Typical Oral Drug Range | % of NPs Beyond "Drug-Like" Space |
|---|---|---|---|
| Molecular Weight (Da) | 450 - 900 | 200 - 500 | ~65% > 500 |
| cLogP | 2 - 7 | 1 - 5 | ~40% > 5 |
| H-Bond Donors | 3 - 8 | ≤ 5 | ~55% > 5 |
| H-Bond Acceptors | 6 - 15 | ≤ 10 | ~70% > 10 |
| Topological PSA (Ų) | 120 - 250 | 40 - 120 | ~80% > 140 |
| Rotatable Bonds | 5 - 15 | ≤ 10 | ~60% > 10 |
Experimental Protocols for ADMET Profiling of NP Leads
Early and integrated ADMET screening is critical for derisking NP leads.
Protocol 1: Parallel Artificial Membrane Permeability Assay (PAMPA)
Purpose: Predict passive transcellular absorption potential. Reagents:
- PAMPA Plate System: Donor (apical) and acceptor (basolateral) 96-well plates with a filter membrane.
- Phospholipid Solution: 1-2% w/v L-α-phosphatidylcholine in dodecane.
- Test Compound: NP lead stock solution in DMSO (10 mM).
- Assay Buffers: Donor buffer: pH 5.5 (simulating gastric) or 6.5 (duodenal). Acceptor buffer: pH 7.4 PBS.
- Quantification Method: LC-MS/MS or UV-plate reader.
Procedure:
- Membrane Formation: Coat filter plate with 5 µL of phospholipid solution.
- Plate Assembly: Fill acceptor plate with 300 µL/well of PBS pH 7.4. Place donor plate on top.
- Dosing: Add 150 µL of NP solution (50-100 µM in appropriate donor buffer) to donor wells. Include control compounds (e.g., high/low permeability standards).
- Incubation: Assemble sandwich and incubate at 25°C for 4-6 hours without agitation.
- Sampling & Analysis: Disassemble plates. Analyze compound concentration in donor and acceptor wells via LC-MS/MS.
- Calculation: Determine effective permeability (Pe) using the equation: Pe = -{ln(1- [Drug]acceptor/[Drug]equilibrium)} / (A * (1/VD + 1/VA) * t), where A is filter area, V is volume, t is time.
Protocol 2: Metabolic Stability in Human Liver Microsomes (HLM)
Purpose: Assess Phase I metabolic turnover. Reagents:
- Human Liver Microsomes (HLM): 20 mg/mL protein stock.
- NADPH Regenerating System: Solution A: NADP+ (10 mM), Solution B: Glucose-6-phosphate (50 mM), Solution C: Glucose-6-phosphate dehydrogenase (10 U/mL in 5 mM sodium citrate).
- Test Compound: 1 mM stock in DMSO.
- Stop Solution: Acetonitrile with internal standard.
- LC-MS/MS System.
Procedure:
- Incubation Preparation: Prepare main incubation mix (0.5 mg/mL HLM, 1 µM NP in 0.1 M phosphate buffer, pH 7.4). Pre-incubate at 37°C for 5 min.
- Reaction Initiation: Add pre-warmed NADPH regenerating system (1 mM NADP+, 3.3 mM G-6-P, 0.4 U/mL G-6-P-DH) to initiate reaction. Final volume: 100 µL. Run in triplicate.
- Time Course Sampling: Remove 20 µL aliquots at T = 0, 5, 10, 20, 30, 60 min into 80 µL ice-cold stop solution.
- Sample Processing: Vortex, centrifuge (4000xg, 15 min, 4°C). Transfer supernatant for LC-MS/MS analysis.
- Data Analysis: Plot ln(% parent remaining) vs. time. Determine in vitro half-life (t1/2) and intrinsic clearance (CLint = (0.693 / t1/2) / [microsomal protein concentration]).
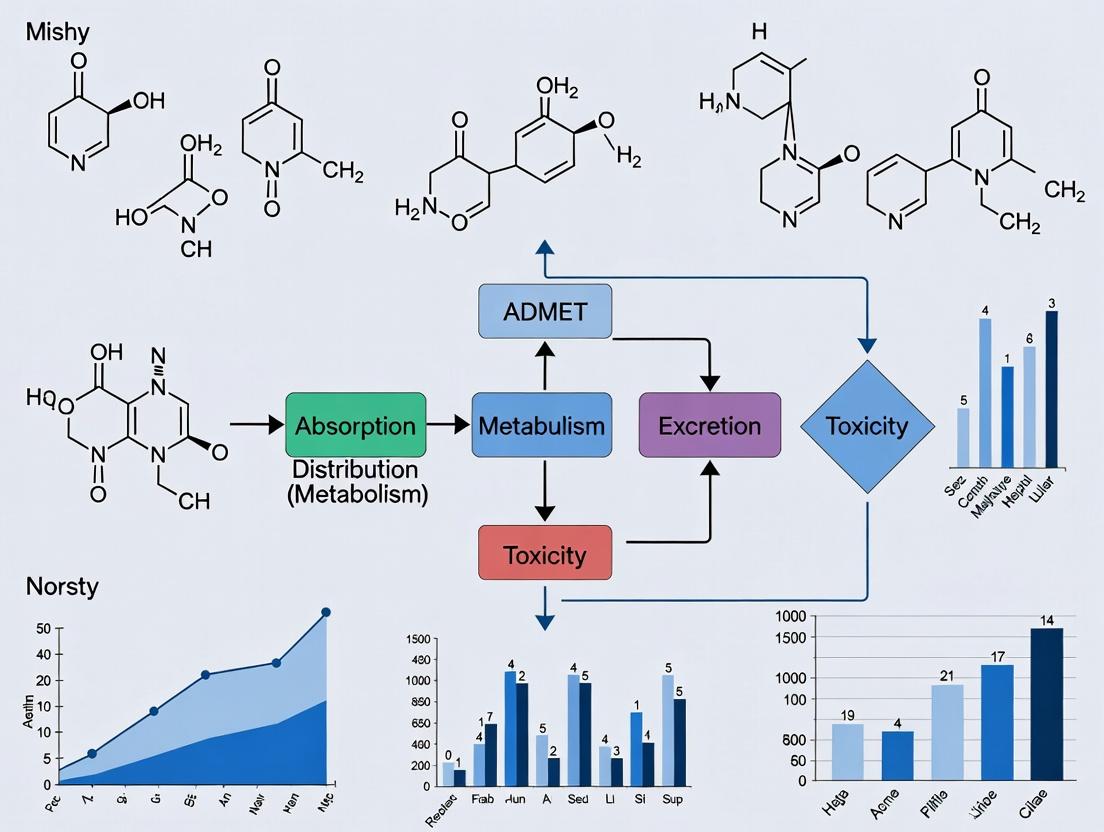
Pathway Analysis: Navigating the ADMET Optimization Cycle
A systematic approach is required to improve the ADMET profile of a bioactive NP while preserving potency.
Diagram Title: The ADMET Optimization Cycle for Natural Product Leads
Common Optimization Strategies:
- Bioisosteric Replacement: Swap metabolically labile or toxogenic groups (e.g., ester to amide, catechol to pyridine).
- Scaffold Simplification: Remove non-essential chiral centers or rings to reduce MW and complexity.
- Prodrug Derivatization: Mask polar groups (acids, phenols, amines) to enhance permeability, with enzymatic cleavage in vivo.
- Formulation Engineering: For insoluble NPs, develop nanoformulations (liposomes, polymeric nanoparticles) to enhance delivery.
The Scientist's Toolkit: Key Research Reagent Solutions
Table 3: Essential Materials for NP ADMET Profiling
| Reagent / Material | Supplier Examples | Function in ADMET Assessment |
|---|---|---|
| Caco-2 Cell Line | ATCC, ECACC | Gold-standard in vitro model for predicting intestinal absorption and efflux transporter (P-gp) interaction. |
| Pooled Human Liver Microsomes (HLM) | Corning, Thermo Fisher, XenoTech | Evaluate Phase I metabolic stability and identify metabolic hot spots. |
| Recombinant CYP Isozymes | Sigma-Aldrich, BD Biosciences | Pinpoint specific cytochrome P450 enzymes responsible for metabolism. |
| hERG-CHO Cell Line | ChanTest, Eurofins | Screen for potential cardiotoxicity via inhibition of the hERG potassium channel. |
| Phospholipid Vesicle Permeability Assay (PVPA) | N/A | A biomimetic permeability model using vesicles for passive and active transport insight. |
| Human Plasma | BioIVT, SeraCare | Determine plasma protein binding (equilibrium dialysis) and stability. |
| Cryopreserved Human Hepatocytes | Lonza, Life Technologies | Integrated assessment of Phase I/II metabolism, transporter effects, and toxicity. |
| PAMPA Evolution System | pION | High-throughput passive permeability screening. |
| LC-MS/MS System (e.g., Triple Quadrupole) | Sciex, Waters, Agilent | Sensitive and specific quantification of NPs and metabolites in complex biological matrices. |
| Metabolite Identification Software (e.g., Metabolynx, Compound Discoverer) | Waters, Thermo Fisher | Facilitates the identification of metabolic soft spots from high-resolution MS data. |
The ADMET paradox for natural product leads is a formidable but navigable challenge. It necessitates a shift from a purely bioactivity-driven screening paradigm to an integrated approach where ADMET properties are evaluated and optimized in parallel with target potency. By leveraging modern in vitro screening protocols, understanding the structural determinants of ADMET, and applying strategic medicinal chemistry, researchers can successfully bridge the gap between potent natural bioactive compounds and viable drug candidates. The future of NP-based drug discovery lies in this balanced, multi-parameter optimization.
Natural products (NPs) have historically been a prolific source of novel pharmacophores. However, their development into viable drugs is hampered by significant ADMET (Absorption, Distribution, Metabolism, Excretion, and Toxicity) challenges. These challenges are intrinsically linked to their complex physicochemical properties. This whitepaper provides an in-depth technical analysis of three critical molecular descriptors—Molecular Weight (MW), Flexibility (commonly quantified by the number of Rotatable Bonds, RB), and Lipophilicity (LogP)—and their definitive impact on the solubility and permeability of NP-derived leads. Understanding these relationships is essential for guiding the rational derivatization and optimization of natural product scaffolds to improve drug-likeness while preserving biological activity.
Core Physicochemical Properties: Definitions and Quantitative Benchmarks
Molecular Weight (MW)
Definition: The sum of the atomic masses of all atoms in a molecule. It is a primary descriptor of molecular size. Impact: Higher MW generally correlates with decreased solubility (due to decreased entropy of dissolution) and can hinder passive diffusion across biological membranes. It also influences other properties like melting point.
Molecular Flexibility (Rotatable Bonds, RB)
Definition: The number of non-terminal, non-ring single bonds, excluding amide C-N bonds. It is a key measure of conformational freedom. Impact: Increased flexibility (high RB) can improve binding entropy but often negatively impacts oral bioavailability by reducing membrane permeability (due to the entropic penalty of adopting a conformation suitable for membrane passage) and can increase metabolic instability.
Lipophilicity (LogP)
Definition: The base-10 logarithm of the partition coefficient (P) of a compound between n-octanol and water at equilibrium. It quantifies the relative affinity for lipid vs. aqueous environments. Impact: LogP is a paramount factor governing both solubility and permeability. An optimal LogP range is crucial for balancing aqueous solubility (needed for dissolution) and lipophilicity (needed for membrane permeation).
Table 1: Established "Rule-of-5" and Extended Guidelines for Drug-Likeness
| Property | Lipinski's Rule of 5 Threshold (for Oral Drugs) | Typical Range for Optimal Oral Bioavailability | Common Natural Product Violation Status |
|---|---|---|---|
| Molecular Weight (MW) | ≤ 500 Da | 200 - 500 Da | Frequently >500 Da |
| Octanol-Water LogP | ≤ 5 | 1 - 3 (or MLogP ≤ 4.15) | Often too high or too low |
| Hydrogen Bond Donors (HBD) | ≤ 5 | ≤ 5 | Variable |
| Hydrogen Bond Acceptors (HBA) | ≤ 10 | ≤ 10 | Variable |
| Rotatable Bonds (RB) | (Not in original Ro5) | ≤ 10 | Frequently >10 |
| Topological Polar Surface Area (TPSA) | (Not in original Ro5) | ≤ 140 Ų | Often large due to glycosylation |
Table 2: Impact of Descriptors on Solubility & Permeability
| Descriptor | Impact on Aqueous Solubility | Impact on Passive Permeability (e.g., Caco-2, PAMPA) | Mechanistic Rationale |
|---|---|---|---|
| High MW (>500 Da) | Generally decreases | Decreases | Larger molecular volume disrupts water structure (unfavorable ΔGsolv); increased cross-sectional area impedes membrane diffusion. |
| High Rotatable Bonds (>10) | Minor direct effect | Significantly decreases | Increased entropic penalty for adopting the restricted conformation required for membrane translocation. |
| High LogP (>5) | Decreases (hydrophobic effect) | Increases, then plateaus or decreases (beyond ~5) | Enhances partitioning into lipid bilayer, but excessively high LogP leads to poor desolvation or sequestration in the membrane. |
| Low LogP (<0) | Increases | Decreases | Favors aqueous phase, leading to poor membrane partitioning and permeability. |
Experimental Protocols for Key Determinations
Protocol for Measuring LogP/D (Shake-Flask Method)
Objective: To experimentally determine the n-octanol/water partition coefficient (LogP) or distribution coefficient (LogD at a specific pH). Materials: Test compound, n-octanol (saturated with water), aqueous buffer (e.g., phosphate buffer pH 7.4, saturated with n-octanol), analytical vials, centrifuge, HPLC-UV or LC-MS. Procedure:
- Pre-saturation: Equilibrate n-octanol and buffer by mixing overnight and separating phases before use.
- Partitioning: Dissolve the compound in a known volume (e.g., 1-2 mL) of one phase (typically the phase predicted to have lower solubility) in a glass vial. Add an equal volume of the other phase.
- Agitation & Separation: Shake the mixture vigorously for 1 hour at constant temperature (e.g., 25°C). Centrifuge to achieve complete phase separation.
- Quantification: Carefully sample each phase and dilute as necessary. Analyze the concentration in each phase using a validated HPLC-UV or LC-MS method.
- Calculation:
- P or D = Coctanol / Cwater
- LogP (or LogD) = log10(P or D)
Protocol for Kinetic Solubility Measurement (Nephelometry)
Objective: To determine the solubility of a compound under physiologically relevant conditions (pH 7.4 buffer) in a high-throughput manner. Materials: DMSO stock solution of compound, 96-well microtiter plates, phosphate buffered saline (PBS, pH 7.4), nephelometer or plate reader capable of detecting light scattering. Procedure:
- Sample Preparation: Add a small aliquot of the DMSO stock solution (e.g., 1-2 μL) to each well of a 96-well plate. Dilute rapidly with PBS buffer (e.g., 200 μL) to achieve the final desired concentration range (e.g., 1-500 μM). The final DMSO concentration should be ≤1%.
- Incubation: Shake the plate gently for a defined period (e.g., 1 hour) at room temperature.
- Measurement: Measure the turbidity/nephelometry signal of each well. A sharp increase in light scattering indicates precipitation.
- Data Analysis: The solubility limit is defined as the highest concentration where the nephelometry signal remains at baseline levels.
Protocol for Passive Permeability Assessment (PAMPA)
Objective: To predict passive transcellular permeability, independent of active transport mechanisms. Materials: PAMPA plate (donor and acceptor plates), filter membrane coated with lipid (e.g., lecithin in dodecane), test compound, PBS pH 7.4 (donor) and pH 7.4 or 5.5 (acceptor), UV plate reader or LC-MS. Procedure:
- Plate Preparation: Fill the acceptor wells with buffer. Carefully place the lipid-impregnated filter membrane on top.
- Donor Addition: Add the compound solution in donor buffer to the donor plate.
- Assembling & Incubation: Invert the donor plate and place it on top of the acceptor plate/membrane sandwich. Incubate for 2-6 hours undisturbed.
- Sampling & Analysis: After incubation, separate the plates. Quantify compound concentration in both donor and acceptor compartments.
- Calculation: Calculate the apparent permeability (Papp) using the formula: Papp = (VA / (Area * Time)) * (CA / CD,initial), where VA is acceptor volume, Area is membrane area, Time is incubation time, CA is acceptor concentration, and CD,initial is the initial donor concentration.
Visualization of Relationships and Workflows
Title: Interplay of MW, Flexibility, and LogP on ADMET
Title: Kinetic Solubility Assay Protocol
The Scientist's Toolkit: Key Research Reagent Solutions
Table 3: Essential Materials for Solubility & Permeability Studies
| Item/Reagent | Function/Benefit | Example Product/Catalog |
|---|---|---|
| n-Octanol (Water-Saturated) | Standard lipid phase for LogP/D shake-flask experiments. Must be pre-saturated to ensure volume stability. | Sigma-Aldrich, O4502 |
| Biorelevant Buffers (FaSSIF/FeSSIF) | Surfactant-containing buffers simulating intestinal fluids for enhanced predictability of solubility and dissolution. | Biorelevant.com, FaSSIF/FeSSIF Powder |
| PAMPA Plate Systems | Ready-to-use plates with lipid-impregnated filters for high-throughput passive permeability screening. | Corning Gentest, BD BioCoat |
| Caco-2 Cell Line | Human colon adenocarcinoma cell line forming polarized monolayers for model intestinal permeability and transport studies. | ATCC, HTB-37 |
| LC-MS/MS System | Gold-standard for sensitive and specific quantification of compounds in complex matrices (e.g., from solubility/permeability assays). | Agilent 6470, SCIEX Triple Quad |
| High-Throughput Nephelometer | Enables rapid, plate-based kinetic solubility measurements by detecting light scattering from precipitated compound. | BMG Labtech, PHERAstar |
| Molecular Property Prediction Software | Computes LogP, MW, RB, TPSA, etc., from structure for virtual screening and property-based design. | OpenEye, MOE, Schrödinger Suite |
Within the paradigm of natural product drug discovery, the inherent stereochemical complexity of leads presents a profound ADMET (Absorption, Distribution, Metabolism, Excretion, and Toxicity) challenge. Chiral centers dictate three-dimensional molecular architecture, which in turn governs interactions with biological systems—from passive diffusion across membranes to stereospecific binding at protein targets. This whitepaper provides a technical dissection of how stereochemistry influences two critical early-phase parameters: absorption and target specificity, framing the discussion within the overarching thesis of optimizing natural product leads for developability.
The Stereochemical Landscape of Natural Products
Natural products are replete with chiral centers. This complexity, while a source of high affinity and selectivity, introduces significant hurdles in drug development.
Table 1: Prevalence of Chirality in Natural Product-Derived Drugs
| Drug Class | Example Compound | Number of Chiral Centers | Bioactive Stereoisomer |
|---|---|---|---|
| Macrolide Antibiotic | Erythromycin A | 18 | Specific absolute configuration required |
| Alkaloid | Quinine | 4 | (8R,9S)-configuration |
| Terpenoid | Artemisinin | 7 | (3R,5aS,6R,8aS,9R,10S,12R,12aR)-configuration |
| Glycopeptide Antibiotic | Vancomycin | Multiple (complex atropisomerism) | Specific chiral and conformational arrangement |
Stereochemistry and Absorption
Absorption, primarily via passive transcellular diffusion, is influenced by a molecule's physicochemical properties, which are stereochemistry-dependent.
Impact on Physicochemical Properties
- Log P/D: Enantiomers have identical calculated Log P values but can exhibit different experimental partition coefficients due to differential interactions with chiral components of the solvent system or biomembranes.
- Solubility: Diastereomers have different melting points and crystal lattice energies, leading to different aqueous solubilities.
Table 2: Comparative ADMET Properties of Thalidomide Enantiomers
| Property | (R)-Thalidomide | (S)-Thalidomide |
|---|---|---|
| Passive Permeability (Papp x10^-6 cm/s) | ~20 | ~20 |
| Aqueous Solubility (mg/mL) | Comparable | Comparable |
| Primary Pharmacological Activity | Sedative | Teratogenic |
| In Vivo Interconversion | Yes (in plasma) | Yes (in plasma) |
Note: Thalidomide highlights that while passive absorption may not be stereoselective, toxicity and activity are critically so, and in vivo interconversion is a major complicating factor.
Experimental Protocol: Assessing Stereoselective Permeability (Caco-2 Assay)
Objective: To determine if the transport of a chiral natural product lead across intestinal epithelium is stereoselective.
Methodology:
- Cell Culture: Grow Caco-2 cells on semi-permeable Transwell inserts for 21-25 days to form fully differentiated, polarized monolayers. Validate monolayer integrity by measuring Transepithelial Electrical Resistance (TEER > 300 Ω·cm²) and Lucifer Yellow permeability (< 1% per hour).
- Dosing Solution Preparation: Prepare a racemic mixture or individual enantiomers/diastereomers of the test compound in transport buffer (e.g., HBSS, pH 7.4). Use a physiologically relevant concentration (e.g., 10 µM).
- Bidirectional Transport:
- A→B (Apical to Basolateral): Add dosing solution to the apical chamber. Sample from the basolateral chamber at defined time points (e.g., 30, 60, 90, 120 min).
- B→A (Basolateral to Apical): Add dosing solution to the basolateral chamber. Sample from the apical chamber at the same intervals.
- Sample Analysis: Immediately quench samples with acetonitrile. Analyze using a stereospecific analytical method, typically Chiral High-Performance Liquid Chromatography (HPLC) or LC-MS/MS with a chiral stationary phase (e.g., amylose- or cellulose-derived columns).
- Data Calculation:
- Apparent Permeability (Papp) = (dQ/dt) / (A * C₀) where dQ/dt is the transport rate, A is the membrane area, and C₀ is the initial donor concentration.
- Efflux Ratio (ER) = Papp(B→A) / Papp(A→B). An ER >> 1.5 suggests active efflux, which may be stereoselective.
Stereochemistry and Target Specificity
The "lock and key" principle of molecular recognition is inherently three-dimensional. A single enantiomer typically provides the optimal fit for a chiral protein binding pocket.
Mechanisms of Stereospecific Recognition
- Three-Point Attachment Model: For high-affinity binding, a molecule typically requires simultaneous interactions at three distinct sites on the target. Enantiomers cannot satisfy all these interactions identically with a chiral protein.
- Conformational Induction: Binding of one enantiomer can induce a specific, productive conformation in the target protein, while the other enantiomer may induce an inactive state.
Experimental Protocol: Determining Enantiomeric Binding Affinity (Surface Plasmon Resonance - SPR)
Objective: To measure the binding kinetics (ka, kd) and affinity (KD) of individual enantiomers for a purified target protein.
Methodology:
- Ligand Immobilization: Immobilize the purified, recombinant target protein on a CMS sensor chip via amine coupling to create the active flow cell. A reference flow cell is activated and deactivated without protein.
- Analyte Preparation: Prepare serial dilutions of each purified enantiomer in running buffer (e.g., PBS-P+, pH 7.4). Use a concentration range spanning expected KD (e.g., 0.1x to 10x KD).
- Binding Kinetics Experiment:
- Inject each analyte concentration over the reference and active flow cells at a constant flow rate (e.g., 30 µL/min) for an association phase (e.g., 120 s).
- Switch to running buffer for the dissociation phase (e.g., 180 s).
- Regenerate the surface with a mild regeneration solution (e.g., 10 mM glycine, pH 2.0) to remove bound analyte.
- Data Analysis: Subtract the reference cell sensorgram from the active cell sensorgram. Fit the resulting data to a 1:1 binding model using the SPR evaluation software to obtain the association rate constant (ka), dissociation rate constant (kd), and the equilibrium dissociation constant (KD = kd/ka). Compare KD values between enantiomers.
Visualizing Core Concepts and Workflows
Stereochemistry Impacts on ADMET Profile
Stereoselective Permeability Assay Workflow
The Scientist's Toolkit: Key Research Reagents & Materials
Table 3: Essential Tools for Stereochemical ADMET Research
| Item | Function | Key Consideration |
|---|---|---|
| Caco-2 Cell Line | Human colorectal adenocarcinoma cell line; forms polarized monolayers modeling intestinal epithelium for permeability studies. | Use low-passage cells; rigorous quality control for monolayer integrity (TEER) is mandatory. |
| Transwell Permeable Supports | Polycarbonate or polyester membrane inserts for growing cell monolayers, enabling separate apical and basolateral compartment access. | Choose appropriate pore size (e.g., 0.4 µm) and membrane surface area for assay scale. |
| Chiral HPLC Columns | Stationary phases designed to separate enantiomers (e.g., derivatized amylose or silica). Critical for analyzing stereoisomer purity and concentration. | Selection (e.g., Chiralpak AD-H, Chiralcel OD-R) is molecule-dependent; requires method development. |
| SPR Sensor Chips (e.g., CMS Series) | Gold-coated glass chips with a carboxymethylated dextran matrix for covalent immobilization of protein targets. | The immobilization chemistry (amine, capture, etc.) must preserve target protein activity and conformation. |
| Optically Pure Reference Standards | Analytically confirmed single enantiomers or diastereomers of the compound of interest. | Essential for calibrating analytical methods, confirming stereochemical stability, and serving as controls in bioassays. |
| Racemic and Enantiomerically Enriched Mixtures | Used for comparative studies in both physicochemical assays (solubility, Log P) and biological assays. | Precise knowledge of enantiomeric excess (ee) is required for accurate data interpretation. |
| Stable Isotope-Labeled Chiral Internal Standards | For quantitative LC-MS/MS bioanalysis, to correct for matrix effects and recovery variations during sample preparation. | Ideally, use a deuterated or 13C-labeled version of the analyte enantiomer. |
Within the paradigm of natural product (NP) leads research, the promise of novel bioactive scaffolds is counterbalanced by profound ADMET (Absorption, Distribution, Metabolism, Excretion, and Toxicity) prediction challenges. A primary, often underappreciated, contributor to these challenges is the inherent physicochemical variability between batches of a natural product extract or a semi-purified lead. This batch-to-batch variability, stemming from differences in plant genotype, cultivation conditions, harvesting, and extraction processes, directly manifests in divergent impurity profiles. These variable impurities—ranging from structurally related analogues to entirely unrelated co-extractives—can significantly modulate the biological activity and toxicity of the lead compound, leading to irreproducible in vitro and in vivo toxicity assessments. This whitepaper details the technical strategies to characterize, control, and account for this variability to ensure reliable toxicity data.
Quantifying Variability: Key Analytical Metrics
Robust characterization is the first defense against variability. The following metrics must be established for each batch.
Table 1: Quantitative Descriptors for Batch Consistency
| Metric | Analytical Technique | Target Specification | Impact on Toxicity Assessment |
|---|---|---|---|
| Lead Compound Purity | HPLC-UV/DAD, qNMR | ≥ 95% (for purified leads) | Defines the reference potency; lower purity necessitates impurity identification. |
| Related Substance Profile | HPLC-HRMS/MS, UPC² | Document identities and levels of all impurities ≥ 0.1% | Structurally similar impurities may have agonistic/antagonistic or synergistic toxic effects. |
| Residual Solvent Content | GC-MS, GC-FID | Complies with ICH Q3C guidelines | Class 1 or 2 solvents can induce cytotoxic or organ-specific toxicity, confounding results. |
| Elemental Impurities | ICP-MS | Complies with ICH Q3D guidelines | Heavy metals (e.g., As, Cd, Hg, Pb) are potent, nonspecific toxins. |
| Biomass Marker Fingerprint | UHPLC-HRMS (untargeted) | Chromatographic fingerprint similarity (e.g., ≥ 90% via cosine similarity) | Ensures consistent botanical sourcing and processing; divergent fingerprints signal a different impurity universe. |
Experimental Protocols for Impurity-Linked Toxicity Deconvolution
When toxicity signals vary between batches, the following tiered experimental approach is recommended.
Protocol 1: Tiered Impurity Fractionation and Toxicity Testing
- Objective: To isolate and identify the chemical driver(s) of variable toxicity.
- Methodology:
- Sample Preparation: Pool equal quantities of multiple high-toxicity and low-toxicity batches. Perform a standardized liquid-liquid or solid-phase extraction to obtain broad fractions (e.g., non-polar, mid-polar, polar).
- Primary Screening: Subject fractions to a high-throughput cytotoxicity assay (e.g., ATP-based viability) in relevant cell lines (e.g., HepG2 for hepatotoxicity).
- Bioactivity-Guided Fractionation: The most cytotoxic fraction is subjected to semi-preparative HPLC. Sub-fractions are collected, dried, and re-tested.
- Hazard Identification: The sub-fraction(s) retaining cytotoxic activity are analyzed by HRMS and NMR for structural elucidation. The identified impurity is then sourced or synthesized for confirmatory dose-response testing alongside the pure lead compound.
Protocol 2: Metabolomic Profiling of Cellular Response
- Objective: To discern if variable impurity profiles alter the mechanism of toxicity or cellular stress pathways.
- Methodology:
- Treatment: Expose a relevant in vitro model (e.g., primary hepatocytes) to three batches: (A) High-purity lead, (B) Variable batch with toxicity, (C) Variable batch without toxicity. Use equimolar concentrations of the lead compound.
- Quenching & Extraction: At a predefined timepoint (e.g., 24h), rapidly quench metabolism (liquid N₂). Perform a methanol/water extraction to obtain intracellular metabolites.
- Analysis: Analyze extracts via untargeted LC-HRMS.
- Data Analysis: Use multivariate statistics (PCA, PLS-DA) to identify differentially abundant metabolites. Map these metabolites to pathways (e.g., via KEGG) to infer mechanisms (e.g., oxidative stress, mitochondrial dysfunction, glutathione depletion) unique to the toxic batch.
Visualization of Workflows and Pathways
Diagram 1: Batch Variability & Toxicity Assessment Workflow
Diagram 2: Impurity-Driven Mitochondrial Stress Pathway
The Scientist's Toolkit: Essential Research Reagents & Materials
Table 2: Key Reagent Solutions for Variability & Toxicity Research
| Item | Function & Rationale |
|---|---|
| Certified Reference Standards | For the lead compound and suspected impurities; essential for quantitative HPLC calibration and confirmatory toxicity testing. |
| Stable Isotope-Labeled Internal Standards (e.g., ¹³C-labeled lead) | For accurate LC-MS/MS quantification of the lead in complex matrices, correcting for matrix effects that vary with impurity profile. |
| SPE Cartridges (C18, HLB, Ion-Exchange) | For reproducible fractionation of complex mixtures during bioactivity-guided isolation of toxic impurities. |
| In Vitro Toxicity Assay Kits (ATP, Caspase-3/7, ROS, GSH) | Standardized, ready-to-use kits for reliable and comparable high-throughput screening of multiple batches. |
| Cryopreserved Primary Hepatocytes | Metabolically competent cells providing a more physiologically relevant toxicity model than immortalized lines for liver metabolism-mediated toxicity. |
| HPLC-QTOF-MS / HRMS System | The cornerstone instrument for untargeted impurity profiling, fingerprinting, and metabolite identification. |
| Chemical Inhibitors (e.g., Cyclosporin A for mPTP, Z-VAD-FMK for pan-caspase) | Pharmacological tools to probe specific toxicity mechanisms implicated by variable impurities. |
Within modern drug discovery, natural products (NPs) and their derivatives remain a prolific source of new chemical entities, particularly for anti-infective and anti-cancer therapies. However, their inherent structural complexity often leads to significant ADMET (Absorption, Distribution, Metabolism, Excretion, and Toxicity) challenges. The seminal "Rule-of-5" (Ro5), formulated by Lipinski, serves as a central heuristic for predicting oral bioavailability in synthetic small molecules. This whitepaper frames the "natural product-like" chemical space through the lens of systematic Ro5 violations, examining how these deviations correlate with both unique pharmacological profiles and distinct ADMET liabilities. Understanding this relationship is critical for optimizing NP-derived leads within a broader thesis on managing ADMET in natural product research.
The Rule-of-5 and Its Applicability to Natural Products
Lipinski's Rule-of-5 predicts that a molecule is likely to have poor oral absorption if it violates two or more of the following criteria:
- Molecular weight (MW) < 500 Da
- Calculated Log P (cLogP) < 5
- Number of hydrogen bond donors (HBD) < 5
- Number of hydrogen bond acceptors (HBA) < 10
While effective for "drug-like" synthetic compounds, NPs frequently occupy regions beyond these rules. Analysis of natural product libraries reveals a distinct chemical space characterized by higher molecular complexity, increased stereogenic centers, and a greater prevalence of macrocyclic or polycyclic scaffolds. These features, while contributing to high affinity and selectivity for challenging targets, inherently lead to Ro5 violations.
Table 1: Comparative Analysis of Chemical Properties: Drug-like vs. Natural Product-like Compounds
| Property | Ro5-Compliant "Drug-like" Space | "Natural Product-like" Space (Typical Range) | Implication for NPs |
|---|---|---|---|
| Molecular Weight (Da) | ≤ 500 | 350 - 800+ | Increased likelihood of Ro5 violation; can impact passive diffusion. |
| cLogP | ≤ 5 | 0 - 8 | Broader range; very low LogP (e.g., glycosides) affects permeability, high LogP risks poor solubility. |
| H-Bond Donors | ≤ 5 | 2 - 10+ | Higher HBD count common, impacting membrane permeability. |
| H-Bond Acceptors | ≤ 10 | 5 - 20+ | Elevated HBA count common, affecting desolvation energy. |
| Rotatable Bonds | ≤ 10 | 5 - 15 | Often more constrained, reducing flexibility. |
| Topological Polar Surface Area (Ų) | ≤ 140 | 100 - 250+ | Higher TPSA correlates with reduced cell permeability. |
| Fraction sp³ Carbons (Fsp³) | ~0.35 | 0.45 - 0.85 | Increased 3D-character and saturation, often improving solubility and success. |
| Chiral Centers | Few | Many (3-10+) | High stereochemical complexity, challenging synthesis but enabling specific target recognition. |
ADMET Challenges Linked to Ro5 Violations in NPs
The structural features causing Ro5 violations directly translate into specific ADMET hurdles that must be anticipated and managed.
- Absorption & Permeability: High molecular weight (>500 Da) and excessive polar surface area (>140 Ų) hinder passive transcellular diffusion across the gut epithelium. Multiple H-bond donors/acceptors increase the energy penalty for desolvation. Protocol: Parallel Artificial Membrane Permeability Assay (PAMPA). A phospholipid-infused filter (e.g., egg lecithin in dodecane) forms an artificial membrane in a donor-acceptor plate. Test compound is added to the donor well, and its appearance in the acceptor well after 4-16 hours is quantified by HPLC-UV/MS to calculate effective permeability (Pe).
- Solubility: High lipophilicity (cLogP > 5) and crystal lattice energy from rigid scaffolds lead to poor aqueous solubility, limiting bioavailability. Protocol: Kinetic Solubility Assay (Nephelometry). A concentrated DMSO stock of the NP is added to phosphate-buffered saline (pH 7.4). After agitation and filtration, the concentration in the supernatant is determined via LC-MS/UV against a standard curve. Turbidity is measured via nephelometry to detect precipitation.
- Metabolism: Structural motifs in NPs (e.g., polyphenols, furans, reactive esters) can be substrates for Phase I/II enzymes or cause time-dependent inhibition of Cytochrome P450s, leading to unpredictable pharmacokinetics or drug-drug interactions. Protocol: Human Liver Microsome (HLM) Stability Assay. Test compound is incubated with pooled HLMs in the presence of NADPH cofactor. Aliquots are taken at 0, 5, 15, 30, and 60 minutes, and the reaction is quenched with cold acetonitrile. The remaining parent compound is quantified by LC-MS/MS to determine intrinsic clearance.
- Toxicity: Ro5-violating features like macrocycles or polycyclic structures can interfere with human ether-à-go-go-related gene (hERG) channel function (cardiotoxicity) or inhibit bile salt export pump (BSEP), leading to cholestatic liver injury. Protocol: hERG Patch Clamp Assay. HEK293 cells stably expressing hERG channels are voltage-clamped. Test compound is perfused onto cells, and the resulting inhibition of the tail current (IKr) is measured at physiological temperature to determine IC₅₀.
Diagram 1: From Ro5 Violations to ADMET Challenges
Strategic Mitigation: Navigating the NP-Like Space
Successful development of NP-derived leads requires proactive strategies to address ADMET issues while preserving unique pharmacology.
A. Structural Optimization Pathways:
- Prodrug Strategy: Mask polar groups (phosphates, amino acids) to improve permeability, with enzymatic cleavage releasing the active parent compound.
- Macrocycle Engineering: Fine-tuning ring size and incorporating heteroatoms or unsaturation within macrocycles can modulate conformation, permeability, and solubility.
- Glycosylation/De-glycosylation: Removing or modifying sugar moieties can drastically reduce HBD/HBA count and MW, improving permeability. Selective glycosylation can improve solubility or target engagement.
B. Formulation & Delivery Technologies: For intrinsically challenging NPs, advanced formulations (lipid nanoparticles, self-emulsifying drug delivery systems, cyclodextrin complexes) can enhance solubility and absorption.
Diagram 2: Strategic Workflow for NP Lead Optimization
The Scientist's Toolkit: Essential Research Reagents & Materials
Table 2: Key Research Reagent Solutions for NP ADMET Profiling
| Item / Reagent | Function & Application in NP Research |
|---|---|
| PAMPA Plate System (e.g., Corning Gentest) | Pre-coated multiwell plates with an artificial lipid membrane for high-throughput assessment of passive transcellular permeability. |
| Pooled Human Liver Microsomes (HLMs) | Contains major CYP450 and UGT enzymes for in vitro metabolism and stability studies, identifying metabolic soft spots in NP scaffolds. |
| Caco-2 Cell Line | Human colon adenocarcinoma cells that differentiate into enterocyte-like monolayers. The gold standard model for predicting intestinal absorption and efflux transporter effects (P-gp, BCRP). |
| Recombinant hERG-Expressing Cells | Stable cell lines (e.g., HEK293-hERG) for early screening of cardiotoxicity risk via patch-clamp or flux-based assays. |
| Supersomes (Expression Systems) | Membranes from insect cells expressing single human CYP450 enzymes (e.g., CYP3A4, 2D6). Used for reaction phenotyping to identify which enzyme metabolizes an NP. |
| Biologically Relevant Lipid Mixtures (e.g., for LNP formulation) | Customizable mixtures of ionizable lipids, phospholipids, cholesterol, and PEG-lipids for developing nanoparticle formulations of insoluble NPs. |
| Phosphatidylcholine Solutions (from egg or soy) | Used for creating biomimetic membranes in permeability assays or for solubility enhancement studies. |
| Cyclodextrins (HP-β-CD, SBE-β-CD) | Commonly used complexing agents to enhance the apparent aqueous solubility of lipophilic NPs for in vitro and in vivo studies. |
The "natural product-like" chemical space, frequently defined by calculated violations of the Rule-of-5, is not a no-go zone for drug development but a region requiring specialized navigation. The structural complexity that underpins Ro5 deviations is precisely what grants NPs their unique bioactivity, yet it concurrently presents a predictable set of ADMET challenges—primarily in permeability, solubility, and metabolic stability. A rational, integrated strategy combining early and predictive ADMET profiling (using the experimental protocols outlined) with targeted structural optimization or advanced delivery systems is essential. By reframing Ro5 violations from simple alerts into diagnostic tools that guide specific mitigation efforts, researchers can more effectively unlock the vast therapeutic potential inherent in natural product leads.
Modern Tools and Techniques: Assessing NP ADMET in the Discovery Pipeline
The transition of natural products, particularly complex polyphenols and glycosides, from botanical extracts to viable drug candidates is fraught with unique ADMET (Absorption, Distribution, Metabolism, Excretion, and Toxicity) hurdles. Their inherent chemical complexity—characterized by multiple hydroxyl groups, high molecular weight, and glycosidic conjugation—often results in poor passive intestinal permeability and unpredictable bioavailability. For decades, the Caco-2 monolayer model has been the gold standard for predicting human intestinal absorption. However, its limitations in modeling the active transport, efflux, and extensive pre-systemic metabolism of these phytochemicals are increasingly apparent. This whitepaper details advanced in vitro, in silico, and ex vivo models that provide a more nuanced, predictive framework for the permeability assessment of complex natural products, thereby de-risking their development pipeline.
Limitations of the Conventional Caco-2 Model
While Caco-2 cells spontaneously differentiate into enterocyte-like cells expressing tight junctions and some relevant transporters (e.g., P-glycoprotein/P-gp), they fail to fully recapitulate key aspects of human intestinal physiology critical for polyphenol/glycoside absorption:
- Non-standardized Metabolic Activity: Cytochrome P450 (CYP) enzyme expression is variable and often low, underestimating first-pass metabolism.
- Incomplete Transporter Expression: They lack sufficient levels of key uptake transporters like SGLT1 (for glucoside absorption) and OATP2B1 (for flavonoid sulfates).
- Absence of Mucus Layer: The lack of a physiologically relevant mucus barrier overlooks its role in modulating the diffusion and stability of compounds.
- Long Cultivation Time: 21-day culture periods are resource-intensive and prone to phenotypic drift.
Advanced Permeability Models: Methodologies and Applications
EnhancedIn VitroCellular Models
A. Co-culture and Triple-culture Models:
- Protocol: Co-cultivate Caco-2 cells with mucus-secreting HT29-MTX cells (typically at a ratio of 90:10 or 75:25). For immune interaction, add Raji B cells to the basolateral side to induce M-cell differentiation for studying Peyer's patch uptake. Culture on Transwell inserts until full differentiation (21-23 days).
- Advantage: Incorporates a physiologically relevant mucus barrier (slowing diffusion, simulating a more realistic unstirred water layer) and models follicle-associated epithelium (FAE) for large molecule/particulate uptake.
B. Induced Pluripotent Stem Cell (iPSC)-Derived Enterocyte Models:
- Protocol: Differentiate human iPSCs towards definitive endoderm (using Activin A), then to intestinal stem cells (via FGF4 and Wnt3a), and finally to mature enterocytes (via DAPT and differentiation factors). Seed on Transwell inserts under air-liquid interface (ALI) conditions.
- Advantage: Recapitulates patient-specific genetics, expresses a more complete repertoire of drug-metabolizing enzymes and transporters (including β-glucuronidases), and allows for disease modeling.
C. Cell-Free Permeability Assays: Parallel Artificial Membrane Permeability Assay (PAMPA) & Permeapad:
- Protocol:
- PAMPA for Natural Products: Use a specialized "Biomimetic" lipid solution (e.g., lecithin in dodecane or a mixture mimicking intestinal brush border membrane) on a 96-well filter plate. The donor plate (simulating gut lumen) is filled with compound in PBS (pH 6.5 or 7.4), and the acceptor plate with PBS (pH 7.4). Incubate for 4-16 hours, then quantify compound in both compartments via HPLC-MS.
- Permeapad: Utilize a patented, phospholipid-based hydrated barrier on a support screen. Follow a similar donor-acceptor setup as PAMPA but with shorter incubation times (2-6 hours) due to higher permeability.
- Advantage: Rapid, low-cost screening for passive transcellular permeability, free from cellular metabolic and active transport interference. Ideal for early-stage ranking of polyphenol aglycones.
Ex Vivoand Tissue-Based Models
A. Using Chamber with Excised Intestinal Tissue:
- Protocol: Isolate a segment of rodent or human intestinal tissue (e.g., from surgery). Mount it in an Using chamber separating mucosal and serosal compartments filled with oxygenated Krebs-Ringer bicarbonate buffer at 37°C. Add the test compound to the mucosal side. Measure the short-circuit current (Isc) and tissue conductance (Gt) while sampling from the serosal side over time for flux quantification.
- Advantage: Preserves the intact intestinal architecture, including the mucus layer, crypt-villus structure, and full complement of transporters and metabolizing enzymes in their native orientation.
B. Precision-Cut Intestinal Slices (PCIS):
- Protocol: Flush intestinal segments with ice-cold, oxygenated Krebs-Henseleit buffer. Embed in low-melting-point agarose and section (200-300 µm thick) using a vibratome. Incubate slices in oxygenated culture medium on a shaking platform. Expose to the test compound and assess viability (e.g., ATP content) and permeability/metabolism over time (up to 24h).
- Advantage: Maintains all cell types and their natural interactions, allowing for high-throughput assessment of metabolism and toxicity alongside permeability.
In Silicoand Computational Approaches
Machine learning models trained on large datasets combining molecular descriptors (e.g., number of H-bond donors/acceptors, topological polar surface area (TPSA), molecular weight, logP) and in vitro permeability data can predict permeability for novel polyphenol scaffolds. These models are particularly valuable for virtual screening of natural product libraries.
Quantitative Data Comparison of Advanced Models
Table 1: Comparison of Advanced Permeability Models for Complex Polyphenols and Glycosides
| Model | Key Features | Throughput | Cost | Physiological Relevance | Best Use Case |
|---|---|---|---|---|---|
| Caco-2/HT29-MTX Co-culture | Mucus layer, improved barrier | Medium | Medium | Medium-High | Studying mucus interaction & passive diffusion of glycosides |
| iPSC-Derived Enterocytes | Full transporter/enzyme profile, patient-specific | Low | High | High | Mechanistic studies of active transport & metabolism |
| Biomimetic PAMPA | Passive diffusion only, cell-free | High | Low | Low | Early-stage ranking of aglycone permeability |
| Using Chamber (Ex Vivo) | Intact tissue architecture, functional transport | Low | High | Very High | Definitive absorption studies, electrogenic transport (SGLT1) |
| Precision-Cut Intestinal Slices | All native cell types, metabolism-integrated | Medium | Medium-High | High | Simultaneous permeability, metabolism, and toxicity screening |
| In Silico Prediction | Molecular descriptor-based, rapid | Very High | Low | Variable | Virtual screening & lead prioritization from large libraries |
Key Signaling and Transport Pathways for Polyphenol Absorption
Diagram Title: Polyphenol & Glycoside Intestinal Absorption Pathways
Diagram Title: Advanced Model Selection Workflow
The Scientist's Toolkit: Essential Research Reagents & Materials
Table 2: Key Reagents and Materials for Advanced Permeability Studies
| Item Name | Supplier Examples | Function in Experiment |
|---|---|---|
| Transwell Permeable Supports | Corning, Greiner Bio-One | Polyester or polycarbonate membrane inserts for culturing cell monolayers in a two-chamber system. |
| HT29-MTX Cells | ECACC, Sigma-Aldrich | Mucus-producing human colorectal adenocarcinoma cell line for co-culture models. |
| Human iPSC Line | ATCC, WiCell, ReproCELL | Source for deriving patient-specific intestinal epithelial cells. |
| Biomimetic PAMPA Plate System | pION, MilliporeSigma | 96-well plate with artificial membrane for high-throughput passive permeability screening. |
| Permeapad Barrier Plate | Noscira, GESIM | Phospholipid-based hydrated barrier for more reproducible artificial membrane assays. |
| Using Chamber System | Warner Instruments, Physiologic Instruments | Apparatus for measuring ion and molecular flux across ex vivo intestinal tissue. |
| Krebs-Ringer Bicarbonate Buffer | MilliporeSigma, Thermo Fisher | Physiological salt solution for ex vivo tissue viability in Using chambers and PCIS. |
| Vibratome | Leica, Precisionary Instruments | Instrument for preparing thin, viable tissue slices (PCIS). |
| Luciferase-Based ATP Assay Kit | Promega, Abcam | For quantifying cellular/tissue viability in PCIS and other long-term cultures. |
| Specific Transporter Inhibitors (e.g., Phloridzin for SGLT1, Ko143 for BCRP) | MedChemExpress, Tocris | Pharmacological tools to probe the role of specific active transport/efflux mechanisms. |
Within the broader context of ADMET challenges in natural product (NP) lead research, the prediction of metabolism—specifically Cytochrome P450 (CYP450) enzyme inhibition and induction—presents a formidable obstacle. Unlike synthetic libraries, NPs possess unique, highly complex, and often novel scaffolds characterized by high sp³ character, numerous chiral centers, and dense heteroatom content. These distinctive chemical features lead to unpredictable interactions with the major CYP isoforms (e.g., 1A2, 2C9, 2C19, 2D6, 3A4), potentially causing late-stage attrition due to drug-drug interaction (DDI) liabilities. This technical guide details contemporary computational and experimental strategies to predict and mitigate these risks early in the NP drug discovery pipeline.
Quantitative Landscape of NP-CYP450 Interactions
The following tables summarize key quantitative data from recent studies on NP scaffolds and CYP450.
Table 1: Incidence of CYP450 Inhibition by Major NP Scaffold Classes
| NP Scaffold Class | CYP3A4 Inhibition (%) | CYP2D6 Inhibition (%) | CYP2C9 Inhibition (%) | Primary Metabolizing CYP(s) | Key Structural Alert |
|---|---|---|---|---|---|
| Flavonoids | ~35% | ~15% | ~25% | 1A2, 2C9, 3A4 | Catechol moiety, prenylation |
| Terpenoids (e.g., Diterpenes) | ~50% | ~10% | ~20% | 3A4, 2C19 | Epoxide, conjugated dienes |
| Alkaloids (Indole/Tropane) | ~40% | ~30% | ~10% | 2D6, 3A4 | Basic nitrogen, planar aromatics |
| Polyketides | ~45% | ~5% | ~15% | 3A4 | Macrolide ring, allylic positions |
| Saponins (Triterpenoid) | ~20% | ~5% | ~10% | 3A4 (after deglycosylation) | Sugar moiety, aglycone lipophilicity |
Table 2: Key CYP450 Induction Parameters for Common NP Chemotypes
| NP Chemotype | Nuclear Receptor(s) Activated (PXR, CAR, AhR) | Fold Induction (CYP3A4 mRNA) in vitro | Typical Time-to-Onset | Reversibility |
|---|---|---|---|---|
| Hyperforin (Phloroglucinol) | PXR >> CAR | 8-12 fold | 6-12 hrs | Reversible (24-48 hrs washout) |
| Kava Lactones (e.g., Yangonin) | PXR, CAR | 4-6 fold | 24-48 hrs | Slow reversible |
| Piperine (Alkaloid) | PXR | 3-5 fold | 12-24 hrs | Reversible |
| Tanshinones (Diterpenoquinone) | PXR, AhR | 6-10 fold | 12-24 hrs | Partially reversible |
Core Predictive Methodologies & Experimental Protocols
In SilicoPrediction Workflow
A tiered computational approach is essential for prioritizing NP scaffolds.
Protocol: Integrated QSAR and Docking Protocol for CYP Inhibition Prediction
- Data Curation: Assemble a high-quality dataset of NP-like molecules with experimental IC₅₀ values for target CYP isoforms from public databases (e.g., ChEMBL, PubChem BioAssay). Apply strict criteria for assay consistency.
- Descriptor Calculation & Model Building: Calculate 2D and 3D molecular descriptors (e.g., MOE, RDKit) and fingerprints. Use machine learning algorithms (e.g., Random Forest, XGBoost) to build isoform-specific QSAR models. Validate using 5-fold cross-validation and an external test set of NPs.
- Molecular Docking: Prepare the NP ligand using molecular mechanics force fields (MMFF94 or GAFF). Prepare the CYP protein structure (from PDB, e.g., 4I3Q for 3A4) by adding hydrogens, assigning charges (e.g., AM1-BCC), and defining the binding site (e.g., heme iron-centered grid). Perform flexible docking (e.g., using Glide SP/XP or AutoDock Vina) focusing on key interactions: coordination to heme iron (for inhibition), π-π stacking with Phe residues, and hydrogen bonding with active site water.
- Meta-Prediction: Combine predictions from QSAR and docking scores using a consensus approach to flag high-risk scaffolds.
Diagram: In Silico Prediction Workflow for NP-CYP Interactions
In VitroExperimental Cascade
In silico predictions must be validated experimentally.
Protocol: High-Throughput Fluorescence-Based CYP Inhibition Assay (Initial Screening)
- Reagent Preparation: Prepare 100 mM potassium phosphate buffer (pH 7.4). Thaw human liver microsomes (HLM) or recombinant CYP enzymes on ice. Prepare NADPH regeneration system (Solution A: NADP⁺, glucose-6-phosphate; Solution B: glucose-6-phosphate dehydrogenase). Dilute probe substrates (e.g., 3-cyano-7-ethoxycoumarin for 1A2, 7-benzyloxy-4-trifluoromethylcoumarin for 3A4) and test NPs in DMSO (final [DMSO] ≤ 0.5%).
- Assay Setup: In a 96-well plate, add 75 µL of phosphate buffer, 10 µL of HLM (0.1-0.5 mg/mL final), 5 µL of NP solution (various concentrations), and 5 µL of probe substrate. Include positive control inhibitor (e.g., ketoconazole for 3A4) and vehicle control.
- Reaction Initiation & Measurement: Pre-incubate plate for 5 min at 37°C. Initiate reaction by adding 5 µL of NADPH regeneration system using a multichannel pipette. Incubate for 15-45 min (linear range). Stop reaction with 100 µL of stop solution (80% acetonitrile/20% 0.5M Tris base). Measure fluorescence (ex/cm appropriate for probe metabolite).
- Data Analysis: Calculate % inhibition relative to vehicle control. Determine IC₅₀ values using nonlinear regression (log(inhibitor) vs. response -- variable slope).
Protocol: LC-MS/MS Based CYP Induction Assay (PXR Activation)
- Cell Culture & Treatment: Seed human hepatocytes (e.g., HepaRG cells or primary) in 24-well collagen-coated plates. Allow cells to stabilize for 48h. Treat cells with test NP (3-4 concentrations) and controls (rifampicin as positive inducer, vehicle as negative) for 48-72 hours, with medium change every 24h.
- mRNA Isolation & qRT-PCR: Lyse cells and isolate total mRNA using a silica-membrane column kit. Perform reverse transcription to cDNA. Run qPCR using TaqMan probes for target CYP mRNAs (CYP3A4, 1A2, 2B6) and housekeeping genes (GAPDH, β-actin).
- Activity Measurement (Optional): After treatment, incubate cells with isoform-specific probe substrates (e.g., testosterone for 3A4) for a set time. Collect medium and analyze metabolite formation using LC-MS/MS.
- Data Analysis: Calculate fold induction of mRNA (2^–ΔΔCt method) and/or enzymatic activity relative to vehicle control. An NP causing ≥2-fold increase and reaching 40% of positive control response is typically considered an inducer.
Diagram: In Vitro CYP Inhibition/Induction Experimental Cascade
The Scientist's Toolkit: Key Research Reagent Solutions
Table 3: Essential Materials for NP-CYP450 Interaction Studies
| Reagent/Material | Function & Rationale | Example Product/Catalog |
|---|---|---|
| Pooled Human Liver Microsomes (HLM) | Contains the full complement of native CYP enzymes for inhibition and metabolite identification studies. Essential for physiologically relevant activity data. | XenoTech H0610, Corning 452117 |
| Recombinant CYP Isozymes (rCYP) | Individual CYP isoforms (e.g., 3A4, 2D6) expressed in a standardized system. Used to deconvolute inhibition contributions in a mixture and for mechanistic studies. | SUPERSOMES (Corning), Baculosomes (Thermo Fisher) |
| Cryopreserved Human Hepatocytes | Gold-standard cellular system for studying CYP induction, as it contains intact nuclear receptors (PXR, CAR) and transcriptional machinery. | BioIVT Hepatocytes, Lonza Hepatocytes |
| PXR Reporter Assay Kit | Cell-based assay (e.g., in HepG2 cells) with a luciferase reporter under PXR response element control. Provides a direct measure of nuclear receptor activation. | Indigo Biosciences PXR Assay Kit |
| LC-MS/MS System with UPLC | High-resolution, sensitive quantification of probe substrate depletion or metabolite formation for definitive IC₅₀ determination and kinetic studies. | Waters Acquity UPLC/Xevo TQ-S, Sciex ExionLC/6500+ |
| Validated CYP450 Inhibition/Induction Assay Kits | Standardized, fluorescence- or luminescence-based kits for medium-throughput screening against key CYP isoforms. | Promega P450-Glo, Thermo Fisher Vivid CYP450 Screening Kits |
1. Introduction: Solubility as a Critical ADMET Hurdle in Natural Product Development
The journey from natural product lead to viable therapeutic candidate is fraught with ADMET (Absorption, Distribution, Metabolism, Excretion, and Toxicity) challenges, with poor aqueous solubility being a primary, rate-limiting obstacle. Lipophilic terpenoids (e.g., taxanes, withanolides, artemisinin) and amphiphilic saponins (e.g., ginsenosides, saikosaponins) exhibit intrinsic bioactivity but suffer from sub-therapeutic bioavailability due to their low solubility. This directly impacts absorption, increases variability, and necessitates high, potentially toxic doses. This technical guide outlines advanced formulation strategies designed to surmount these physicochemical barriers, thereby improving the pharmacokinetic profile and therapeutic potential of these promising natural compounds.
2. Quantitative Overview of Solubility & Formulation Impact
Table 1: Representative Solubility Data and Formulation Efficacy for Select Compounds
| Compound (Class) | Aqueous Solubility (µg/mL) | Log P | Key Formulation Strategy | Reported Solubility/Bioavailability Enhancement (Fold) |
|---|---|---|---|---|
| Paclitaxel (Terpenoid) | ~0.3 | 3.0-4.0 | Polymeric Micelles (e.g., Genexol-PM) | Solubility: >1000x; AUC: 2-3x |
| Artemisinin (Terpenoid) | ~50 | 2.7 | Solid Lipid Nanoparticles (SLNs) | Bioavailability: ~3.5x vs. suspension |
| Ginsenoside Rg3 (Saponin) | Poor | 4.0 | Self-Microemulsifying Drug Delivery System (SMEDDS) | Solubility: >500x; Cmax: 4.2x |
| Saikosaponin A (Saponin) | 29.5 | 3.9 | Cyclodextrin Inclusion Complex (HP-β-CD) | Solubility: 12x |
| Withaferin A (Terpenoid) | ~5 | 2.5 | Nanoemulsion | Bioavailability: ~5x |
3. Core Formulation Strategies: Mechanisms and Protocols
3.1. Lipid-Based Delivery Systems (e.g., SMEDDS, Nanoemulsions)
- Mechanism: Enhance solubilization within lipid droplets, promote lymphatic uptake, and bypass first-pass metabolism.
- Experimental Protocol for SMEDDS Formulation & Evaluation:
- Screening: Conduct ternary phase diagrams using oil (e.g., Capryol 90), surfactant (e.g., Cremophor RH 40), and co-surfactant (e.g., Transcutol HP) to identify the self-emulsification region.
- Preparation: Dissolve the terpenoid/saponin in the lipid blend at 40°C with stirring.
- Dispersion Test: Dilute 1 mL of SMEDDS pre-concentrate in 250 mL of simulated gastric/intestinal fluid (0.1N HCl or pH 6.8 phosphate buffer) under gentle agitation (50 rpm). Assess emulsion grade visually and by droplet size analysis (DLS).
- Characterization: Measure droplet size, PDI, and zeta potential via Dynamic Light Scattering (DLS). Assess stability under centrifugation (3500 rpm, 15 min) and after thermal stress cycling (4°C & 45°C for 48h each).
- In Vitro Release: Use dialysis bag method in USP apparatus I/II against sink conditions; compare release profile vs. pure drug suspension.
3.2. Polymeric and Mixed Micelles
- Mechanism: Utilize amphiphilic block copolymers to encapsulate drugs in a hydrophobic core, with a hydrophilic corona providing steric stabilization.
- Experimental Protocol for Thin-Film Hydration Micelle Preparation:
- Dissolve drug and polymer (e.g., Pluronic F127, TPGS, Soluplus) in a volatile organic solvent (e.g., acetone) in a round-bottom flask.
- Remove solvent under reduced pressure using a rotary evaporator to form a thin, homogeneous film.
- Hydrate the film with aqueous phase (buffer or saline) at a temperature above the polymer's glass transition/critical micelle temperature (e.g., 60°C) with gentle swirling for 30-60 min.
- Filter the micellar dispersion through a 0.22 µm membrane to remove unentrapped drug aggregates.
- Determine entrapment efficiency via ultracentrifugation (30,000 rpm, 1h) or size-exclusion chromatography, followed by HPLC analysis of the drug in the supernatant/eluent.
3.3. Nanoparticle Systems (SLNs, NLCs)
- Mechanism: Provide a solid lipid matrix for solubilization, protect from degradation, and enable controlled release.
- Experimental Protocol for Hot High-Pressure Homogenization (HPH) for SLNs:
- Melt the lipid (e.g., Compritol 888 ATO) and dissolve the drug at ~5-10°C above the lipid's melting point.
- Heat an aqueous surfactant solution (e.g., Tween 80) to the same temperature.
- Add the hot aqueous phase to the hot lipid phase under high-speed stirring to form a coarse pre-emulsion.
- Process the pre-emulsion using a high-pressure homogenizer (e.g., 500 bar for 3-5 cycles) while maintaining temperature.
- Allow the resulting nano-dispersion to cool to room temperature to recrystallize the lipid matrix. Characterize for particle size, polydispersity index (PDI), and crystallinity (by DSC/XRD).
3.4. Cyclodextrin Inclusion Complexes
- Mechanism: Host-guest chemistry where the lipophilic drug molecule is partially or fully encapsulated within the hydrophobic cavity of the cyclodextrin.
- Experimental Protocol for Kneading Method:
- Triturate the drug and hydroxypropyl-β-cyclodextrin (HP-β-CD) at a molar ratio (e.g., 1:1 or 1:2) in a mortar.
- Slowly add a minimal volume of water:ethanol (e.g., 1:1) mixture to form a paste.
- Knead the paste vigorously for 45-60 minutes.
- Dry the resulting complex in an oven at 40°C for 24-48h.
- Pulverize the dried mass and sieve. Confirm complex formation via FT-IR (shift in peaks), DSC (disappearance of drug melting endotherm), and phase-solubility analysis.
4. Key Signaling Pathways Impacted by Bioavailability Enhancement
Diagram 1: Pathway of Enhanced Cytotoxicity via Formulation
Diagram 2: ADMET Optimization via Solubility Enhancement
5. The Scientist's Toolkit: Essential Research Reagents & Materials
Table 2: Key Reagents for Formulation Development of Lipophilic Terpenoids/Saponins
| Category | Item/Reagent | Primary Function & Rationale |
|---|---|---|
| Lipids & Oils | Capryol 90 (Propylene glycol monocaprylate) | Medium-chain triglyceride; excellent solubilizing capacity for lipophilic drugs in SMEDDS. |
| Compritol 888 ATO (Glyceryl dibehenate) | Solid lipid for SLNs/NLCs; provides stable, biocompatible matrix with controlled release properties. | |
| Surfactants | Cremophor RH 40 (Polyoxyl 40 hydrogenated castor oil) | Non-ionic surfactant; critical for stabilizing nanoemulsions and micelles, enhancing wetting and dissolution. |
| D-α-Tocopheryl polyethylene glycol 1000 succinate (TPGS) | Amphiphilic polymer; acts as surfactant, P-gp inhibitor, and antioxidant, boosting absorption and stability. | |
| Polymers | Pluronic F127 (Poloxamer 407) | Triblock copolymer; forms thermoreversible gels and micelles, useful for solubility enhancement and sustained release. |
| Hydroxypropyl-β-Cyclodextrin (HP-β-CD) | Complexing agent; increases aqueous solubility via inclusion complex formation, reducing drug crystallization. | |
| Analytical & Characterization | Dialysis Tubing (MWCO 3.5-14 kDa) | For in vitro drug release studies; separates nanoparticulate systems from free drug in dissolution media. |
| Dynamic Light Scattering (DLS) Instrument | Measures particle size, size distribution (PDI), and zeta potential of nano-formulations. | |
| Caco-2 Cell Line | Human colon adenocarcinoma cell line; gold standard model for in vitro prediction of intestinal permeability and absorption. |
Natural products (NPs) remain a prolific source of novel pharmacophores. However, their development into viable drugs is often hampered by unpredictable Absorption, Distribution, Metabolism, Excretion, and Toxicity (ADMET) profiles. A recurring challenge is the occurrence of unusual pharmacokinetic (PK) behavior, frequently rooted in atypical plasma protein binding and complex tissue distribution patterns. These properties can lead to non-linear kinetics, prolonged half-lives, unexpected accumulation, or rapid clearance, confounding standard PK modeling and dose prediction. This whitepaper provides a technical guide to characterize these phenomena, framed within the essential thesis that understanding NP-specific ADMET quirks is critical for de-risking NP-based drug development.
Core Mechanisms of Unusual PK Behavior
Atypical Plasma Protein Binding
NPs often interact with plasma proteins beyond standard albumin and α1-acid glycoprotein. Binding to lipoproteins, specific globulins, or multiple sites with varying affinities alters free fraction dynamics.
Table 1: Documented Protein Binding Profiles of Select Natural Products
| Natural Product | Primary Binding Protein(s) | Reported Bound Fraction (%) | Affinity Constant (Kd, µM) | Observed PK Anomaly |
|---|---|---|---|---|
| Curcumin | Human Serum Albumin (HSA), Fibrinogen | >99 | 1.2 (HSA) | Rapid clearance, low systemic bioavailability |
| Resveratrol | HSA, Lipoproteins (LDL/HDL) | 98-99.5 | 0.8 (HSA) | Non-linear dose exposure, enterohepatic recirculation |
| Paclitaxel | HSA, α1-Acid Glycoprotein | 95-98 | 0.2 (HSA Site I) | Nonlinear PK, saturable distribution |
| Berberine | α1-Acid Glycoprotein, HSA | ~95 | 15 (AAG) | Tissue accumulation (e.g., liver, heart) exceeding plasma predictions |
| Artemisinin | HSA, possibly Transferrin | ~93 | 110 (HSA) | Variable half-life across populations |
Complex Tissue Distribution and Trapping
Mechanisms include lysosomal trapping of basic amines, irreversible binding to tissue macromolecules, active uptake via transporters, and partitioning into adipose tissue.
Table 2: Tissue-to-Plasma Ratio (Kp) for NPs with Distribution Anomalies
| Compound | Liver Kp | Lung Kp | Brain Kp | Adipose Kp | Proposed Mechanism of Enrichment |
|---|---|---|---|---|---|
| Digoxin | 1.5-2.0 | 3.0-4.5 | 0.2-0.3 | 0.8 | Active uptake (OATP), binding to muscle Na+/K+ ATPase |
| Atorvastatin (NP-derived) | 15-25 | 0.5-0.7 | 0.1-0.2 | 0.3 | Active hepatic uptake (OATP1B1), low passive diffusion |
| Quinidine | 8-12 | 4-6 | 0.5-0.8 | 2-3 | Lysosomal trapping, binding to tissue phospholipids |
| Tetrahydrocannabinol (THC) | 3-5 | 1.5-2.5 | 7-10 | 80-120 | High lipophilicity, partitioning into lipid-rich tissues |
Experimental Protocols for Characterization
Protocol: Multi-Matrix Equilibrium Dialysis for Protein Binding
Objective: Determine unbound fraction (fu) in plasma and against isolated proteins.
- Preparation: Use a rapid 96-well equilibrium dialysis device (e.g., HTD96b). Pre-hydrate dialysis membranes (12-14 kDa MWCO) in isotonic buffer.
- Loading: Add 150 µL of compound-spiked plasma (or protein solution) to the donor chamber. Add 150 µL of isotonic phosphate buffer (pH 7.4) to the receiver chamber.
- Incubation: Seal plate and incubate at 37°C with gentle agitation (50 rpm) for 4-6 hours (validate time to reach equilibrium).
- Sampling & Analysis: Post-incubation, aliquot equal volumes from donor and receiver compartments. Use LC-MS/MS to quantify compound concentrations in both sides.
- Calculation: fu = [Receiver]/[Donor]. Correct for volume shift if necessary.
Protocol: Quantitative Whole-Body Autoradiography (QWBA) for Tissue Distribution
Objective: Visualize and quantify the spatial distribution of a radiolabeled NP across tissues.
- Dosing: Administer a single dose of [14C]- or [3H]-labeled NP (via relevant route) to rodents (typically rat).
- Sacrifice & Embedding: Euthanize animals at predefined time points (e.g., 0.5, 2, 8, 24h). Flash-freeze carcass in a hexane/dry ice bath. Embed in carboxymethylcellulose matrix.
- Sectioning: Cryosection the entire frozen block at sagittal plane (typically 30-40 µm thickness). Collect sections onto adhesive tape.
- Exposure: Mount sections against phosphor imaging plates alongside calibrated radioactive standards. Expose in darkness for 7-21 days.
- Imaging & Quantification: Scan plates with a phosphor imager. Use software to measure radioactivity density in tissues and interpolate concentration from standard curve.
Protocol: In Situ Perfusion for Assessing Tissue Uptake & Clearance
Objective: Measure the intrinsic uptake/efflux of an NP in a specific organ (e.g., liver, brain).
- Surgical Preparation: Anesthetize rat. Cannulate the inlet (arterial) and outlet (venous) of the target organ (e.g., portal vein & hepatic vein for liver).
- Perfusion: Perfuse the organ with oxygenated Krebs-Henseleit buffer containing the NP (with/without inhibitors) at a constant physiological flow rate.
- Sampling: Collect effluent from the outlet catheter at timed intervals (e.g., every 30 sec for 15 min).
- Analysis: Quantify compound in effluent via HPLC-MS. Calculate extraction ratio (ER) = (Cin – Cout) / Cin.
- Modeling: Fit data to kinetic models (e.g., single-pass, well-stirred) to determine permeability-surface area product (PS) or active transport parameters.
Visualization of Pathways and Workflows
Title: NP Disposition Leading to Unusual Pharmacokinetics
Title: QWBA Tissue Distribution Workflow
The Scientist's Toolkit: Research Reagent Solutions
Table 3: Essential Reagents and Materials for NP PK Profiling
| Item | Function & Application | Key Consideration for NPs |
|---|---|---|
| Human/Animal Plasma (Lithium Heparin) | Matrix for protein binding and stability studies. | Use fresh or properly thawed; NPs may be unstable due to esterases. |
| Isotopically Labeled NP Standards (14C, 3H, stable isotopes) | Essential for mass balance, QWBA, and metabolite tracking. | Ensure label is metabolically stable (e.g., on core scaffold). |
| Recombinant Transporters (e.g., in vesicles) | To identify involvement of specific uptake/efflux transporters (OATPs, P-gp, BCRP). | NP may interact with multiple low-affinity sites. |
| Equilibrium Dialysis Devices (e.g., HTD96b) | High-throughput determination of unbound fraction (fu). | Long equilibration times may be needed for highly lipophilic NPs. |
| Phosphor Imaging Plates & Standards | Detection and quantification for QWBA. | Calibrate for the specific isotope energy. |
| Cryosectioning System | To produce whole-body tissue sections for QWBA. | Maintain cryogenic temperatures to prevent analyte diffusion. |
| LC-MS/MS System with High Sensitivity | Quantification of NPs and metabolites in complex biomatrices. | Ion suppression/enhancement from NP co-extractables is common. |
| In Situ Perfusion Apparatus | Isolated organ studies to measure intrinsic uptake/clearance. | Requires surgical expertise; buffer must maintain organ viability. |
Within the broader thesis on the unique ADMET (Absorption, Distribution, Metabolism, Excretion, and Toxicity) challenges of natural product (NP) leads, this guide addresses the core computational adaptation required. NPs are "non-synthon rich," characterized by complex, highly oxygenated, and chiral scaffolds that deviate from synthetic, "rule-of-five" compliant chemical space. Traditional Quantitative Structure-Activity Relationship (QSAR) and ADMET prediction platforms, trained predominantly on synthetic drug-like molecules, frequently fail for NPs due to descriptor mismatch, training set under-representation, and inappropriate applicability domains. This whitepaper provides a technical guide for adapting in silico ADMET modeling platforms to better serve NP-based drug discovery.
Core Adaptation Strategies for NP-Centric Modeling
Curating Representative NP ADMET Datasets
The primary limitation is the scarcity of high-quality, curated experimental ADMET data for NPs. Public repositories like ChEMBL contain limited NP entries with associated pharmacokinetic data.
Experimental Protocol for Data Curation:
- Source Identification: Systematically mine literature and databases (e.g., ChEMBL, NPASS, TCMSP) for NPs with reported in vitro or in vivo ADMET parameters (e.g., Caco-2 permeability, microsomal stability, plasma protein binding, hERG inhibition).
- Data Standardization: Convert all reported values (e.g., % remaining, half-life, IC50) to consistent units and endpoints (e.g., binary classification for high/low permeability).
- Structural Standardization: Clean and standardize molecular structures (tautomer selection, neutralization, stereochemistry annotation) using toolkits like RDKit or OpenBabel.
- Descriptor Calculation: Compute a broad set of molecular descriptors (1D, 2D, 3D) and fingerprints (ECFP, MACCS) for each entry.
- Applicability Domain (AD) Definition: Use methods like leverage or distance-based measures (e.g., k-Nearest Neighbors) to define the chemical space boundary of the new NP-enriched dataset.
Table 1: Comparison of Public Data Sources for NP ADMET Data
| Database | NP-Specific? | Key ADMET Parameters Available | Approx. NP Entries with ADMET Data |
|---|---|---|---|
| ChEMBL | No | Solubility, Permeability, Metabolism, Toxicity | ~15,000 (curated from literature) |
| NPASS | Yes | Antimicrobial activity & cytotoxicity (limited PK) | ~35,000 natural compounds |
| TCMSP | Yes | OB, Caco-2, DL, Half-life (predicted & curated) | ~13,000 compounds |
| CMAUP | Yes | Targets & pathways (limited explicit ADMET) | ~47,000 compounds |
Developing NP-Optimized Molecular Descriptors
Traditional descriptors fail to capture NP complexity. Adapted descriptors include:
- NP-Scaffold Fingerprints: Based on common NP core structures (e.g., flavonoid, terpenoid, alkaloid scaffolds).
- Stereochemical Descriptors: Quantifying chirality and specific stereoisomer counts.
- Shape & Complexity Descriptors: Such as Plane of Best Fit (PBF), Principal Moment of Inertia (PMI) ratios, and synthetic accessibility scores tailored for NPs.
Table 2: Traditional vs. NP-Adapted Molecular Descriptors
| Descriptor Class | Traditional Example | Limitation for NPs | NP-Adapted Alternative |
|---|---|---|---|
| Topological | Molecular Weight (MW), LogP | Poorly correlates with NP permeability | PMI Ratio: Captures 3D shape deviation from linear/disk/spherical. |
| Electronic | Partial Charge, HOMO/LUMO | Less sensitive to complex H-bonding arrays | Pharmacophore-Fingerprint: Emphasizes H-bond donors/acceptors spatial patterns. |
| Structural | Count of Aromatic Rings | Under-represents aliphatic rings & macrocycles | NP-Scaffold Key: Binary fingerprint indicating presence of known NP structural motifs. |
| Constitutional | Rotatable Bond Count | Misleading for flexible macrocycles | PBF Descriptor: Measures deviation from planarity. |
Machine Learning Model Training & Validation
Protocol for building an NP-adapted ADMET classification model (e.g., for metabolic stability):
- Data Splitting: Use scaffold-based splitting (e.g., Bemis-Murcko scaffolds) instead of random splitting to ensure structural diversity between training and test sets, preventing over-optimism.
- Algorithm Selection: Prioritize algorithms that handle high-dimensional, non-linear relationships (e.g., Random Forest, Gradient Boosting, or Deep Neural Networks).
- Feature Selection: Apply recursive feature elimination or domain knowledge to select the most informative NP-adapted descriptors.
- Model Training: Train multiple algorithms using cross-validation on the training set.
- Rigorous Validation:
- Internal Validation: Use the held-out test set from scaffold split.
- External Validation: Test on a completely independent NP dataset from a different source.
- Applicability Domain Assessment: Report prediction confidence only for molecules within the defined AD of the training data.
Visualizing the Adapted Workflow
NP ADMET Modeling Adapted Workflow
Adaptation Logic: From Challenge to Solution
The Scientist's Toolkit: Research Reagent Solutions
Table 3: Essential Tools for Developing NP ADMET Models
| Tool/Resource Name | Category | Primary Function in NP ADMET Modeling |
|---|---|---|
| RDKit | Open-Source Cheminformatics | Core library for NP structure handling, descriptor calculation (including stereochemistry), and fingerprint generation. |
| KNIME Analytics Platform | Data Analytics Workflow | Visual platform to build, document, and execute the entire data curation and modeling pipeline without extensive coding. |
| Python (scikit-learn, XGBoost) | Programming/ML Libraries | Flexible environment for implementing custom descriptor calculations, advanced machine learning algorithms, and validation protocols. |
| Docker | Containerization | Ensures computational reproducibility by packaging the entire modeling environment (OS, libraries, code) into a shareable container. |
| ChEMBL / NPASS Database | Curated Data Source | Primary sources for experimental bioactivity and ADMET data, requiring careful extraction and curation for NP subsets. |
| MOSES or related benchmarks | Benchmarking Framework | Provides standardized datasets and metrics to objectively compare the performance of new NP-adapted models against baselines. |
Applicability Domain Toolkits (e.g., AMBIT, R package applicable) |
Model Validation | Calculates the chemical space boundary of training data to assess the reliability of new NP predictions. |
Overcoming Hurdles: Strategic Optimization of NP Pharmacokinetics and Safety
The therapeutic potential of natural products (NPs) is often undermined by poor pharmacokinetic profiles, a core component of the ADMET (Absorption, Distribution, Metabolism, Excretion, Toxicity) challenge. Many promising NP leads suffer from low aqueous solubility, chemical instability, rapid first-pass metabolism, and poor membrane permeability, leading to inadequate systemic bioavailability. This technical guide details prodrug strategies and semi-synthetic modifications as rational chemical approaches to overcome these barriers, thereby rescuing NP candidates in the drug development pipeline.
Section 1: Prodrug Strategies for Natural Products
A prodrug is a pharmacologically inactive derivative of an active drug, designed to improve its physicochemical, biopharmaceutical, or pharmacokinetic properties. The inactive form is converted in vivo by enzymatic or chemical reactions to release the active parent molecule.
Rationale and Target Properties
Prodrug design targets specific molecular properties:
- Poor Aqueous Solubility: Limits dissolution rate and absorption.
- Low Lipophilicity/Permeability: Hinders transport across biological membranes (e.g., intestinal epithelium, blood-brain barrier).
- Chemical Instability: Degradation in GI tract or systemic circulation.
- Rapid Presystemic Metabolism: Extensive first-pass effect.
- Site-Specificity: Off-target toxicity or need for localized delivery.
- Poor Patient Compliance: Unpleasant taste or irritation.
Common Prodrug Linkers and Functionalizations for NPs
The choice of a promoiety (modifying group) and linker is guided by the functional groups present on the NP and the desired release mechanism. Common targets are hydroxyl, carboxyl, amine, and carbonyl groups.
Table 1: Common Prodrug Linkages and Their Applications for NPs
| Linkage Type | Target NP Functional Group | Promoiety Examples | Cleavage Mechanism | Primary Goal |
|---|---|---|---|---|
| Ester | -COOH, -OH | Alkyl, amino acid, phosphate | Esterases (hydrolysis) | Enhance solubility, permeability, mask taste |
| Carbonate | -OH | Alkyl carbonates | Enzymatic hydrolysis | Enhanced stability, sustained release |
| Amide | -COOH (to form amide) | Amino acids, peptides | Peptidases | Targeted release, enhance permeability |
| Glycosidic | -OH | Sugars | Glycosidases | Colon-specific delivery |
| Phosphate/Ester | -OH | Phosphate salts | Alkaline phosphatase | Dramatically enhance aqueous solubility |
| Oxime/Imine | C=O (carbonyl) | Alkoxyamines | pH-dependent hydrolysis | Improve chemical stability, taste masking |
Experimental Protocol: Synthesis and Evaluation of a Phosphate Prodrug for a Polyphenolic NP
Objective: To enhance the aqueous solubility of a poorly soluble polyphenol (e.g., Resveratrol analog) via phosphate prodrug formation.
Materials:
- NP Lead: Hydroxy-substituted polyphenol (e.g., 5-10 mmol).
- Phosphorylating Agent: Phosphorus oxychloride (POCI₃) or di-tert-butyl N,N-diethylphosphoramidite.
- Base: Anhydrous pyridine or triethylamine (TEA).
- Solvents: Anhydrous dichloromethane (DCM), tetrahydrofuran (THF), methanol.
- Purification: Silica gel for column chromatography.
- Analytical: HPLC, NMR (¹H, ³¹P), MS.
Procedure:
- Reaction Setup: Under inert atmosphere (N₂/Ar), dissolve the NP (1.0 eq) in anhydrous DCM or THF in a round-bottom flask.
- Base Addition: Add base (e.g., TEA, 2.0-3.0 eq) and cool the mixture to 0°C.
- Phosphorylation: Add phosphorylating agent (e.g., POCI₃, 1.2 eq) dropwise with stirring. Allow the reaction to warm to room temperature and monitor by TLC.
- Quenching & Work-up: After completion (4-12 h), cautiously quench the reaction with ice-cold water. Extract the aqueous layer with DCM (x3). Combine organic layers, wash with brine, dry over anhydrous Na₂SO₄, and concentrate in vacuo.
- Deprotection (if using protected phosphate): If a protected phosphate (e.g., di-tert-butyl) is used, treat the intermediate with a deprotection agent like trimethylsilyl bromide (TMSBr) or acidic resin.
- Salt Formation (Optional): Dissolve the phosphate acid in water and add a stoichiometric amount of sodium bicarbonate to form the sodium salt. Lyophilize to obtain the final prodrug.
- Purification: Purify the crude product by silica gel column chromatography or recrystallization.
- Characterization: Confirm structure via ¹H NMR, ³¹P NMR, and HRMS. Determine aqueous solubility in phosphate buffer (pH 7.4) using a shake-flask method with HPLC-UV quantification.
- In Vitro Conversion: Incubate prodrug (10 µM) in simulated intestinal fluid (SIF, containing phosphatases) and human plasma. Monitor the appearance of the parent NP over time using LC-MS/MS.
Prodrug Activation Pathway for a Phosphate Ester
Section 2: Semi-Synthetic Modifications of NPs
Semi-synthesis starts with the natural product scaffold and uses chemical synthesis to modify its structure. This leverages the synthetic complexity of the NP while allowing targeted improvements to its drug-like properties.
Key Modification Sites and Strategies
Table 2: Semi-Synthetic Modifications to Address ADMET Issues
| ADMET Issue | Synthetic Strategy | Example NP | Modification | Outcome (Quantitative Change) |
|---|---|---|---|---|
| Low Solubility | Glycosylation, PEGylation, Salt formation | Paclitaxel | 2'-O-(Polyethylene glycol) ester | Solubility increased from <0.1 µg/mL to >1 mg/mL |
| Rapid Metabolism | Blocking metabolically labile sites | Curcumin | Hydrogenation of diketone moiety (Tetrahydrocurcumin) | Plasma half-life (rat) increased from ~30 min to >90 min |
| Poor Permeability | Esterification to increase logP | Morphine | Diacetyl morphine (Heroin) | LogP increased from ~0.8 to ~2.3; BBB penetration enhanced |
| Toxicity/Selectivity | Targeted conjugation | Podophyllotoxin | Etoposide phosphate (prodrug of glucoside) | Toxicity reduced, solubility increased; IC50 shift in cell lines |
| Chemical Instability | Derivatization of labile group | Lovastatin (lactone) | Simvastatin (methylated analog) | Improved stability; bioavailability increased by ~60% |
Experimental Protocol: Semi-Synthetic Glycosylation to Enhance Solubility
Objective: To attach a hydrophilic sugar moiety (e.g., glucose) to a terpenoid NP via a linker to improve aqueous solubility.
Materials:
- NP Scaffold: Terpenoid with a free -OH group (e.g., 10-Deacetylbaccatin III).
- Glycosyl Donor: Peracetylated glycosyl bromide (e.g., Acetyl-α-D-glucopyranosyl bromide).
- Activator/Promoter: Silver triflate (AgOTf) or BF₃·Et₂O.
- Base: Molecular sieves (4Å), anhydrous DIPEA.
- Solvents: Anhydrous DCM, toluene.
- Deprotection Reagents: Sodium methoxide (NaOMe) in MeOH.
Procedure (Koening-Knorr Glycosylation):
- Activation: In a flame-dried flask under Ar, activate powdered 4Å molecular sieves by heating. Cool, add anhydrous DCM.
- Glycosyl Donor Addition: Add the glycosyl donor (1.5 eq) and the NP acceptor (1.0 eq) to the flask. Cool to -15°C.
- Promoter Addition: Add promoter (AgOTf, 2.0 eq) portionwise. Stir the reaction at low temperature for 1h, then allow to warm to RT over 4-6h.
- Quenching & Work-up: Quench with saturated NaHCO₃ solution. Filter through Celite to remove salts/sieves. Wash organic layer with water and brine, dry (Na₂SO₄), and concentrate.
- Deprotection (O-Acetyl Groups): Dissolve the acetylated glycoside intermediate in anhydrous methanol. Add a catalytic amount of NaOMe (0.1 eq). Stir at RT for 2-4h until deacetylation is complete (TLC monitoring).
- Neutralization & Purification: Neutralize with Amberlite IR-120 (H+) resin, filter, and concentrate. Purify the final deprotected glycoside by reverse-phase (C18) column chromatography.
- Characterization & Solubility Testing: Confirm structure via NMR and HRMS. Determine solubility in water and PBS using the HPLC-UV method. Compare LogP (calculated and experimental, e.g., shake-flask) with the parent NP.
Semi-Synthetic Strategy Selection Workflow for NP Optimization
The Scientist's Toolkit: Key Research Reagent Solutions
Table 3: Essential Materials for Prodrug and Semi-Synthetic Research
| Reagent/Material | Supplier Examples | Primary Function in NP Modification |
|---|---|---|
| Protected Glycosyl Donors (e.g., Acetyl/Benzyl protected) | Carbosynth, Sigma-Aldrich | Serve as activated sugar moieties for glycosylation reactions to enhance solubility. |
| Biocompatible Linkers (e.g., PEG spacers, succinate) | Thermo Fisher (Pierce), Iris Biotech | Provide a cleavable bridge between NP and promoiety; modulate pharmacokinetics. |
| Phosphorylating Agents (POCI₃, Phosphoramidites) | Tokyo Chemical Industry (TCI), Merck | Introduce phosphate groups for highly soluble prodrugs. |
| Activated Esters (NHS, Sulfo-NHS) | Sigma-Aldrich, Apollo Scientific | Facilitate amide/ester bond formation under mild conditions for conjugations. |
| Metabolic Enzyme Cocktails (S9 fractions, microsomes) | Corning, XenoTech | In vitro evaluation of prodrug conversion and metabolic stability of analogs. |
| Caco-2/HT29-MTX Cell Lines | ATCC, ECACC | Assess permeability enhancements of modified NPs across intestinal epithelium. |
| Simulated Biological Fluids (SGF, SIF, FaSSIF) | Biorelevant.com, Prepare in-house | Standardized media for studying solubility, stability, and release kinetics. |
| LC-MS/MS Systems (Q-TOF, Triple Quad) | Agilent, Waters, Sciex | Critical for characterizing novel semi-synthetic compounds and quantifying in vitro/in vivo PK parameters. |
Within the critical framework of ADMET optimization for natural product leads, prodrug design and semi-synthesis represent powerful and complementary strategies. By applying rational chemical modifications, researchers can systematically address deficiencies in solubility, permeability, and metabolic stability that often plague complex NPs. The integration of these synthetic approaches with robust in vitro and in vivo pharmacokinetic assessments is essential for translating the inherent biological activity of natural scaffolds into viable drug candidates with clinically relevant bioavailability.
Within the broader context of ADMET (Absorption, Distribution, Metabolism, Excretion, and Toxicity) challenges specific to natural product leads research, the risk of herb-drug interactions (HDIs) presents a significant translational hurdle. These interactions are predominantly mediated through interference with cytochrome P450 (CYP) enzymes and drug transporters, leading to altered pharmacokinetics of co-administered drugs, which can result in therapeutic failure or toxicity. This technical guide provides a detailed framework for identifying, evaluating, and mitigating these risks during the research and development of natural product-based therapeutics.
Core Mechanisms of Herb-Drug Interactions
The primary pharmacokinetic interactions occur via modulation of key proteins responsible for drug metabolism and transport.
1.1 Cytochrome P450 (CYP) Enzymes CYP enzymes, particularly CYP3A4, 2D6, 2C9, and 2C19, are responsible for the metabolism of a majority of clinically used drugs. Natural products can act as:
- Inhibitors: Directly or irreversibly (mechanism-based) bind to the enzyme, reducing the metabolism of co-administered drugs.
- Inducers: Upregulate enzyme expression (via nuclear receptor activation), increasing drug metabolism and lowering plasma concentrations.
- Substrates: Are metabolized by the enzymes, competing for active sites.
1.2 Drug Transporters Transporters such as P-glycoprotein (P-gp, MDR1), Breast Cancer Resistance Protein (BCRP), and Organic Anion Transporting Polypeptides (OATPs) govern the absorption, distribution, and excretion of drugs. Natural products can inhibit or induce these transporters, altering the tissue penetration and clearance of concomitant drugs.
Quantitative Risk Assessment: Key Data
The following tables summarize critical interaction potentials for common herbal constituents and standardized extracts. Data is derived from recent in vitro and clinical studies.
Table 1: Inhibitory Potential of Common Herbal Constituents on Major CYP Enzymes (IC50 or Ki values)
| Herbal Constituent / Extract | Source | CYP3A4 | CYP2D6 | CYP2C9 | CYP2C19 | Primary Evidence |
|---|---|---|---|---|---|---|
| Bergamottin | Grapefruit | 1.2 µM | >50 µM | 6.5 µM | 15 µM | HLM, Recombinant |
| Hyperforin | St. John's Wort | 0.1 µM* | >10 µM | 0.05 µM | 0.08 µM | HLM (Time-dep.) |
| Piperine | Black Pepper | 3.8 µM | 25 µM | 17 µM | 30 µM | HLM, Hepatocytes |
| Schisandrin B | Schisandra | 4.5 µM | >100 µM | >100 µM | >100 µM | Recombinant CYP |
| Echinacea purpurea Ext. | Echinacea | 28 µg/mL | >100 µg/mL | >100 µg/mL | >100 µg/mL | Pooled HLM |
| Silymarin | Milk Thistle | >100 µM | >100 µM | >100 µM | >100 µM | HLM (Weak/None) |
Note: HLM = Human Liver Microsomes; *Potent mechanism-based inhibitor; IC50/Ki values are approximate and system-dependent.
Table 2: Modulation of Key Drug Transporters by Herbal Constituents
| Herbal Agent | P-gp (MDR1) | BCRP | OATP1B1/1B3 | MRP2 |
|---|---|---|---|---|
| Curcumin | Inhibitor (EC50 ~5 µM) | Inhibitor (EC50 ~10 µM) | Inhibitor | Inducer (Nrf2 path) |
| Ginkgolide A, B | Inhibitor | Mild Inhibitor | Potent Inhibitor | No significant effect |
| Ginsenoside Rg3 | Inhibitor | -- | Substrate/Inhibitor | -- |
| St. John's Wort | Inducer (PXR) | Inducer | Inhibitor (Acute) | Inducer (PXR) |
| Piperine | Inhibitor | Inhibitor | Inhibitor | -- |
Experimental Protocols for HDI Evaluation
Protocol: CYP450 Inhibition Assay (Fluorometric Screening)
Objective: To determine the reversible inhibitory potential of a natural product lead on major CYP isoforms. Key Reagents & Materials: See "Scientist's Toolkit" below. Methodology:
- Reaction Setup: In a black 96-well plate, add 70 µL of potassium phosphate buffer (pH 7.4).
- Addition of Test Compound: Add 10 µL of the natural product extract/compound (at varying concentrations, e.g., 0.1-100 µM) in DMSO (final DMSO ≤1%).
- Enzyme Addition: Add 10 µL of human recombinant CYP enzyme (e.g., CYP3A4, 2D6).
- Pre-incubation: Incubate at 37°C for 5 minutes.
- Reaction Initiation: Add 10 µL of a fluorogenic probe substrate (e.g., 7-benzyloxy-4-trifluoromethylcoumarin for CYP3A4). Start reaction.
- Kinetic Measurement: Immediately place plate in a fluorescence microplate reader (e.g., Ex/Em: 409/460 nm). Record fluorescence every minute for 30-60 minutes.
- Data Analysis: Calculate initial reaction rates (V). Plot % activity (Vinhibited/Vcontrol * 100) vs. inhibitor concentration to determine IC50 using non-linear regression.
Protocol: Caco-2 Transwell Assay for Transporter Inhibition (P-gp)
Objective: To assess if a natural compound inhibits P-glycoprotein-mediated efflux. Methodology:
- Cell Culture: Grow Caco-2 cells in Transwell inserts (0.4 µm pore, 12-well format) for 21-25 days to achieve full differentiation and transporter expression. Monitor Transepithelial Electrical Resistance (TEER > 500 Ω·cm²).
- Test Solutions: Prepare transport buffer (HBSS-HEPES, pH 7.4). Add test natural product (at relevant concentrations) to both apical (A) and basolateral (B) sides for inhibition studies. Include a positive control inhibitor (e.g., 100 µM verapamil).
- Bidirectional Transport:
- A-to-B: Add a known P-gp substrate (e.g., 10 µM digoxin) in buffer to the apical chamber. Sample from basolateral side over 2 hours.
- B-to-A: Add the substrate to the basolateral chamber. Sample from the apical side.
- LC-MS/MS Analysis: Quantify substrate concentration in samples using a validated LC-MS/MS method.
- Calculation: Determine the apparent permeability (Papp) and the efflux ratio (ER = Papp(B→A)/Papp(A→B)). A significant reduction in ER in the presence of the test compound indicates P-gp inhibition.
Visualizing Pathways and Workflows
Title: Nuclear Receptor-Mediated CYP Induction by Herbs
Title: Integrated HDI Risk Assessment and Mitigation Workflow
The Scientist's Toolkit: Key Research Reagents & Solutions
| Item / Reagent | Function / Application | Example Vendor / Cat. No. (Representative) |
|---|---|---|
| Pooled Human Liver Microsomes (HLM) | Gold-standard system for in vitro CYP metabolism and inhibition studies. Contains full complement of human CYPs. | Corning, Xenotech |
| Human Recombinant CYP Enzymes (Supersomes) | Individual CYP isoforms (CYP3A4, 2D6, etc.) for specific reaction phenotyping and inhibition screening. | Corning |
| Cryopreserved Human Hepatocytes | Used for CYP induction studies (assessing PXR/CAR activation) and more complex metabolism models. | BioIVT, Lonza |
| Fluorogenic CYP Probe Substrate Kits | Non-lytic, sensitive probes for high-throughput kinetic inhibition screening of major CYP enzymes. | Promega (P450-Glo) |
| LC-MS/MS System (e.g., QQQ Mass Spec) | Essential for definitive quantification of drugs/metabolites in transporter and complex metabolism assays. | SCIEX, Agilent, Waters |
| Differentiated Caco-2 Cell Monolayers | Model for intestinal permeability and assessment of P-gp/BCRP-mediated efflux interactions. | ATCC, commercial pre-plated inserts |
| Membrane Vesicles (e.g., P-gp, BCRP Overexpressed) | Direct system to study ATP-dependent transporter inhibition by test compounds. | Solvo Biotechnology |
| Nuclear Receptor Reporter Assay Kits (PXR, CAR) | Cell-based assays to identify receptor-mediated transcriptional activation leading to CYP induction. | Indigo Biosciences |
Mitigation Strategies in Natural Product Development
- Early Screening Tier: Implement high-throughput in silico (docking) and in vitro (fluorometric CYP, single-concentration transporter) screens to flag high-risk leads.
- Mechanistic Studies: For flagged leads, conduct detailed enzyme kinetic studies (Ki determination), time-dependent inhibition (TDI) assays, and nuclear receptor activation assays to define the risk.
- Lead Optimization: Employ medicinal chemistry to modify the scaffold of a promising natural lead to reduce affinity for CYP/transporters while preserving primary pharmacodynamic activity.
- Clinical Guidance: When interaction is unavoidable (e.g., with a clinically essential herb), design precise clinical pharmacokinetic studies to quantify the interaction magnitude and inform contraindications or structured dose-adjustment guidelines for co-administered drugs.
Proactively managing CYP and transporter interference is a non-negotiable component of the ADMET profile for natural product leads. By integrating a tiered experimental strategy—from predictive screening to definitive mechanistic studies—into the early development pipeline, researchers can identify interaction risks, understand their mechanisms, and implement appropriate mitigation measures. This systematic approach is critical for advancing safer, more effective natural product-derived therapeutics with predictable clinical pharmacokinetics.
Within the broader thesis of ADMET challenges specific to natural product leads, a central conflict exists between their privileged structural diversity, which offers unique pharmacologic potential, and their inherent chemical reactivity, which poses significant toxicity risks. Idiosyncratic Drug-Induced Liver Injury (IDILI) remains a major cause of drug attrition and post-market withdrawal. For natural product scaffolds like alkaloids and quinones, a primary mechanistic hypothesis for IDILI involves bioactivation by hepatic cytochrome P450 enzymes (CYPs) to form reactive metabolites (RMs). These electrophilic species can covalently bind to cellular proteins, forming haptens that may trigger immune-mediated toxicity or directly impair cellular function through oxidative stress and mitochondrial damage. This whitepaper provides a technical guide for screening and mitigating this risk early in the lead optimization pipeline.
Mechanisms of Bioactivation: Key Pathways
Alkaloids: Bioactivation often occurs via:
- Formation of iminium ions (e.g., from pyrrolizidine alkaloids, tertiary amines).
- Metabolic epoxidation of unsaturated bonds.
- Oxidation to quinone-like structures from catechol or hydroquinone moieties.
Quinones: Intrinsically electrophilic, but further bioactivation can involve:
- Redox cycling: One-electron reductions to semiquinone radicals, generating reactive oxygen species (ROS).
- Michael addition: Direct covalent binding to nucleophilic protein thiols (e.g., glutathione, cysteine residues).
- Formation of quinone methides.
Pathway Diagram: Common Bioactivation Routes
Diagram 1: Key Bioactivation and Detoxification Pathways
Core Screening Assays & Experimental Protocols
A tiered screening strategy is recommended to assess reactive metabolite formation.
Tier 1: Trapping Assays (In Vitro) Objective: Qualitative and quantitative detection of reactive intermediates using nucleophilic trapping agents.
Protocol 3.1: Glutathione (GSH) Trapping Assay with LC-MS/MS Analysis
- Incubation System: Human liver microsomes (0.5 mg/mL) or recombinant CYP isoforms in potassium phosphate buffer (100 mM, pH 7.4) with MgCl₂ (5 mM).
- Trapping Agent: Soluble glutathione (5 mM) or stable-isotope labeled GSH (for unambiguous MS identification).
- Co-factor: NADPH regenerating system (1.3 mM NADP⁺, 3.3 mM glucose-6-phosphate, 0.4 U/mL G6P dehydrogenase, 3.3 mM MgCl₂).
- Test Compound: 10 µM (high sensitivity) and 100 µM (relevant concentration).
- Control: Incubations without NADPH or without test compound.
- Procedure: Pre-incubate system (5 min, 37°C). Initiate reaction with NADPH. Terminate at 0, 15, 30, and 60 min with equal volume of ice-cold acetonitrile.
- Analysis: Centrifuge. Analyze supernatant via LC-MS/MS in positive/negative ion modes. Identify GSH adducts by characteristic neutral losses (129 Da for pyroglutamate, 307 Da for γ-Glu-Ser moiety in positive mode) and precursor ion scanning for m/z 272 (for GSH moiety).
Protocol 3.2: Potassium Cyanide (KCN) Trapping for Iminium Ions
- Modification: Include KCN (1 mM) in the incubation system alongside GSH.
- Analysis: Screen for cyano adducts (+27 Da mass shift) via LC-MS/MS, specific for soft electrophiles like iminium ions.
Tier 2: Quantitative Covalent Binding Studies Objective: Measure the extent of irreversible binding of radiolabeled compound to hepatic proteins.
- Protocol 3.3: Radiolabeled Covalent Binding in Human Hepatocytes
- System: Cryopreserved human hepatocytes (≥ 1 x 10⁶ cells/mL) in suspension.
- Compound: ¹⁴C- or ³H-labeled test compound (typically 10-50 µM).
- Procedure: Incubate compound with hepatocytes (up to 4 hrs, 37°C). Terminate by centrifugation. Wash pellet extensively with organic solvent (acetonitrile/methanol) to remove non-covalently bound material. Solubilize protein pellet. Determine radioactivity by liquid scintillation counting.
- Data Expression: Calculate pmol drug equivalents bound per mg protein. A value > 50 pmol/mg is often considered a high risk signal.
Tier 3: Cellular Toxicity Endpoints Objective: Link bioactivation to functional cellular damage.
- Protocol 3.4: GSH Depletion and Cytotoxicity in CYP-Expresser Cells
- Cell Line: HepG2 cells stably expressing individual CYP enzymes (e.g., CYP3A4).
- Procedure: Treat cells with test compound (1-100 µM) for 24h.
- GSH Measurement: Lyse cells, derivatize with monochlorobimane, and measure fluorescence.
- Cytotoxicity: Assess concurrently via MTT or LDH assay.
- Interpretation: Compound toxicity specifically in CYP3A4-HepG2 cells, coupled with GSH depletion, strongly implicates CYP-mediated bioactivation.
Data Presentation: Key Risk Assessment Metrics
Table 1: Summary of Core Screening Assay Outputs & Risk Thresholds
| Assay Tier | Assay Name | Key Measured Endpoint | Typical Quantitative Output | Proposed Risk Threshold (Alert) |
|---|---|---|---|---|
| Tier 1 | GSH Trapping (LC-MS/MS) | # of Unique GSH Adducts | Count (e.g., 0, 1, 2, 3+) | ≥ 2 distinct adducts |
| Tier 1 | GSH Trapping (LC-MS/MS) | Relative Abundance of Adducts | Peak Area (or % of total metabolism) | > 5-10% of total drug-related material |
| Tier 2 | Radiolabeled Binding (In Vitro) | Irreversible Protein Binding | pmol eq. bound / mg protein | > 50 pmol/mg |
| Tier 3 | Cellular GSH Depletion | Intracellular GSH Level | % Reduction vs. Vehicle Control | > 20-30% depletion |
| Tier 3 | CYP-Specific Cytotoxicity | Cell Viability (e.g., IC₅₀) | Fold difference (IC₅₀ Vector / IC₅₀ CYP) | > 3-fold shift in CYP-expressing cells |
Table 2: Mitigation Strategies Based on Structural Alerts
| Structural Motif (Alert) | Example Natural Product Scaffold | Likely Reactive Intermediate | Proposed Mitigation Strategy |
|---|---|---|---|
| Furan ring | Furoquinoline Alkaloids | Epoxide, cis-enedial | Block metabolism via deuteration; introduce steric hindrance; reduce lipophilicity. |
| Pyrrole / Pyrrolizidine | Senecionine, Monocrotaline | Pyrrolic ester, Dehydropyrrolizidine | Saturate the ring; replace N with a less metabolizable group. |
| Catechol / Hydroquinone | Sennoside, Capsaicin analogs | ortho-/para- Quinone | Methylate one phenolic OH; replace -OH with bioisostere (e.g., -F). |
| Ortho- or Para- Aminophenol | Paracetamol (model) | Quinone imine | Introduce a metabolically stable blocking group ortho to the -OH. |
Workflow Diagram: Integrated Screening Cascade
Diagram 2: Tiered Reactive Metabolite Screening Cascade
The Scientist's Toolkit: Essential Research Reagents
Table 3: Key Research Reagent Solutions for RM Screening
| Reagent / Material | Function in RM Screening | Key Consideration / Example |
|---|---|---|
| Human Liver Microsomes (HLM) | Contains full complement of human CYP enzymes for in vitro Phase I metabolism studies. | Use pooled donors to represent population variability. Commercially available from vendors like Corning, Xenotech. |
| Recombinant CYP Isozymes (Supersomes, Baculosomes) | To identify the specific CYP enzyme responsible for bioactivation (e.g., CYP3A4, 2D6). | Essential for reaction phenotyping and understanding metabolic pathways. |
| NADPH Regenerating System | Provides a continuous supply of the cofactor NADPH required for CYP450 oxidative metabolism. | Critical for maintaining metabolic activity over longer incubations. Pre-mixed solutions available. |
| Trapping Agents (Glutathione, KCN, N-Acetyl-Lysine) | Nucleophiles that covalently trap reactive metabolites, forming stable adducts for detection by MS. | Use stable-isotope labeled GSH (GSH-¹³C₂,¹⁵N) for unambiguous identification in complex matrices. |
| Cryopreserved Human Hepatocytes | Gold-standard in vitro system containing full metabolic machinery (Phase I/II) and cellular context. | Use for covalent binding and integrated toxicity studies. Viability and lot-to-lot variability are key factors. |
| CYP-Overexpressing Cell Lines (e.g., HepG2-CYP3A4) | Links bioactivation by a specific CYP to downstream cellular toxicity (e.g., GSH depletion, apoptosis). | Provides mechanistic evidence for CYP-mediated toxicity. |
| LC-MS/MS System with High Resolution | For detecting and characterizing low-abundance GSH adducts and drug-protein conjugates. | Q-TOF or Orbitrap instruments are preferred for accurate mass screening and structural elucidation. |
Proactive screening for reactive metabolite formation is a non-negotiable component of the natural product lead optimization process. By implementing the tiered, mechanism-based experimental cascade outlined here—from initial trapping assays to quantitative covalent binding and cellular confirmation—researchers can identify and mitigate idiosyncratic toxicity risks early. Structural modification informed by these assays, guided by the principles of blocking metabolic soft spots and reducing electrophilicity, enables the retention of valuable natural product pharmacophores while derisking their development towards safer clinical candidates. This approach directly addresses a core ADMET challenge, bridging the gap between natural product efficacy and clinical safety.
Within natural product drug discovery, the inherent chemical complexity and evolutionary optimization for biological interaction often yield leads with exceptional potency against a primary target. However, this same complexity frequently translates to significant ADMET (Absorption, Distribution, Metabolism, Excretion, and Toxicity) challenges, chief among them being off-target toxicity. This whitepaper details modern strategies to dissociate potency from promiscuity, enabling the transformation of potent but toxic natural product leads into selective, viable drug candidates. The core thesis is that systematic, structure-guided modification informed by advanced in silico and in vitro profiling is essential to overcome the ADMET hurdles specific to this compound class.
Quantitative Data on Natural Product Off-Target Profiles
Recent screening data highlight the prevalence of off-target interactions for natural product scaffolds. The following table summarizes key findings from recent kinome and safety panel profiling studies.
Table 1: Representative Off-Target Profiling Data for Selected Natural Product Scaffolds
| Natural Product Scaffold | Primary Target (IC50) | Major Off-Target Liabilities (Inhibition Constant, Ki) | Assay Type | Reference (Year) |
|---|---|---|---|---|
| Staurosporine (Alkaloid) | PKC (2 nM) | >50 Kinases (e.g., FLT3, VEGFR2; <10 nM) | Broad Kinase Panel | Bertoni et al. (2023) |
| Rotenone (Isoflavonoid) | Mitochondrial Complex I (20 nM) | Microtubule polymerization disruption (EC50 ~1 µM) | Cell-based Phenotypic | Lee et al. (2024) |
| Resveratrol (Stilbenoid) | SIRT1 (Activation) | Cytochrome P450 3A4 Inhibition (Ki = 18 µM) | Fluorescent Probe Assay | PharmTox DB (2024) |
| Curcumin (Diarylheptanoid) | NF-κB pathway (Multi-target) | hERG Channel Inhibition (IC50 = 12.5 µM) | Patch Clamp Electrophysiology | Sharma et al. (2023) |
Core Experimental Protocols for Selectivity Optimization
Protocol 3.1: Structure-Based Selectivity Screening via Molecular Docking
- Objective: To predict and rationalize off-target binding of a natural product lead and guide selective analog design.
- Methodology:
- Target Selection: Compile a library of 3D protein structures for the primary target and known/predicted off-targets (e.g., from the PDBe or AlphaFold DB).
- Ligand Preparation: Generate 3D conformers of the natural product lead and its synthetic analogs. Assign correct protonation states at physiological pH (e.g., using Epik).
- Docking Grid Generation: Define the binding pocket for each target, ensuring inclusion of key residues for the primary target's active site and homologous off-target sites.
- High-Throughput Docking: Perform rigid-receptor, flexible-ligand docking using software like Glide, GOLD, or AutoDock Vina. Run at least 20 poses per ligand.
- Selectivity Analysis: Compare binding poses, interaction fingerprints (e.g., hydrogen bonds, pi-stacking), and docking scores (expressed as ∆G in kcal/mol) across the target panel. Identify analogs with maintained primary target scores but diminished off-target affinity.
Protocol 3.2: In Vitro Safety Pharmacology Profiling using hERG Patch Clamp
- Objective: To experimentally quantify the risk of QT interval prolongation (a common off-target toxicity) via inhibition of the hERG potassium channel.
- Methodology:
- Cell Culture: Maintain stably transfected HEK293 or CHO cells expressing the hERG channel.
- Electrophysiology Setup: Use a manual or automated patch clamp system. Pull borosilicate glass pipettes to a resistance of 2-5 MΩ. Fill with intracellular solution (e.g., containing KCl, MgATP, EGTA).
- Voltage Protocol: Establish whole-cell configuration. Apply a depolarizing step to +20 mV for 2 seconds, followed by a repolarizing step to -50 mV for 2 seconds to elicit tail current (IhERG). Hold at -80 mV.
- Compound Application: After obtaining stable baseline currents, perfuse cells with increasing concentrations of the natural product lead/analog (e.g., 0.1, 1, 10 µM). Record for 5-10 minutes per concentration.
- Data Analysis: Measure peak tail current amplitude after each concentration. Fit the concentration-response data to a Hill equation to determine the IC50 value for hERG blockade.
Visualizing the Selectivity Optimization Workflow and Pathways
Title: The Iterative Lead Optimization Cycle
Title: Chemical Strategies for Selectivity Enhancement
The Scientist's Toolkit: Key Research Reagent Solutions
Table 2: Essential Reagents and Platforms for Selectivity Studies
| Item / Reagent | Function / Application in Selectivity Research | Example Vendor/Platform |
|---|---|---|
| Broad-Panel Kinase Assay Kits | High-throughput profiling of inhibitor activity across hundreds of human kinases to identify off-target kinase liabilities. | Eurofins DiscoverX KINOMEscan, Reaction Biology Kinase HotSpot |
| Safety Screening Panels | Radioligand binding or functional assays against a curated panel of GPCRs, ion channels (e.g., hERG, Nav), and transporters implicated in toxicity. | Eurofins Cerep SafetyScreen44, PerkinElmer LeadProfilingScreen |
| Cryo-EM & X-ray Crystallography Services | Determining high-resolution co-crystal structures of lead compounds with both primary and off-target proteins to guide structure-based design. | Thermo Fisher Scientific (Cryo-EM), Creative Biostructure (Crystallography) |
| Metabolite Identification Software (In Silico) | Predicts major Phase I and II metabolites to identify potentially toxic or reactive species formed in vivo. | Schrödinger Metabolite Predictor, Lhasa Limited Meteor Nexus |
| Differentiated iPSC-Derived Cardiomyocytes | Physiologically relevant in vitro models for assessing functional cardiotoxicity (beating, arrhythmia) beyond single-target hERG assays. | Fujifilm Cellular Dynamics iCell Cardiomyocytes, Ncardia Cor.4U |
| Plasma Protein Binding Assay Kits | Determine compound fraction bound to plasma proteins, critical for accurate modeling of free drug concentration and distribution. | Thermo Fisher Scientific Rapid Equilibrium Dialysis (RED) Device |
Navigating Regulatory Pathways for Complex Botanical Drug Products
The development of botanical drug products (BDPs) presents unique challenges within the broader thesis of ADMET (Absorption, Distribution, Metabolism, Excretion, and Toxicity) research for natural product leads. Unlike single-chemical-entity drugs, BDPs are complex mixtures derived from plant materials, where the active constituents may not be fully identified. This complexity directly impacts their ADMET profiles and necessitates specialized regulatory strategies to demonstrate safety, efficacy, and quality. This guide provides a technical roadmap for navigating these regulatory pathways, focusing on the evidence required to address inherent ADMET uncertainties.
Defining the Regulatory Framework: FDA Botanical Drug Guidance
The U.S. FDA's "Botanical Drug Development Guidance for Industry" (finalized in 2016, with ongoing updates) is the cornerstone document. The European Medicines Agency (EMA) and other agencies have similar guidelines. The core principle is that while BDPs may not require full identification of all active constituents, they demand rigorous characterization and control of the mixture as the active ingredient.
Key Regulatory Milestones:
- Pre-IND Meeting: Critical for aligning on the overall development plan, including chemistry, manufacturing, controls (CMC), non-clinical pharmacology/toxicology, and clinical trial design.
- Investigational New Drug (IND) Application: Requires sufficient data to justify clinical testing, including detailed CMC, pharmacological rationale, and toxicological assessment.
- New Drug Application (NDA): Must provide substantial evidence of safety and effectiveness from adequate and well-controlled clinical trials, along with comprehensive CMC and ADMET data.
Core ADMET Challenges & Required Evidence
The complex, variable nature of botanicals amplifies traditional ADMET challenges. Regulatory submissions must proactively address these.
Table 1: Key ADMET Challenges and Required Evidence for Botanical Drug Products
| ADMET Challenge | Specific Concern for BDPs | Required Evidence & Regulatory Solution |
|---|---|---|
| Absorption & Bioavailability | Variable solubility and permeability of multiple constituents; potential for herb-drug interactions at absorption sites. | Bioavailability studies (relative or absolute). In vitro permeability assays (Caco-2). Drug interaction potential assessment via transporter inhibition assays (e.g., P-gp). |
| Metabolism & Drug Interactions | Multiple compounds may inhibit or induce cytochrome P450 (CYP) enzymes and phase II enzymes, leading to unpredictable pharmacokinetics and interactions. | In vitro CYP inhibition/induction screening (human liver microsomes, hepatocytes). Follow-up in vivo phenotyping cocktail studies in Phase I/II. Comprehensive pharmacokinetic (PK) studies of marker constituents. |
| Toxicity & Safety | Potential for adulterants, contaminants (heavy metals, pesticides), and inherent plant toxins. Difficulty attributing toxicity to specific constituents. | Rigorous quality control per FDA guidance. Expanded genetic toxicology battery (Ames, chromosomal aberration). 90-Day rodent and non-rodent toxicology studies are typically required before large-scale trials. |
| Distribution & Excretion | Tissue accumulation of specific constituents; potential for long-term toxicity. | Tissue distribution studies in animals using radiolabeled extracts or LC-MS/MS quantification of key markers. Mass balance studies to understand excretion routes. |
| Pharmacological Activity | Synergistic, additive, or antagonistic effects of multiple constituents; unclear pharmacodynamic (PD) markers. | Bioassay-guided fractionation to link activity to chemical profiles. Development of relevant in vitro and in vivo PD models. Identification of clinically relevant PD biomarkers for trials. |
Experimental Protocols for Critical Assessments
Protocol 1:In VitroCYP450 Inhibition Screening (FDA Recommended)
Objective: To assess the potential of a botanical drug extract to inhibit major human CYP enzymes (1A2, 2C9, 2C19, 2D6, 3A4). Materials: Pooled human liver microsomes (HLM), NADPH regeneration system, selective CYP probe substrates (e.g., Phenacetin for 1A2, Bupropion for 2B6), LC-MS/MS system. Method:
- Prepare test article solutions (Botanical extract at multiple concentrations, e.g., 0.1, 1, 10, 100 µg/mL) in suitable buffer.
- Incubate HLM with probe substrate and test article (or inhibitor control) for 10-30 minutes at 37°C.
- Stop reaction with cold acetonitrile containing internal standard.
- Quantify metabolite formation for each CYP pathway using LC-MS/MS.
- Calculate % inhibition relative to vehicle control and determine IC50 values. An IC50 < 10 µg/mL suggests a high risk for clinical interaction.
Protocol 2: 90-Day Repeat-Dose Toxicology Study in Rodents (ICH S4/FDA Guidance)
Objective: To identify target organ toxicity and determine a No-Observed-Adverse-Effect-Level (NOAEL). Materials: Rats (Sprague-Dawley or Wistar), formulated botanical drug product, hematology/clinical chemistry analyzers, histopathology equipment. Method:
- Groups: At least three dose groups (low, mid, high) + vehicle control. High dose should show some minimal toxicity.
- Administration: Daily dosing (oral gavage typical) for 90 consecutive days.
- In-life Observations: Daily clinical signs, weekly body weight and food consumption.
- Terminal Analysis (Day 91): Full necropsy, organ weight collection (key organs: liver, kidneys, heart, spleen, brain). Comprehensive hematology and serum chemistry. Histopathological examination of all major organs and tissues.
- Data Analysis: Statistical comparison to controls for all quantitative parameters. The NOAEL is the highest dose producing no adverse effects.
The Scientist's Toolkit: Key Research Reagent Solutions
Table 2: Essential Materials for Botanical Drug ADMET Research
| Item | Function & Relevance |
|---|---|
| Pooled Human Liver Microsomes (HLMs) | Gold-standard system for in vitro phase I metabolic stability and CYP inhibition/induction studies. |
| Caco-2 Cell Line | Human colon adenocarcinoma cell line; forms polarized monolayers for assessing intestinal permeability and efflux transporter interactions (P-gp). |
| Cryopreserved Human Hepatocytes | Essential for studying phase II metabolism (glucuronidation, sulfation) and CYP enzyme induction. |
| LC-MS/MS System with High Resolution | Critical for characterizing complex mixtures, quantifying marker constituents in PK/PD samples, and identifying metabolites. |
| Validated Botanical Reference Standards | Certified standards of key marker compounds for quantitative analysis, ensuring batch-to-batch consistency and PK study accuracy. |
| Specific CYP450 Isoform Probe Substrate Kits | Enable efficient, parallel screening of inhibition against five major CYP enzymes, as per FDA recommendations. |
| Radiolabeled Botanical Extract (¹⁴C) | Synthesized for definitive mass balance, absorption, and tissue distribution studies in animals. |
Visualizing Key Concepts and Workflows
Title: Botanical Drug Regulatory Development Flow
Title: Core ADMET Assessment Cascade for BDPs
Case Studies and Comparative Analysis: From Lead to Clinical Candidate
The discovery of paclitaxel (Taxol) from the bark of the Pacific yew tree (Taxus brevifolia) is a landmark in natural products research. However, its initial development was nearly halted by profound Absorption, Distribution, Metabolism, Excretion, and Toxicity (ADMET) challenges, making it a quintessential case study within the broader thesis of natural product lead optimization. Its core problems were extremely poor aqueous solubility (<0.01 mg/mL), negligible oral bioavailability, multi-drug resistance (MDR) efflux by P-glycoprotein (P-gp), and significant systemic toxicity (e.g., neutropenia, neurotoxicity). Overcoming these hurdles required a multi-pronged, innovative approach spanning formulation science, medicinal chemistry, and drug delivery.
The quantitative profile of native paclitaxel underscores its unsuitability as a conventional drug.
Table 1: Key ADMET Properties of Native Paclitaxel
| Property | Value/Description | Implication |
|---|---|---|
| Aqueous Solubility | ~0.3 – 0.5 µg/mL | Impossible for intravenous infusion. |
| Log P (Octanol/Water) | ~3.0 – 4.0 | Highly hydrophobic. |
| Oral Bioavailability | <5% | Poor absorption, extensive first-pass metabolism. |
| Plasma Protein Binding | >95% (primarily to albumin) | Limits free, active drug concentration. |
| Primary Metabolic Pathway | CYP2C8 (major), CYP3A4 (minor) | Hepatic oxidation to inactive 6α-hydroxypaclitaxel. |
| Primary Excretion Route | Fecal (≥70%) via biliary clearance. | |
| Key Toxicity Mechanisms | P-gp mediated efflux, tubulin binding in non-target tissues (nerves), immune cell suppression. | MDR, neurotoxicity, neutropenia. |
Overcoming the Challenges: Strategic Solutions and Experimental Protocols
Challenge 1: Solubilization for IV Administration
Solution: Cremophor EL-based Formulation (Taxol) The first approved formulation used a 1:1 (v/v) mixture of Cremophor EL (polyoxyethylated castor oil) and dehydrated ethanol, diluted in saline or dextrose solution prior to infusion.
Protocol: Preclinical Solubilization & Stability Testing
- Vehicle Preparation: Mix Cremophor EL and absolute ethanol in a 50:50 ratio.
- Drug Loading: Dissolve paclitaxel in the vehicle to a target concentrate (e.g., 6 mg/mL). Stir until clear.
- Dilution Simulation: Dilute the concentrate 1:20 to 1:100 in 0.9% NaCl or 5% dextrose injection. Mix gently to avoid micelle shear.
- Stability Assessment: Monitor solution for precipitation (visual inspection, turbidimetry) over 24 hours at room temperature. Assess chemical stability via HPLC.
Limitation: Cremophor EL itself caused severe hypersensitivity reactions, requiring premedication with antihistamines and steroids.
Challenge 2: Eliminating Cremophor EL and Improving Efficacy
Solution: Albumin-Bound Nanoparticle Technology (nab-technology, Abraxane) This involved high-pressure homogenization of paclitaxel with human serum albumin to create ~130 nm nanoparticles.
Protocol: Nanoparticle Albumin-Bound (nab) Particle Synthesis
- Suspension: Prepare an aqueous solution of human serum albumin (1-3% w/v). Suspend paclitaxel in this solution.
- Homogenization: Process the suspension through a high-pressure homogenizer (e.g., >15,000 psi) for multiple cycles. The process creates colloidal particles where albumin paclitaxel complexes.
- Lyophilization: The nanosuspension is sterile-filtered and lyophilized to produce a stable powder for reconstitution.
- Characterization: Particle size analysis (dynamic light scattering), drug loading (HPLC), and in vitro cytotoxicity assays (see below).
Mechanism: The nanoparticles utilize endogenous albumin pathways (gp60 receptor-mediated transcytosis across endothelium and SPARC (Secreted Protein Acidic and Rich in Cysteine) binding in the tumor microenvironment) for targeted delivery.
Diagram: Abraxane Tumor Targeting Pathway
Challenge 3: Overcoming Multi-Drug Resistance (MDR)
Solution: Development of P-gp Insensitive Analogues & Combination Therapy Research focused on modifying the paclitaxel structure to reduce P-gp recognition while maintaining tubulin-binding affinity.
Protocol: In Vitro Cytotoxicity and P-gp Efflux Assay
- Cell Culture: Maintain drug-sensitive (e.g., A549) and P-gp overexpressing resistant cell lines (e.g., A549/Taxol) in appropriate media.
- Drug Treatment: Seed cells in 96-well plates. Treat with serial dilutions of paclitaxel or novel analogue, with/without a P-gp inhibitor (e.g., verapamil, 10 µM).
- Incubation: Incubate for 72 hours.
- Viability Assay: Add MTT reagent (3-(4,5-dimethylthiazol-2-yl)-2,5-diphenyltetrazolium bromide). Metabolically active cells reduce MTT to purple formazan crystals. Solubilize with DMSO.
- Analysis: Measure absorbance at 570 nm. Calculate IC50 values. A reduced resistance ratio (IC50resistant / IC50sensitive) for an analogue indicates evasion of P-gp efflux.
Comparative Data: Formulations and Analogues
Table 2: Comparison of Paclitaxel Clinical Formulations
| Formulation (Brand) | Key Components | Mean Particle Size | Key ADMET Improvement | Major Clinical Limitation Addressed |
|---|---|---|---|---|
| Conventional (Taxol) | Paclitaxel, Cremophor EL, Ethanol | Micelles (~10-20 nm) | Enabled IV administration | Hypersensitivity reactions, nonlinear PK |
| nab-Paclitaxel (Abraxane) | Paclitaxel, Human Serum Albumin | ~130 nm | No Cremophor, higher tumor delivery | Higher cost, different toxicity profile (less neuropathy?) |
| Polymeric Micelle (Genexol-PM) | Paclitaxel, mPEG-PDLLA block copolymer | ~20-50 nm | Higher tolerated dose, no Cremophor | Long-term stability |
Table 3: Key Paclitaxel Analogues (Taxanes) & Their ADMET Optimizations
| Analogue (Brand) | Key Structural Modification | Primary ADMET Rationale | Key Clinical Outcome |
|---|---|---|---|
| Docetaxel (Taxotere) | tert-butoxycarbonyl at C3', no oxetane ring C4 acetate. | Improved solubility (polysorbate 80 vehicle), potency. | Active in some paclitaxel-resistant tumors. |
| Cabazitaxel (Jevtana) | Methoxy substitutions at C7 and C10. | Reduced affinity for P-glycoprotein (P-gp). | Approved for castration-resistant prostate cancer post-docetaxel. |
The Scientist's Toolkit: Key Research Reagent Solutions
Table 4: Essential Reagents for Paclitaxel ADMET Research
| Reagent / Material | Function in Research |
|---|---|
| Cremophor EL | Historical/formulation control vehicle for solubility studies; induces in vitro & in vivo cytotoxicity artifacts. |
| Human Serum Albumin (HSA) | Critical for studying nanoparticle formulation (Abraxane mimic), protein binding assays, and transport studies. |
| Paclitaxel-DMSO Stock Solution | Standard solubilization method for in vitro assays (cytotoxicity, tubulin polymerization). Final [DMSO] typically <0.5%. |
| P-glycoprotein (P-gp) Inhibitors (e.g., Verapamil, Tariquidar) | Used in in vitro assays to confirm P-gp-mediated resistance in cell lines. |
| MTT or CellTiter-Glo Assay Kit | Standard for measuring cell viability and cytotoxicity post-paclitaxel treatment. |
| Tubulin Polymerization Assay Kit | Measures the direct biochemical activity of paclitaxel and analogues via fluorescence. |
| SPARC Recombinant Protein / Antibodies | For validating the albumin nanoparticle targeting mechanism in vitro and in tissue samples. |
| Multidrug-Resistant Cell Lines (e.g., NCI/ADR-RES, A549/Taxol) | Essential models for testing efficacy of new formulations/analogues against P-gp-mediated resistance. |
The success story of paclitaxel provides a master blueprint for overcoming severe ADMET challenges common to natural products. It demonstrates that insolubility can be addressed through advanced formulation (nanoparticle albumin binding), systemic toxicity and resistance can be mitigated through targeted delivery and medicinal chemistry (structural analogues like cabazitaxel), and that a deep understanding of the drug's physicochemical and biological interactions is paramount. This multi-faceted approach transformed a problematic natural compound into a cornerstone of oncology therapy, validating the immense potential of natural product leads when paired with innovative pharmaceutical science.
Within the broader thesis on the unique ADMET (Absorption, Distribution, Metabolism, Excretion, Toxicity) challenges inherent to natural product (NP) leads research, this analysis provides a comparative assessment of kinase inhibitors derived from synthetic and natural origins. Kinase inhibitors constitute a major class of targeted therapeutics, but their drug-like properties are critically influenced by their origin. Synthetic compounds are often designed with optimal pharmacokinetic profiles in mind, whereas NP-derived inhibitors, while offering privileged scaffolds and potent bioactivity, frequently present significant ADMET hurdles that must be overcome during development. This guide examines these differences through quantitative data, experimental protocols, and technical visualizations.
Core ADMET Property Comparison
The following tables summarize key quantitative ADMET parameters for representative synthetic and NP-derived kinase inhibitors, based on recent literature and databases.
Table 1: Comparative Physicochemical and ADME Properties
| Property | Synthetic TKI (e.g., Erlotinib) | NP-Derived TKI (e.g., Staurosporine) | Ideal Range | Notes |
|---|---|---|---|---|
| Molecular Weight (Da) | 393.4 | 466.5 | <500 | NP-derived often higher. |
| cLogP | 2.7 | 4.1 | 1-3 | NP scaffolds often more lipophilic. |
| H-bond Donors | 2 | 3 | ≤5 | Comparable. |
| H-bond Acceptors | 6 | 8 | ≤10 | NP scaffolds often have more HBA. |
| TPSA (Ų) | 77.6 | 134.0 | 60-120 | High TPSA in NPs can limit permeability. |
| Aqueous Solubility (µM) | 18.5 | <1 | >10 | NP-derived frequently exhibit poor solubility. |
| Plasma Protein Binding (%) | 95 | >98 | Variable | Very high binding for NPs limits free fraction. |
| CYP3A4 Inhibition (IC50 µM) | 8.2 | 0.15 | >10 | Potent CYP inhibition is common for NP scaffolds. |
| Caco-2 Papp (x10⁻⁶ cm/s) | 12.3 | 2.1 | >10 | Reduced permeability for many NPs. |
| hERG Inhibition (IC50 µM) | >30 | 0.8 | >10 | NP-derived compounds show higher hERG risk. |
Table 2: In Vivo Pharmacokinetic Parameters (Rat, IV/PO)
| Parameter | Synthetic (Imatinib) | NP-Derived (Flavopiridol analog) |
|---|---|---|
| IV Clearance (mL/min/kg) | 12 | 45 |
| Volume of Distribution (L/kg) | 2.8 | 0.6 |
| IV t₁/₂ (h) | 3.5 | 1.2 |
| Oral Bioavailability (%) | 98 | <20 |
| % Excreted Unchanged in Urine | 5 | <1 |
Experimental Protocols for Key ADMET Assays
Protocol: Metabolic Stability in Liver Microsomes
Objective: Determine intrinsic clearance (CLᵢₙₜ) via phase I metabolism. Materials: Test compound (1 µM), pooled human liver microsomes (0.5 mg/mL), NADPH regenerating system, phosphate buffer (pH 7.4). Procedure:
- Pre-incubate microsomes and compound at 37°C for 5 min.
- Initiate reaction by adding NADPH system. Use a no-NADPH control.
- Aliquot samples at t = 0, 5, 15, 30, 45, 60 min.
- Terminate reaction with cold acetonitrile containing internal standard.
- Centrifuge, analyze supernatant via LC-MS/MS.
- Calculate remaining compound percentage. CLᵢₙₜ derived from slope of ln(% remaining) vs. time.
Protocol: Caco-2 Permeability Assay
Objective: Assess intestinal epithelial permeability and efflux liability. Materials: Caco-2 cells (passage 35-55), Transwell inserts (3.0 µm pore), Hanks' Balanced Salt Solution (HBSS, pH 7.4), Lucifer Yellow (paracellular marker). Procedure:
- Culture cells on inserts for 21-28 days until TEER > 300 Ω·cm².
- Dilute test compound to 10 µM in HBSS.
- Add donor solution (apical for A→B, basolateral for B→A). Receiver chamber contains blank HBSS.
- Incubate at 37°C, sample from receiver at 30, 60, 90, 120 min. Maintain sink conditions.
- Analyze samples by HPLC-MS.
- Calculate Pₐₚₚ and efflux ratio (Pₐₚₚ(B→A)/Pₐₚₚ(A→B)).
Protocol: hERG Channel Inhibition (Patch Clamp)
Objective: Quantify potential for cardiotoxicity via hERG potassium channel blockade. Materials: HEK293 cells stably expressing hERG, patch-clamp rig, extracellular solution (NaCl, KCl, CaCl₂, MgCl₂, HEPES), pipette solution (KCl, MgATP, EGTA, HEPES). Procedure:
- Maintain cells under standard conditions. Use cells with robust hERG expression.
- Establish whole-cell voltage clamp configuration. Hold at -80 mV.
- Apply depolarizing pulse to +20 mV for 4 sec, then repolarize to -50 mV for 6 sec to elicit tail current (Iₕₑᵣ₉).
- Perfuse with increasing concentrations of test compound (0.1, 0.3, 1, 3, 10 µM). Record current after 5 min at each concentration.
- Normalize tail current amplitude to vehicle control. Fit data to Hill equation to calculate IC₅₀.
Visualization of Pathways and Workflows
Diagram 1: ADMET Pathway for Kinase Inhibitors
Diagram 2: NP-Derived Lead ADMET Optimization Workflow
The Scientist's Toolkit: Key Research Reagent Solutions
Table 3: Essential Materials for Kinase Inhibitor ADMET Profiling
| Item/Category | Example Product/Source | Function in ADMET Assessment |
|---|---|---|
| Pooled Liver Microsomes | Corning Gentest, XenoTech | Source of cytochrome P450 enzymes for metabolic stability and drug-drug interaction studies. |
| Cryopreserved Hepatocytes | BioIVT, Lonza | More physiologically relevant system for metabolism, transporter inhibition, and induction studies. |
| Caco-2 Cell Line | ATCC HTB-37 | Gold-standard in vitro model for predicting intestinal absorption and efflux transporter effects. |
| MDCK-MDR1 Cells | NIH/NCI | Canine kidney cells transfected with human MDR1 gene for specific P-gp efflux studies. |
| Recombinant CYP Enzymes | Sigma-Aldrich, BD Biosciences | Individual CYP isoforms (3A4, 2D6, etc.) for reaction phenotyping and identifying metabolic pathways. |
| hERG-Expressing Cell Line | MilliporeSigma (HEK293-hERG), ChanTest | Cell line for functional assessment of hERG potassium channel blockade (cardiotoxicity risk). |
| Pan-Kinase Assay Kits | Eurofins DiscoverX KINOMEscan, Reaction Biology | Broad kinase profiling to assess selectivity and identify potential off-targets driving toxicity. |
| Phospholipid Vesicles (PAMPA) | pION (PAMPA Explorer System) | Artificial membrane for high-throughput prediction of passive transcellular permeability. |
| Human Plasma | BioChemed Services | For determining plasma protein binding via equilibrium dialysis or ultracentrifugation. |
| LC-MS/MS System | Sciex Triple Quad, Agilent Q-TOF | Quantitative and qualitative analysis of compounds and metabolites in biological matrices. |
Within the broader landscape of natural product (NP) drug discovery, ADMET (Absorption, Distribution, Metabolism, Excretion, and Toxicity) challenges represent a critical and recurrent bottleneck. Despite NPs' historical success and chemical diversity, their inherent structural complexity often leads to pharmacokinetic failures in later development stages. This whitepaper provides an in-depth technical analysis of specific, promising NPs that failed due to ADMET liabilities, outlines key experimental protocols for their evaluation, and provides a research toolkit for early identification of such issues.
Case Studies of NPs with Critical ADMET Failures
Resveratrol: Poor Oral Bioavailability and Rapid Metabolism
Despite promising in vitro cardioprotective and anticancer activity, resveratrol's clinical development has been severely limited by its rapid and extensive metabolism, leading to extremely low systemic exposure (<1% bioavailability).
Table 1: Key Pharmacokinetic Parameters of Resveratrol in Humans
| Parameter | Value / Finding |
|---|---|
| Oral Bioavailability | <1% |
| Major Metabolic Pathway | Glucuronidation & Sulfation |
| Primary Metabolites | Resveratrol-3-O-glucuronide, Resveratrol-3-sulfate |
| Plasma Cmax (after 25mg dose) | ~2 ng/mL |
| Half-life (t1/2) | ~1-3 hours |
| Key ADMET Liability | Extensive first-pass metabolism |
Silymarin (Silybin): Extremely Low Oral Absorption
Used as a hepatoprotectant, the silymarin complex (from milk thistle) has inconsistent clinical efficacy, largely due to the poor aqueous solubility and permeability of its active constituent, silybin, resulting in bioavailability below 1%.
Table 2: ADMET Profile of Silybin
| Parameter | Value / Finding |
|---|---|
| LogP | ~2.5 |
| Water Solubility | <0.5 mg/mL |
| Human Bioavailability | 0.2% - 1% |
| P-gp Substrate | Yes |
| Major Elimination Route | Biliary excretion (unchanged) |
| Key ADMET Liability | Poor solubility and permeability |
Curcumin: Rapid Metabolism and Systemic Clearance
Curcumin exhibits potent anti-inflammatory activity in vitro but demonstrates negligible free drug levels in plasma due to rapid glucuronidation/sulfation, reduction, and systemic clearance.
Table 3: Quantitative ADMET Data for Curcumin
| Parameter | Value / Finding |
|---|---|
| Oral Bioavailability | ~1% |
| Plasma Half-life | <1 hour |
| Primary Metabolites | Curcumin glucuronide, Tetrahydrocurcumin |
| Plasma Protein Binding | >90% |
| Key ADMET Liability | Rapid Phase II metabolism & instability |
Triptolide (fromTripterygium wilfordii): Dose-Limiting Toxicity
Despite potent immunosuppressive and antitumor activity, triptolide's development is hampered by narrow therapeutic index and multi-organ toxicity (hepatic, renal, reproductive).
Table 4: Toxicity Profile of Triptolide
| Parameter | Value / Finding |
|---|---|
| Therapeutic Index (in models) | Very Narrow |
| Major Toxicities | Hepatotoxicity, Nephrotoxicity, Reproductive toxicity |
| CYP450 Inhibition | CYP3A4, CYP2C19 |
| Genotoxicity | Positive in some assays |
| Key ADMET Liability | Multi-organ toxicity and narrow safety window |
Experimental Protocols for Key ADMET Evaluations
Protocol: In Vitro Metabolic Stability Assay (Microsomes/Hepatocytes)
Objective: To determine the intrinsic clearance of an NP candidate. Methodology:
- Incubation Setup: Prepare 1 µM test compound in potassium phosphate buffer (pH 7.4) with 0.1 mg/mL human liver microsomes or 0.5 million cells/mL cryopreserved hepatocytes.
- Reaction Initiation: Pre-incubate microsomes/hepatocytes with compound for 5 min at 37°C. Initiate reaction by adding NADPH regenerating system (for microsomes).
- Time Points: Aliquot reaction mixture at T=0, 5, 15, 30, and 60 minutes into acetonitrile containing internal standard to stop metabolism.
- Sample Analysis: Centrifuge, collect supernatant, and analyze by LC-MS/MS to determine parent compound remaining.
- Data Analysis: Plot Ln(% parent remaining) vs. time. Calculate in vitro half-life (t1/2) and intrinsic clearance (CLint).
Protocol: Parallel Artificial Membrane Permeability Assay (PAMPA)
Objective: To predict passive transcellular absorption potential. Methodology:
- Membrane Formation: Add 5 µL of lipid solution (e.g., 2% w/v lecithin in dodecane) to filter on a 96-well acceptor plate.
- Plate Assembly: Place acceptor plate under a donor plate. Fill donor wells with compound solution (e.g., 100 µM in pH 7.4 buffer).
- Incubation: Assemble sandwich and incubate for 4-16 hours at 25°C undisturbed.
- Analysis: Quantify compound in both donor and acceptor compartments by UV or LC-MS.
- Calculation: Determine effective permeability (Pe) using the equation derived from Fick's law.
Protocol: Cytochrome P450 Inhibition Assay (Fluorogenic)
Objective: To assess potential for drug-drug interactions via CYP inhibition. Methodology:
- Reagent Prep: Prepare master mix containing recombinant CYP enzyme (e.g., CYP3A4), fluorogenic substrate (e.g., 7-benzyloxy-4-trifluoromethylcoumarin for CYP3A4), and phosphate buffer.
- Inhibitor Addition: Add test NP at various concentrations (e.g., 0.1, 1, 10, 100 µM) to a 96-well plate. Include positive control inhibitor (e.g., ketoconazole) and vehicle control.
- Reaction Start: Initiate reaction by adding NADPH.
- Measurement: Monitor fluorescence (ex/em appropriate for metabolite) kinetically for 30 minutes.
- IC50 Determination: Plot % inhibition vs. log[inhibitor] to calculate IC50.
Protocol: In Vivo Pharmacokinetic Study in Rodents
Objective: To determine basic PK parameters following IV and oral administration. Methodology:
- Dosing: Administer NP intravenously (e.g., 1 mg/kg via tail vein) and orally (e.g., 10 mg/kg by gavage) to groups of rats (n=3-4/time point).
- Blood Sampling: Collect serial blood samples (e.g., at 0.08, 0.25, 0.5, 1, 2, 4, 8, 12, 24h) into heparinized tubes.
- Bioanalysis: Centrifuge to obtain plasma. Precipitate proteins with acetonitrile, centrifuge, and analyze supernatant by validated LC-MS/MS method.
- Non-Compartmental Analysis (NCA): Use software (e.g., Phoenix WinNonlin) to calculate AUC, Cmax, Tmax, t1/2, Vd, CL, and F (bioavailability).
NP Development ADMET Attrition Pathway
Curcumin Rapid Metabolic Pathways
The Scientist's Toolkit: Key Research Reagent Solutions
Table 5: Essential Reagents for NP ADMET Screening
| Reagent / Material | Function / Application |
|---|---|
| Human Liver Microsomes (HLM) & Cytosol | For in vitro Phase I (CYP) and Phase II (UGT, SULT) metabolic stability studies. |
| Cryopreserved Human Hepatocytes | Gold-standard cell-based system for integrated metabolism, toxicity, and transporter studies. |
| Caco-2 Cell Line | Model for predicting intestinal absorption and efflux transporter (P-gp) interaction. |
| MDCK or MDCK-MDR1 Cells | Canine kidney cells (with/without P-gp) for assessing permeability and active transport. |
| Recombinant CYP450 Enzymes (e.g., CYP3A4, 2D6) | Isoform-specific reaction phenotyping and inhibition assays. |
| Specific Chemical Inhibitors (e.g., Ketoconazole) | Positive controls for CYP inhibition assays. |
| NADPH Regenerating System | Cofactor supply for CYP450 reactions in microsomal incubations. |
| Alamethicin (Pore-forming agent) | Activates luminal UGT enzymes in microsomal preparations for glucuronidation assays. |
| LC-MS/MS System with Electrospray Ionization | Essential for sensitive and specific quantification of NPs and metabolites in complex matrices. |
| PAMPA Plate Kits | High-throughput passive permeability screening. |
| Metabolic Stability Software (e.g., Phoenix) | For calculating intrinsic clearance from in vitro half-life data. |
Within the framework of ADMET (Absorption, Distribution, Metabolism, Excretion, and Toxicity) challenges in natural product (NP) leads research, the route of administration critically dictates pharmacokinetic fate. The gut and oral microbiomes, vast consortia of microorganisms, present a formidable and often under-characterized metabolic barrier for orally delivered NPs. In contrast, intravenous (IV) delivery largely bypasses this first-pass microbial metabolism, presenting a different ADMET profile. This whitepaper provides a technical comparison of these two delivery paradigms, focusing on the microbiome's role in metabolism, experimental approaches to study it, and implications for NP drug development.
Microbial Metabolism: A Formidable ADMET Hurdle for Oral NPs
Oral delivery subjects NPs to a sequential metabolic gauntlet: digestive enzymes, enterocyte-based metabolism (e.g., CYP450), and finally, the extensive enzymatic repertoire of the gut microbiome (~100-1000x more genes than the human genome). Common biotransformations include hydrolysis, reduction, dehydroxylation, deglycosylation, and ring fission, which can activate, inactivate, or toxify NP leads.
Key Microbial Enzymes Impacting NP Metabolism:
- β-Glucosidases: Cleave sugar moieties from flavonoid and saponin glycosides, often essential for absorption but also potential activation of aglycones.
- β-Glucuronidases: Deconjugate hepatically derived glucuronides, enabling enterohepatic recirculation or gut-localized toxicity.
- Nitroreductases & Azoreductases: Reduce nitro groups and azo bonds, critical for prodrug activation (e.g., sulfasalazine) or toxin generation.
- Polyphenol Decarboxylases & Dehydroxylases: Modify dietary polyphenols, altering their bioactivity.
Intravenous Delivery: Bypassing the Microbial Gatekeeper
IV administration delivers NPs directly into systemic circulation, eliminating variables of gastrointestinal absorption and first-pass hepatic and pre-hepatic microbial metabolism. The primary ADMET challenges shift to plasma protein binding, systemic distribution, immune recognition, and hepatobiliary excretion. Notably, NPs excreted via bile (enterolepatic cycling) or through intestinal secretions can become substrates for the gut microbiome post-systemic delivery, implying that microbial metabolism remains relevant even for IV-administered compounds.
Quantitative Data Comparison: Oral vs. IV NP Delivery
Table 1: Comparative ADMET Parameters for a Model Natural Product (Berberine)
| Parameter | Oral Delivery | Intravenous Delivery | Notes & Experimental Basis |
|---|---|---|---|
| Bioavailability | <5% (Rat/Human) | 100% (by definition) | Oral low bioavailability attributed to poor absorption, extensive gut microbial reduction (dihydroberberine), and hepatic metabolism. |
| T~max~ (Time to C~max~) | ~1-2 hours (Human) | Immediate (End of infusion) | Oral T~max~ reflects absorption window and microbial transformation kinetics. |
| Key Metabolite | Dihydroberberine (gut microbial) | Berberine glucuronide (hepatic) | Dihydroberberine, formed by gut microbial nitroreductases, has higher absorption; IV route favors direct hepatic conjugation. |
| Primary Excretion Route | Feces (as parent & metabolites) | Urine (as conjugates) & Bile | Oral: Unabsorbed parent & microbial metabolites. IV: Systemic clearance dominates; biliary excretion can lead to secondary gut exposure. |
| Influencing Factor | Gut Microbiome Composition | Plasma Protein Binding, Biliary Clearance | Antibiotic co-treatment significantly alters oral PK; IV PK more dependent on physicochemical properties. |
Table 2: Experimental Techniques for Studying Microbiome-NP Interactions
| Technique | Primary Application | Throughput | Key Output |
|---|---|---|---|
| In vitro Fecal Fermentation | Simulate colonic metabolism | Medium | Metabolite profiling, kinetic data. |
| Gnotobiotic/Germ-Free Models | Establish causal role of microbiome | Low | Comparative PK in presence/absence of microbes. |
| Targeted Metagenomics (qPCR) | Quantify specific microbial genes (e.g., bgl, bgus) | High | Abundance of metabolic potential. |
| Metabolomics (LC-MS/MS) | Comprehensive metabolite identification | Medium-High | Metabolic fate maps of the NP. |
| Stable Isotope Probing | Link specific taxa to metabolism | Low | Identification of NP-consuming organisms. |
Detailed Experimental Protocols
Protocol: In Vitro Fecal Fermentation for NP Metabolism
Objective: To simulate and analyze the metabolic conversion of an NP by the human colonic microbiome under controlled anaerobic conditions. Materials: See Scientist's Toolkit below. Procedure:
- Fecal Inoculum Preparation: Collect fresh fecal sample from healthy donor(s) under anaerobic conditions. Homogenize in pre-reduced, sterile phosphate-buffered saline (PBS, 1:5 w/v) under constant N~2~ flow. Filter through muslin cloth to remove large particulates.
- Fermentation Medium Preparation: Prepare complex medium (e.g., YCFA) with resazurin as redox indicator. Reduce medium by adding L-cysteine hydrochloride (0.5 g/L) and Na~2~S·9H~2~O (0.5 g/L). Boil, cool under N~2~/CO~2~ (80:20), and dispense anaerobically into serum bottles.
- Incubation Setup: In an anaerobic chamber, add filtered fecal slurry (10% v/v) to fermentation medium. Sponge-test compound (NP) at physiologically relevant concentration (e.g., 50 µM) into designated bottles. Include no-substrate (background) and no-inoculum (sterile control) bottles.
- Fermentation: Incate bottles at 37°C with gentle shaking (100 rpm) for 0-48 hours. Sample periodically (e.g., 0, 2, 6, 12, 24, 48h) using sterile, anaerobic syringes.
- Sample Processing: Centrifuge samples (13,000 x g, 10 min, 4°C). Collect supernatant for NP/metabolite analysis via LC-MS/MS. Pellet can be used for microbial community analysis (16S rRNA gene sequencing).
- Data Analysis: Quantify parent NP depletion and metabolite formation over time. Calculate degradation half-life and rate constants.
Protocol: Comparative Pharmacokinetics in Conventional vs. Germ-Free Mice
Objective: To delineate the absolute contribution of the gut microbiome to the systemic exposure of an orally administered NP. Materials: Germ-free (GF) and conventional (CV) mice of matched age/sex/strain, sterile gavage equipment, isolators, LC-MS/MS. Procedure:
- Animal Acclimatization: House GF mice in flexible film isolators and CV mice in SPF conditions. Provide autoclaved food and water ad libitum.
- Dosing Solution: Prepare NP solution in sterile vehicle suitable for oral gavage (e.g., 0.5% methylcellulose). Filter-sterilize (0.22 µm).
- Dosing & Sampling: Administer NP orally at set dose (e.g., 50 mg/kg) to both GF and CV cohorts (n=6-8). At serial time points (e.g., 0.25, 0.5, 1, 2, 4, 8, 12, 24h), collect blood via retro-orbital/saphenous vein into EDTA tubes under appropriate aseptic/isolator conditions.
- Sample Processing: Centrifuge blood (5000 x g, 10 min, 4°C) to obtain plasma. Store at -80°C until analysis.
- Bioanalysis: Quantify parent NP and major metabolites in plasma using a validated LC-MS/MS method.
- PK Analysis: Use non-compartmental analysis (e.g., Phoenix WinNonlin) to calculate AUC~0-inf~, C~max~, T~max~, clearance (oral), and half-life. Compare parameters between GF and CV groups using statistical tests (t-test). A significantly higher AUC in GF mice directly evidences microbial pre-systemic metabolism.
Pathway & Workflow Visualizations
Diagram Title: NP Fate: Oral vs IV Delivery & Microbial Intersection
Diagram Title: GF vs CV Mouse PK Study Workflow
The Scientist's Toolkit: Key Research Reagent Solutions
Table 3: Essential Materials for Microbiome-NP Metabolism Studies
| Item / Reagent Solution | Function & Application | Example Vendor/Cat. No. (Illustrative) |
|---|---|---|
| Pre-reduced Anaerobic Media (e.g., YCFA, BHI) | Provides nutrients for sustaining complex gut microbial communities during in vitro fermentation experiments. | ATCC Medium 2822 (YCFA Broth) |
| Anaerobic Chamber & Gas Mix | Creates oxygen-free environment (N~2~/CO~2~/H~2~) for processing strict anaerobic samples and setting up cultures. | Coy Laboratory Products, Baker Ruskinn |
| Germ-Free (Gnotobiotic) Mice | In vivo model to definitively establish causal role of microbiome in NP metabolism and PK. | Taconic Biosciences, Jackson Laboratories |
| Stable Isotope-Labeled NP Standards (e.g., ¹³C, ²H) | Enables precise tracking of NP fate, distinguishing microbial from host metabolites in complex matrices. | Custom synthesis (e.g., IsoSciences, Cambridge Isotopes) |
| β-Glucuronidase/Sulfatase Enzyme Mix (from H. pomatia) | In vitro deconjugation to assess the contribution of microbial enzymes to metabolite profiles in biofluids. | Sigma-Aldrich G7017 |
| 96-well In Vitro Fermentation System | High-throughput screening of NP metabolism by multiple donor microbiomes under controlled conditions. | Oxyrase, Inc. Anaerobic Culture System |
| DNA/RNA Shield for Fecal Samples | Preserves microbial community structure and gene expression at the moment of sampling for omics analyses. | Zymo Research R1101 |
| Targeted Metabolomics Kits (Bile Acids, SCFAs) | Quantifies key microbial-derived metabolites that can modulate host physiology and interact with NP PK. | Cell Biolabs STA-631 (SCFA), Biocrates Bile Acids Kit |
Within the broader thesis on ADMET challenges in natural product (NP) leads research, a critical bottleneck persists: the lack of standardized, high-quality, and well-curated ADMET (Absorption, Distribution, Metabolism, Excretion, and Toxicity) data. NPs, with their immense structural diversity and complexity, present unique ADMET profiles that are poorly captured by existing datasets built primarily for synthetic compounds. This gap severely hampers the development of robust predictive models, leading to high attrition rates in later development stages. This guide articulates the necessity for and methodology of creating benchmarked NP ADMET libraries to enable reliable in silico modeling.
The Imperative for Standardized NP ADMET Libraries
Unlike synthetic compound libraries, NPs often contain stereochemical complexity, macrocyclic structures, and high molecular flexibility. These features directly challenge standard ADMET assays, leading to inconsistent results across laboratories. Standardization addresses:
- Reproducibility: Enabling cross-validation of predictive models.
- Model Training: Providing a "ground truth" dataset for QSAR and machine learning.
- Benchmarking: Allowing comparison of different computational tools and experimental protocols.
Core Components of a Benchmark Library
A standardized library must encompass the following dimensions:
- Curated Chemical Data: Standardized InChI/InChIKey, SMILES with specified stereochemistry, original source organism, and purity verification data.
- Standardized Biological Data: ADMET endpoints generated under strict, documented protocols.
- Meta-data: Detailed experimental conditions, assay validation parameters, and raw data traces.
Experimental Protocols for Key ADMET Endpoints
Protocol for Measuring Metabolic Stability (Microsomal Half-Life)
Objective: Determine intrinsic clearance in human liver microsomes. Detailed Methodology:
- Incubation: Prepare 1 µM test NP in 0.1 M phosphate buffer (pH 7.4) with 0.5 mg/mL human liver microsomes. Pre-incubate for 5 min at 37°C.
- Initiation: Start reaction by adding NADPH regenerating system (1.3 mM NADP+, 3.3 mM glucose-6-phosphate, 0.4 U/mL G6P dehydrogenase, 3.3 mM MgCl₂).
- Time Points: Aliquot 50 µL of reaction mixture at t = 0, 5, 15, 30, 45, and 60 minutes into 100 µL of stop solution (acetonitrile with internal standard).
- Analysis: Centrifuge at 4000 rpm for 15 min. Analyze supernatant via LC-MS/MS. Quantify remaining parent compound.
- Data Processing: Plot ln(peak area ratio) vs. time. Calculate in vitro half-life (t₁/₂) from the slope (k): t₁/₂ = 0.693 / k.
Protocol for Caco-2 Permeability (Papp)
Objective: Assess intestinal permeability. Detailed Methodology:
- Cell Culture: Seed Caco-2 cells on Transwell inserts (3.0 µm pore, 24-well) at high density (1x10⁵ cells/insert). Culture for 21-23 days to ensure full differentiation.
- Assay: Add transport buffer (HBSS, 10 mM HEPES, pH 7.4) to donor (apical, 0.2 mL) and receiver (basolateral, 0.6 mL) compartments. Add test NP (10 µM) to donor side.
- Sampling: Take 50 µL from receiver side at 30, 60, 90, and 120 minutes, replacing with fresh buffer. Sample donor at start and end.
- Analysis: Quantify compound by LC-MS/MS. Calculate Apparent Permeability (Papp): Papp = (dQ/dt) / (A * C₀), where dQ/dt is transport rate, A is membrane area, and C₀ is initial donor concentration.
- Integrity Check: Confirm monolayer integrity with Lucifer Yellow rejection (>98%).
Protocol for hERG Inhibition Patch Clamp
Objective: Quantify blockade of the hERG potassium channel (cardiotoxicity risk). Detailed Methodology:
- Cell Preparation: Stably transfect HEK293 cells with hERG cDNA. Culture on coverslips.
- Electrophysiology: Use whole-cell patch clamp at 37°C. Hold cells at -80 mV, then step to +20 mV for 2 sec to activate channels, then to -50 mV for 5 sec to elicit tail current.
- Compound Application: Perfuse cells with escalating concentrations of NP (e.g., 0.1, 1, 10 µM). Record tail current amplitude at each concentration after steady-state inhibition is reached (~5-10 min perfusion).
- Data Analysis: Normalize current amplitude to baseline. Fit concentration-response curve to Hill equation to determine IC₅₀.
Table 1: Proposed Benchmark Values for NP ADMET Endpoints from Standardized Assays
| ADMET Endpoint | Assay System | Target Range for "Drug-like" NP | High-Risk Flag | Key Interfering NP Properties |
|---|---|---|---|---|
| Aqueous Solubility | Kinetic, pH 7.4 | >100 µM | <10 µM | High logP, crystalline lattice energy |
| Microsomal Stability | Human Liver Microsomes | t₁/₂ > 30 min | t₁/₂ < 15 min | Susceptible ester/lactone groups, polyphenols |
| Caco-2 Papp | Caco-2 monolayer | >5 x 10⁻⁶ cm/s | <1 x 10⁻⁶ cm/s | High MW (>500), H-bond donors >5 |
| Plasma Protein Binding | Human Plasma Equilibrium Dialysis | Fu > 5% | Fu < 1% | High lipophilicity, acidic groups |
| hERG Inhibition | Patch Clamp (IC₅₀) | IC₅₀ > 30 µM | IC₅₀ < 10 µM | Basic nitrogen, lipophilic aromatics |
| CYP450 Inhibition | Recombinant CYP3A4/2D6 | IC₅₀ > 10 µM | IC₅₀ < 1 µM | Michael acceptors, furanocoumarins |
Table 2: Example Curated Entries for a Benchmark Library
| NP Name (CID) | Solubility (µM) | Microsomal t₁/₂ (min) | Caco-2 Papp (10⁻⁶ cm/s) | hERG IC₅₀ (µM) | PPB (% Bound) | Assay Variability (RSD%) |
|---|---|---|---|---|---|---|
| Berberine (2353) | 154.2 | 12.5 | 2.1 | >50 | 98.5 | 8.2 |
| Curcumin (969516) | 0.11 | 8.2 | 0.5 | >50 | 99.1 | 15.7 |
| Silymarin (31553) | 45.6 | 25.7 | 1.8 | >50 | 89.2 | 10.3 |
| Rotenone (6758) | 1.5 | 45.3 | 18.9 | 0.8 | 95.4 | 7.5 |
Workflow for Library Creation and Validation
Title: Workflow for Creating a Standardized NP ADMET Library
The Scientist's Toolkit: Key Research Reagent Solutions
Table 3: Essential Materials and Reagents for NP ADMET Benchmarking
| Item | Function in NP ADMET Benchmarking | Key Considerations for NPs |
|---|---|---|
| Human Liver Microsomes (Pooled) | Study Phase I metabolic clearance. | Verify activity with NP-positive controls (e.g., testosterone for CYP3A4). |
| Caco-2 Cell Line (ATCC HTB-37) | Model intestinal permeability and efflux. | Use late-passage cells (P30+) for consistent expression of transporters relevant to NPs. |
| Recombinant CYP450 Enzymes | Identify specific CYP isoforms involved in metabolism. | Essential for NPs that inhibit or are metabolized by specific CYPs. |
| hERG-Transfected Cell Line | Assess cardiotoxicity risk via potassium channel blockade. | Requires rigorous electrophysiology; fluorescent dye kits offer medium-throughput alternative. |
| Biomimetic Chromatography Columns (IAM, HSA) | Predict membrane partitioning and protein binding. | Useful for high-throughput logD/logP and PPB estimation of complex NPs. |
| Stable Isotope-Labeled Internal Standards | Ensure accurate LC-MS/MS quantitation. | Crucial for NPs with inherent matrix effects or poor ionization. |
| Physicochemical Property Suites | Measure logP, pKa, solubility. | Use multiple methods (potentiometry, shake-flask) due to NP aggregation. |
Critical Pathways in NP ADMET and Model Integration
Title: Integration of Benchmark Data into Predictive ADMET Modeling
The creation of benchmarked, standardized ADMET libraries for natural products is not merely an exercise in data collection; it is a foundational step towards rationalizing NP-based drug discovery. By providing a consistent and high-quality dataset, the research community can develop predictive models that account for the unique chemotypes of NPs, ultimately reducing late-stage attrition and accelerating the development of novel therapeutics from nature's chemical arsenal. This initiative requires concerted collaboration across academia, industry, and consortia to establish, maintain, and continuously expand this critical resource.
Conclusion
The journey of a natural product from lead to drug is fraught with unique ADMET obstacles rooted in their evolutionary complexity. Success requires a multi-faceted strategy: embracing advanced, NP-tailored models for accurate profiling, employing strategic chemistry to optimize problematic properties, and rigorously validating approaches with comparative real-world data. The future lies in leveraging AI and machine learning trained on robust NP datasets, fostering interdisciplinary collaboration between natural product chemists, pharmacologists, and data scientists. By systematically addressing these challenges, the immense therapeutic potential of natural products can be reliably translated into safe, effective, and bioavailable medicines, ensuring nature's pharmacy remains a vital cornerstone of modern drug discovery.